Corresponding Author: ] htwong@phys.sinica.edu.tw
TEXONO Collaboration
Differentiation of Bulk and Surface Events in p-type Point-Contact Germanium Detectors for Light WIMP Searches
Abstract
The p-type point-contact germanium detectors are novel techniques offering kg-scale radiation sensors with sub-keV sensitivities. They have been used for light Dark Matter WIMPs searches and may have potential applications in neutrino physics. There are, however, anomalous surface behaviour which needs to be characterized and understood. We describe the methods and results of a research program whose goals are to identify the bulk and surface events via software pulse shape analysis techniques, and to devise calibration schemes to evaluate the selection efficiency factors. Efficiencies-corrected background spectra from the low-background facility at Kuo-Sheng Neutrino Laboratory are derived.
pacs:
95.35.+d, 29.40.-n,I Introduction
Searches and identification of dark matter cdmpdg12 are at the forefronts of experimental research. Germanium detectors with sub-keV sensitivities have been demonstrated as efficient means to probe Weakly Interacting Massive Particles (WIMPs, denoted by ), of mass ulege ; texono2007 . This motivates development of p-type point-contact germanium detectors () ppcge . This novel detector technique is also adopted in the studies of neutrino-nucleus coherent scattering with reactor neutrinos ulege . In both cases, the interaction channel is
| (1) |
where denotes the nucleus. The experimental signatures are the nuclear recoils, posing the challenging requirements of low background and low threshold to the detectors. Allowed region together with annual modulation signatures at and spin-independent elastic cross-section were implied by the CoGeNT experiment cogent , while limits were derived by the TEXONO texono2013 and CDEX-1 cdex12013 experiments.
The surface events in exhibit anomalous behaviour gesurface ; cogent ; texonopgebs ; texono2013 . It may limit the physics sensitivities, and can lead to false interpretation of the data. The analysis of these anomalous surface events is therefore an important experimental challenge to overcome before the full potentials of this novel detector technique at sub-keV energy can be realized.
We document this aspect of the TEXONO experiment texono2013 in this report. The physics origin, rise-time measurements, separation of bulk from surface events as well as the derivations of efficiency factors and the associated uncertainties are discussed in the subsequent sections. The data adopted to illustrate the analysis procedures are from a whose target is a cylindrical germanium crystal of 60.1 mm in diameter and 60.8 mm in height. The data size is 39.5 kg-days texono2013 . The application of the same analysis on other detectors or to different data set from the same detector gives consistent behaviour and results.
II Experiment Overview
Signals from the point-contact of the are supplied to a reset preamplifier. The output is distributed to (a) a fast timing amplifier (TA) digitized at 200 MHz which keeps the rise-time information, and (b) a shaping amplifier (SA) at 6 s shaping time digitized at 60 MHz which provides the trigger and measurement of energy (denoted by ). The pedestal fluctuation RMS is 55 , the test pulser FWHM is 141 while the electronic noise edge is at 400 electron-equivalent energy is used throughout in this article to denote detector response. The analysis threshold for this work is 500 .
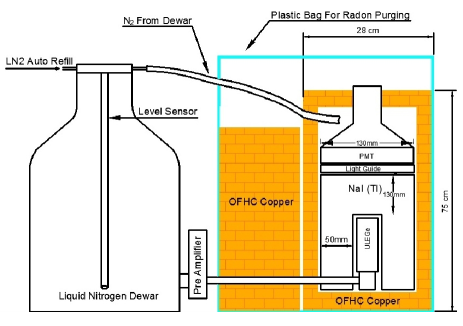
The detector system is installed at the Kuo-Sheng Reactor Neutrino Laboratory (KSNL) for the studies of neutrino physics ksnlneutrino and light WIMP searches texono2013 . The schematic diagram of the experimental set-up is given in Figure 1. Software pulse shape analysis identifies electronic noise background from the physics events characterized by genuine creation of electron-hole pairs in the crystal. The NaI(Tl) crystal scintillator serves as anti-Compton (AC) detector while the surrounding plastic scintillator panels provide the cosmic-ray (CR) veto. The physics events are categorized by “AC-(+)CR-(+)”, where the superscript denotes anti-coincidence(coincidence) with the signals. The selection procedures as well as the derivation of their efficiencies have been well-established ksnlneutrino ; texono2007 through the several experiments conducted at KSNL with this baseline design.
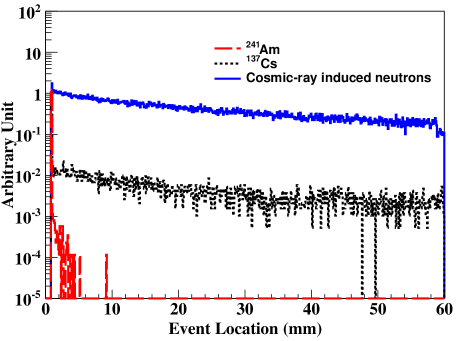
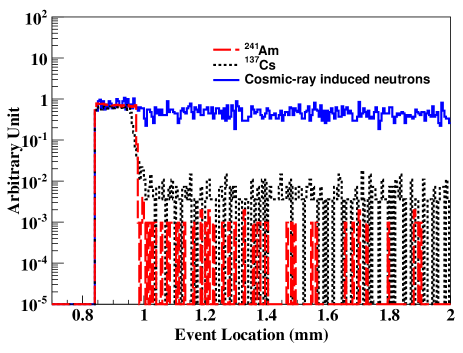
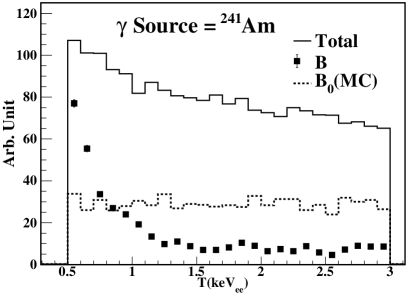
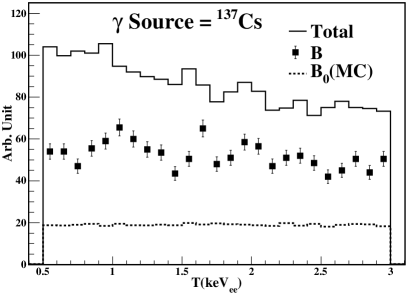
The tagging-manifolds correspond to events from different physics origins. Nuclear recoil events are uncorrelated with other detector components and uniformly distributed in the volume. Therefore, the candidate events are tagged by AC-CR-, while AC+CR- and AC-CR+ select ambient gamma and cosmic-ray induced high energy neutron events, respectively. In addition, calibration data are taken with low and high energy -sources (241Am at 59.5 and 137Cs at 661.7 , respectively). These sources give rise to events with different penetration-depth distributions, as depicted in Figures 2a&b. They therefore play complementary roles in probing the detector response over the entire active volume.
(a)
 (b)
(b)
III Bulk and Surface Events
III.1 Physics Origin
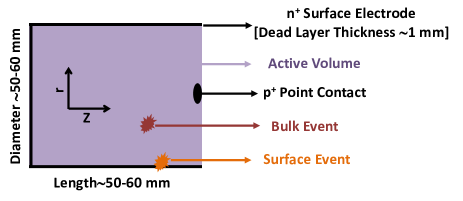
The schematic diagram of a typical sensor is displayed in Figure 3. The crystal is made of p-type germanium. The outer surface electrode is at positive high voltage towards which the electrons are drifted. The small central contact electrode is at zero-potential from which electrical signals are extracted.
(a)
 (b)
(b)

The outer surface electrode is fabricated by lithium diffusion. It has a finite thickness of typically 1 mm. Electron-hole pairs produced by radiations at the surface (S) layer are subjected to a weaker drift field than those at the crystal bulk region (B). A portion of the pairs will recombine while the residual will induce signals which are weaker and slower than those originated in B. That is, the S-events have only partial charge collection and slower rise-time. The thickness of the S layer for the in this work is measured to be (1.160.09) mm, via the comparison of simulated and observed intensity ratios of -peaks from a 133Ba source ba133 . In addition, through the comparison of the B- and S-intensities and spectra with the various -sources, it can be derived that there is no charge collection at a depth of less than 0.84 mm. The dead and inactive layers are illustrated in the event location distributions of Figures 2a&b. Only events with complete charge collection are considered as bulk events. The corresponding fiducial mass for the B-region is 840 g.
(a)
 (b)
(b)
| Bulk-Band | Surface-Band | ||||||
|---|---|---|---|---|---|---|---|
| LE | ME | HE | LE | ME | HE | ||
| (s) | 0.52 | 0.31 | 0.35 | 4.9 | 4.3 | 4.1 | |
| (s) | 0.025 | 0.023 | 0.009 | 0.20 | 0.05 | 0.02 | |
| (s) | 0.065 | 0.66 | |||||
| (s) | 1.21 | 0.28 | 0.11 | 2.75 | 1.24 | 0.69 | |
| (s) | 1.21 | 0.27 | 0.09 | 2.67 | 1.05 | 0.21 | |
| 0.6 | 3.3 | 8.0 | 1.3 | 2.5 | 4.2 | ||
This anomalous surface charge collection effect has been studied in early literature gesurface . However, the quenched S-signals are mostly 1 , below the typical Ge detector threshold of a few . Consequently, the S-layer in p-type germanium detectors were mostly classified as “dead”. With the advent of and the physics region of interest moving to the sub-keV range, it was observed cogent ; texono2013 ; texonopgebs that these anomalous S-events do exist and would dominate the low energy background. The identification of the S-events and the knowledge of efficiency factors therefore become crucial to fully exploit the sub-keV sensitivities of .
III.2 Rise-time Measurement
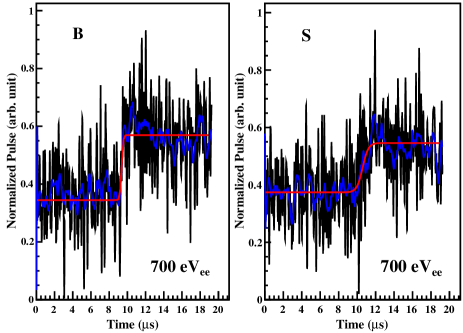
Typical TA-signals for B/S-events at low (700 ) and high (2 ) energy are depicted in Figures 4a&b, respectively. The TA rise-time () is parametrized by the hyperbolic tangent function
| (2) |
where , and are, respectively, the amplitude, pedestal offset and timing offset. The values of and are evaluated from the TA-pulses prior to the transition edge and through the difference of the asymptotic levels, respectively. The time difference as a function of energy between the TA-edge and the DAQ-trigger instant defined by the SA signals is pre-determined, and provides constraints on . The raw TA-pulses are first smoothed by the Softies-Kola filter sgfilter and fitted to Eq. 2 with (,) as free parameters. The results are then adopted as initial values to another fit of the same function directly on the raw pulse. The two procedures are complementary and are sensitive to the smoothed and raw pulses, respectively. The smoothed and best-fit functions are overlaid to the raw FADC signals in Figure 4.
A small fraction (8%) of events at low energy fails the fitting procedures. These events are excluded for subsequent analysis. The signal efficiency is accounted for through the survival probability of the doubly-tagged AC+CR+ samples, which is 80% at 500 .
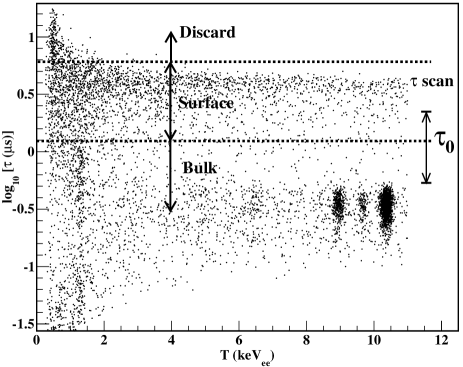
The scatter plot of versus for the AC-CR- events at KSNL is displayed in Figure 5a. Events with less(greater) than a selected cut-value (=1.23 s in this analysis) are categorized as B(S). A summary of the width and resolution contributions to the bands is given in Table 1. The fitting errors () correspond to those due to the software algorithms. They are small compared to the measured width () from the various calibration data set. There are two contributions to the -width: (i) the intrinsic width is due to the non-uniform response over the detector volume producing different , while (ii) the -resolution is due to fluctuations of pulse shape for events at the same nominal . The ’s are measured from the surface-dominating 241Am events at 10 and the homogeneously-distributed Ga-X-rays at 10.37 for the S- and B-bands, respectively, while is derived via .
At , the is much less than the separation of the bands from . The measurements of therefore provide valid information on the locations of the events and, in particular, can efficiently differentiate the S- from B-events. This behaviour manifest as a distinct two-band structure in Figure 5a, with a small fraction (about 8% within 36 in the AC-CR- sample) of events in the intermediate transition zone. By studying the corresponding fractions of events with 241Am (1%) and 137Cs (7.5%) -sources, a thickness of 0.16 mm for this zone is derived. The choice of is equivalent to a definition of the spatial borderline between B/S within this transition thickness. This gives rise to a systematic uncertainty in the evaluation of the fiducial mass. It translates to about 3% of the total error at 500 which, as displayed in Table 2, is negligible compared to the other error sources.
At where is comparable to the band separation, there exist contaminations between the B- and S-events which lead to the merging of the bands. The methods and results to evaluate the leakage factors and to correct the measured spectra are discussed in the subsequent sections.
The -distribution of the candidate samples at 700 are displayed in Figure 5b, together with those due to low and high energy -rays and high energy neutrons. The B-events near analysis threshold have similar distributions for all samples and are independent of locations. Different distributions in the S-events are observed. These can be accounted for by their different penetration profiles depicted in Figure 2b.
(a)
 (b)
(b)
(a)
(b)
(c)
(a)
 (b)
(b)
Anomalously slow rise-time events are observed in excess at low energy from the AC-CR- samples. Their origin is not yet identified electronic noise is a possibility since such events are uncorrelated with other detector components. These large- events are categorized as “Discard” in Figure 5, and are rejected in the subsequent analysis. The of the B-band at 500 is 1.2 s, such that the mean is about 4.5 RMS from the Discard region. The leakage of B-events is negligible, and there is no loss in signal efficiencies.
(a)
 (b)
(b)
IV Efficiencies Measurement and Correction
IV.1 Formulation
Calibration of the BS-cut requires the measurement of the bulk-signal retaining () and surface-background suppressing () efficiencies. This is achieved by relating these efficiency factors with the observed and actual rates, denoted by (B,S) and (,), respectively.
The normalization assignment (,)=(B,S) is made on events within =2.7-3.7 . It is equivalent to setting and to 1.0. This energy range is selected since it is above the complications of the L-shell X-rays at 1 as well as the physics region in dark matter analysis.
At lower energy, (B,S) and (,) are related by the coupled equations:
| (3) |
with an additional unitarity constrain: +=B+S. The derivation of (,) therefore involves at least two measurements of (B,S) where the actual rates (,) are known.
IV.2 Calibration Data
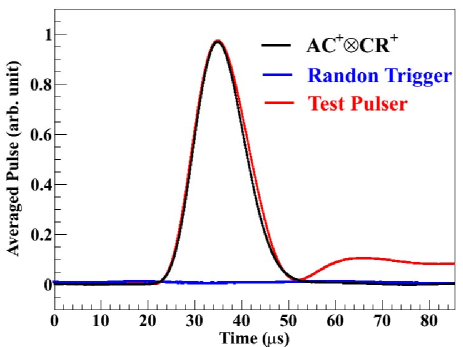
The averaged TA and SA pulse shapes of AC+CR+ physics samples, together with random trigger and test pulser events, are displayed in Figures 6a&b, respectively.
The pulser events exhibit different profiles as the physics samples, and therefore are not appropriate for calibration purposes. (We note, however, that the leading edge of their shaped pulses are identical, such that pulser events can be applied in the measurement of trigger efficiencies.) Calibration data with 241Am, 137Cs and in situ cosmic-ray induced fast neutrons are adopted instead. They have vastly different distributions in their events locations within the detector as illustrated in Figure 2a, and hence can play complementary roles in the calibration.
-
1.
Surface-rich events with 241Am and 137Cs -ray sources
As displayed in Figures 7a&b, the measured B-spectra are compared to the reference B derived from full simulation with surface layer thickness of 1.16 mm as input. The simulated B-spectra due to external -sources over a large range of energy are flat for T10 .
Consistent results are obtained for different source orientations relative to the sensor. The adopted data for analysis are those with sources placed at the top facing the flat surface of the crystal. They provide the most accurate measurements since this is the direction where the passive materials between the sources and the crystal are minimal and their thickness is the most uniform by construction. -
2.
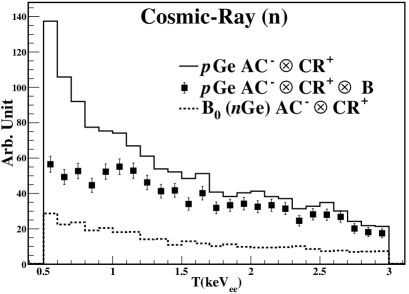
Bulk-rich events with cosmic-ray induced fast neutrons
A 523 g n-type point-contact germanium () detector was constructed. The components and dimensions are identical to those of . The surface of is a p+ boron implanted electrode of sub-micron thickness. There are no anomalous surface effects. Data are taken under identical shielding configurations at KSNL. The trigger efficiency is 100% above T=500 , and energy calibration is obtained from the standard internal X-ray lines.
The AC-CR+ condition selects cosmic-ray induced fast neutron events without associated -activities, which manifest mostly as bulk events. This tag in is therefore taken as the B-reference and compared with those of AC-CR+B in , as depicted in Figure 7c.
IV.3 Results on (,)
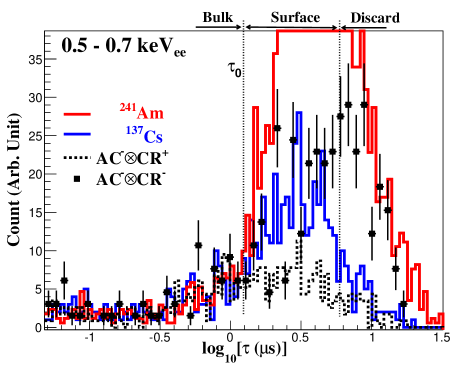
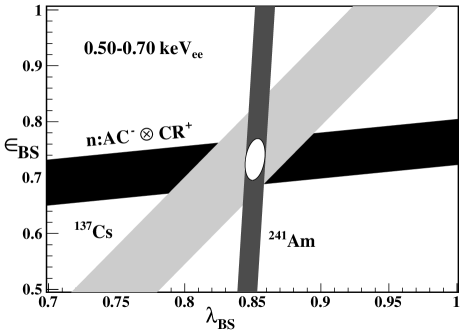
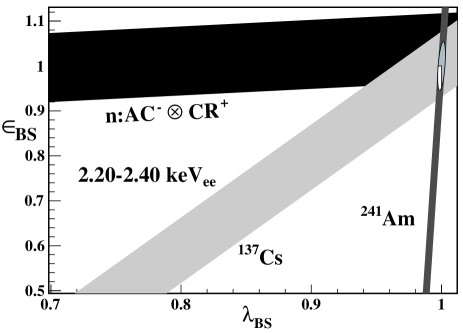
Using the calibration data discussed above, (,) are derived by solving the coupled equations in Eq. 3. The three allowed bands at 0.50.7 and at 2.202.40 are illustrated in Figures 8a&b, respectively. The different orientations of the bands are consequences of different B:S ratios which are due to the different penetration-depth distributions of Figure 2a. The surface-rich -events and the bulk-rich cosmic-ray induced neutron-events play complementary roles in constraining and , respectively. The bands have common overlap regions, indicating the results are valid for the entire detector volume. It is therefore justified to apply (,) derived from the calibration data to the physics samples.
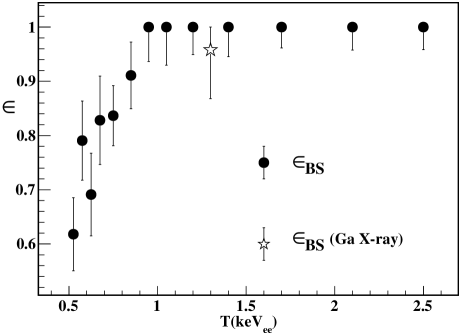
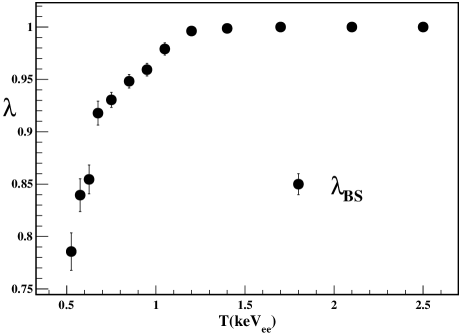
The energy dependence of (,) are displayed in Figures 9a&b. By comparing the measured in situ Ga-L X-ray peak at 1.3 after BS-selection to that predicted by the corresponding K-peak at 10.37 , an additional data point on is independently measured. This provides a cross-check to the calibration procedures and indicates consistent results.
The measured (,) are close to unity at . It follows from being less than the separation of the bands from . There is no leakage between the B- and S-events originated away from the transition zone. The ambiguity in the B/S assignment to events within the zone is accounted for through a systematic uncertainty on the fiducial mass, which is negligible compared to the total error from Table 2.
| Energy Bin | 0.500.55 | 0.951.00 | 1.901.95 |
|---|---|---|---|
| Measurement and Total Error () | 10.65.0 | 9.82.4 | 6.11.6 |
| Relative Contributions to Total Error† : | |||
| I) Uncertainties on Calibration (,) from Fig. 9 : | 0.26 | 0.064 | 0.03 |
| II) Measurement Error on from Eq. 4 : | |||
| Statistical Errors of (B,S) | { 0.41 | { 0.90 | { 0.99 |
| Scaling by | 2.29 | 1.07 | 1.00 |
| Combined | 0.95 | 0.96 | 0.99 |
| III) Systematic Uncertainties due to Parameter Choice : | |||
| (i) Rise-time Cut-Value | { 0.12 | { 0.25 | { 0.09 |
| (ii) Fiducial Mass from Choice of | 0.03 | 0.06 | 0.06 |
| (iii) Normalization Range | 0.13 | 0.10 | 0.07 |
| (iv) (,)=(B,S) at Normalization | 0.08 | 0.03 | 0.03 |
| (v) Choice of Discard Region | 0.05 | 0.01 | 0.001 |
| Combined Systematic Error | 0.20 | 0.27 | 0.12 |
V Efficiencies-Corrected Background Spectra
V.1 Efficiencies-Corrected Spectra
(a)
 (b)
(b)
Once are measured with the calibration data, the efficiency-corrected (,) of the physics samples can be derived via the solution of Eq. 3:
| (4) |
The formulae can be understood as follows: () should account for the loss of efficiency in the measurement of B(S) in the first positive term, followed by a subtraction of the leakage effect from S(B) in the second negative term.
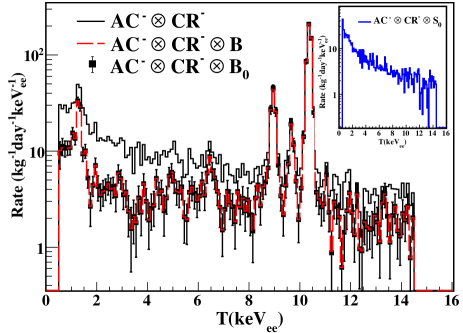
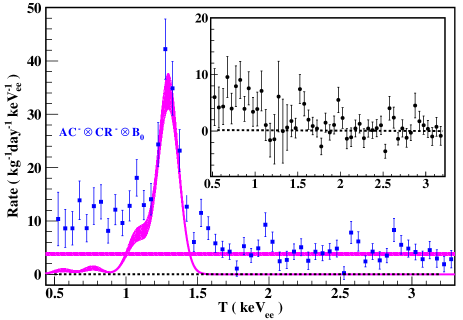
The AC-CR- tagged events from data taken at KSNL at various stages of the analysis are depicted in Figure 10a. The measured-B and corrected- spectra are almost identical. At , this is a direct consequence of . At low energy, the efficiency-correcting and background-subtracting effects compensate each other in this data set.
After subtracting a flat background due to high energy -rays and the known L-shell X-rays contributions predicted by the accurately-measured K-peaks at higher energy, the residual spectrum is shown in the inset of Figure 10b. It still shows excess of events at the sub-keV region. The origin is not yet identified, and the studies towards the understanding of which are intensely pursued. Under the conservative assumption that WIMPs signals cannot be larger than the residual excess, constraints on cross-section versus were derived. They probed and excluded some of the allowed regions on light WIMPs from earlier experiments texono2013 .
V.2 Error Sources and Assignment
The errors on (,) are shown in Figures 9a&b. They are derived from the global fits on the allowed bands in Figure 8. Standard error propagation techniques are applied to derive the resulting uncertainties on (,) via Eq. 4.
The uncertainties include contributions from their own measurement errors, the (,) calibration errors, as well as systematic uncertainties. Their relative contributions in three representative energy bins are summarized in Table 2. The leading contribution is the statistical errors on (B,S), scaled by a factor 1/. This can be seen from the structure of the formulae in Eq. 4. The total errors therefore increase as and deviate from unity towards the analysis threshold of 500 .
Systematic uncertainties on the BS-selection procedure originate from the choice of and its effect on the fiducial mass, the choice of the normalization energy range at , the assignment of (,)=(B,S) in this interval, as well as the choice of the Discard region. They are estimated by the shifts in as the parameters are varied in the vicinity of their optimal values. As an illustrated example, the “-scan” range for is depicted in Figure 5a. In all cases, the shifts are small compared to the total errors. Accordingly, the contributions of systematic uncertainties are minor, as illustrated in Table 2.
VI Conclusion and Prospects
The results on (,) calibration and the subsequent (,) measurements in confirm that both signal efficiencies and background leakage to the signal region are crucial in the analysis, all the more so since the efficiency factors are significantly less than unity at the analysis threshold, which is 500 in this work. A mis-placement of =1 would introduce excess of events at low energy which could have been mis-interpreted as signatures of light WIMPs. Conversely, genuine WIMP signals can also be masked out through an incorrect assignment of the factors.
We note that it is necessary to derive (,) and (,) by solving the coupled equations Eq. 3 to obtain Eq. 4. If the two efficiency corrections were performed separately, an incorrect expression of would follow. Deviations from the correct values would depend on the B:S ratio, and would be more pronounced when (,) decrease. A relative error of order unity would be introduced to for this data set at threshold. We note that this comment as well as Eqs. 3&4 also apply to generic event selection procedures in cut-based analysis.
Despite advances in the BS-selection and efficiency factors measurements discussed in this report, there are still fundamental challenges to further boost the sensitivities on the studies of sub-keV events with . The 1/ factor of Eq. 4 increases the uncertainties to the physics signal near threshold. In addition, depends on measurements of all of the input parameters (,,B,S). This calls for caution in the investigations of time variation and modulation effects on , in which the time stabilities of these input have to be independently monitored.
To overcome these difficulties, the elimination of the anomalous surface effects at the hardware raw signal level in Ge detectors is much more desirable. To these ends, the merits and operation of are being studied. This detector has already proved crucial to provide calibration data to the . Research efforts are being pursued to turn it into a target with comparable sensitivities.
A by-product of this investigation is that the distributions are different for different sources, as depicted in Figure 5b. Therefore, the studies of signal rise-time may shed light on the nature of the background. Further systematic and quantitative studies are under way.
VII Acknowledgment
This work is supported by the Academia Sinica Investigator Award 2011-15, contracts 99-2112-M-001-017-MY3 and 102-2112-M-001-018 from the National Science Council, Taiwan.
References
- (1) M. Drees and G. Gerbier, Review of Particle Physics Phys. Rev. D 86, 289 (2012), and references therein.
- (2) Q. Yue et al., High Energy Phys. and Nucl. Phys. 28, 877 (2004); H.T. Wong et al., J. Phys. Conf. Ser. 39, 266 (2006).
- (3) H.T. Wong, Mod. Phys. Lett. A 23, 1431 (2008); S.T. Lin et al., Phys. Rev. D 79, 061101(R) (2009).
- (4) P.N. Luke et al., IEEE Trans. Nucl. Sci. 36, 926 (1989); P.A. Barbeau, J.I. Collar and O. Tench, JCAP 09, 009 (2007); C.E. Aalseth et al., Phys. Rev. Lett. 101, 251301 (2008).
- (5) C.E. Aalseth et al., Phys. Rev. Lett. 106, 131301 (2011); C.E. Aalseth et al., Phys. Rev. Lett. 107, 141301 (2011); C.E. Aalseth et al., Phys. Rev. D 88, 012002 (2013); C.E. Aalseth et al., arXiv:1401.3295 (2014).
- (6) H.B. Li et al., Phys. Rev. Lett. 110, 261301 (2013), and references therein.
- (7) W. Zhao et al., Phys. Rev. D 88, 052004 (2013); K.J. Kang et al., Chin. Phys. C 37, 126002 (2013).
- (8) U. Tamm, W. Michaelis, and P. Coussieu, Nucl. Instrum. Meth. 48, 301 (1967); M.G. Strauss and R.N. Larsen, Nucl. Instrum. Meth. 56, 80 (1967); E. Sakai, IEEE Trans. Nucl. Sci. 18, 208 (1971).
- (9) H.T. Wong, Int. J. Mod. Phys. D 20, 1463 (2011).
- (10) H.B. Li et al., Phys. Rev. Lett. 90, 131802 (2003); H.T. Wong et al., Phys. Rev. D 75, 012001 (2007); M. Deniz et al., Phys. Rev. D 81, 072001 (2010).
- (11) E. Aguayo et al., Nucl. Instrum. Meth. A 701, 176 (2013).
- (12) W.H. Press, S.A. Teukolsky, W.T. Steeling and B.P. Flannery Numerical Recipes in C, 2nd ed., Ch.14, Pg.650, Cambridge University Press (2002).