Discovery of the Young L Dwarf WISE J174102.78464225.5
Abstract
We report the discovery of the L dwarf WISE J174102.78464225.5, that was discovered as part of a search for nearby L dwarfs using the Wide-field Infrared Survey Explorer (WISE). The distinct triangular peak of the H-band portion of its near-infrared spectrum and its red near-infrared colors ( = 2.350.08 mag) are indicative of a young age. Via comparison to spectral standards and other red L dwarfs, we estimate a near-infrared spectral type to be L72 (pec). From a comparison to spectral and low-mass evolutionary models, we determine self-consistent effective temperature, log , age, and mass values of 1450100 K, 4.00.25 (cm s-2), 10-100 Myr, and 4-21 MJup, respectively. With an estimated distance of 10-30 pc, we explore the possibility that WISE J174102.78-464225.5 belongs to one of the young nearby moving groups via a kinematic analysis and we find potential membership in the Pictoris or AB Doradus associations. A trigonometric parallax measurement and a precise radial velocity can help to secure its membership in either of these groups.
1 Introduction
The Wide-field Infrared Survey Explorer (WISE) has heralded in an unprecedented era of substellar discovery. WISE surveyed the entire sky at 3.4, 4.6, 12, and 22 m (W1, W2, W3, and W4 bands), with channels W1 and W2 designed specifically to be sensitive to cold brown dwarfs with effective temperatures () less than 1400 K (Wright et al., 2010). With the substantial sample of substellar objects discovered by WISE (e.g. Kirkpatrick et al. 2011, Mace et al. 2013, and Thompson et al. 2013), we can now perform individual in-depth studies to probe the evolution of such objects. It is critical when investigating the evolution of substellar objects to identify sources at various ages in order to construct a complete evolutionary sequence. The majority of L and T dwarfs discovered to date are old (age 1 Gyr), consistent with a field population (Dahn et al. 2002, Schmidt et al. 2007, Faherty et al. 2009). Young brown dwarfs are rarer, but have distinctive characteristics that distinguish them from their older counterparts. Since young dwarfs are still contracting to their final radii, their surface gravities are lower, which can produce noticeable effects in the optical and near-infrared spectra of substellar objects (e.g. Kirkpatrick et al. 2006, Cruz et al. 2009, Bonnefoy et al. 2013, Allers & Liu 2013). Consequently, many young substellar objects have been identified by their low surface gravity spectral features, such as enhanced VO bands, narrow or weak alkali lines, a triangular H-band spectral shape, and red near-infrared colors (Cruz et al. 2007, Kirkpatrick et al. 2008, Cruz et al. 2009, Kirkpatrick et al. 2010, Faherty et al. 2012, and Thompson et al. 2013). Studying these young field L and T dwarfs will help to constrain and improve substellar evolution models, while additional examples of young, late-type substellar objects can help to fill in the evolutionary gaps of these astronomical bodies. These models will become increasingly important in interpreting results from the next generation of extreme adaptive optics imagers (i.e. the Gemini Planet Imager (GPI), Project 1640, the Spectro-Polarimetric High-contrast Exoplanet REsearch (SPHERE), the Coronagraphic High Angular Resolution Imaging Spectrograph (CHARIS)) as they attempt to image young exoplanets directly, since the determination of an accurate age can significantly affect the mass estimates of brown dwarfs and exoplanets (see, for example, the discussion of HR 8799 b, c, d, and e in Oppenheimer et al. 2013).
Here we report the discovery of the young, late-type object WISE J174102.78464225.5 (WISE 17414642, henceforth), discovered as part of a search for bright L and T type objects using WISE data. We summarize the identification of WISE 17414642 and our subsequent observations in Section 2. In Section 3 we discuss the spectral and physical characteristics of WISE 17414642, and provide a kinematic analysis where we evaluate potential young moving group membership for this object.
2 Identification and Observations
2.1 Identification
WISE 17414642 was discovered as part of a search for bright L and T dwarfs. A complete description of the selection criteria is outlined in Section 2.1 of Thompson et al. (2013). To summarize, candidates are required to have a color 0.4 and a W2 signal to noise ratio (SNR) 20. In an attempt to exclude extragalactic objects, candidates are also required to have 0.96() 0.96. Candidates are required to have no matching 2MASS or USNO source within 3″to ensure moderate to high proper motions. Lastly, candidates are required to not be flagged as a solar system object. This search has resulted in the detection of 55 L and T dwarfs, previously discussed in Kirkpatrick et al. (2011), Mace et al. (2013), and Thompson et al. (2013).
2.2 Observations
2.2.1 IRTF/SpeX
We observed WISE 17414642 on the night of 2012 July 19 UT employing the medium-resolution infrared spectrograph SpeX (Rayner et al., 2003) at the 3 m NASA Infrared Telescope Facility (IRTF) on Mauna Kea. Observations were conducted in prism mode with a 05 wide slit, which achieves a resolving power (/) of 150 over the range 0.8 - 2.5 m. A series of 10 120s exposures were obtained at two different nod positions along the 15 long slit, which was oriented to the parallactic angle. The A0V star HD 161706 was observed at a similar airmass as WISE 17414642 for telluric correction and flux calibration. Calibration spectra of internal flat field and argon arc lamps were obtained for flat fielding and wavelength calibration. The data were reduced with Spextool, the IDL-based data reduction package for SpeX (Cushing et al., 2004), which first corrected raw frames for non-linearity then pair-subtracted and flat fielded. The spectra were then optimally extracted (e.g., Horne, 1986) and wavelength calibrated using argon lamp exposures. Finally, multiple spectra were averaged together, corrected for telluric absorption and flux calibrated (Vacca et al., 2003). The spectrum was absolutely flux calibrated using 2MASS magnitudes and the procedure outlined in Cushing et al. (2005).
2.2.2 Magellan/FIRE
WISE 17414642 was observed with the Folded-port Infrared Echellette (FIRE; Simcoe et al. 2013) on the Magellan Baade Telescope on 2013 August 9 and 2013 August 10 UT in cross-dispersed echelle mode (/ 6000) from 0.65 - 2.55 m. Four 500s exposures were taken each night in an ABBA dither pattern. The A0V stars HIP 84305 (V = 8.41) and HIP 89666 (V = 8.65) were also observed for telluric correction purposes. We also obtained flat-field and arc lamp (ThAr) exposures for pixel response and wavelength calibration. Data were reduced using the FIREHOSE package, which employs modified routines from the SpeXtool data reduction package (Vacca et al. 2003, Cushing et al. 2004).
3 Discussion
3.1 Comparison to Spectral Standards
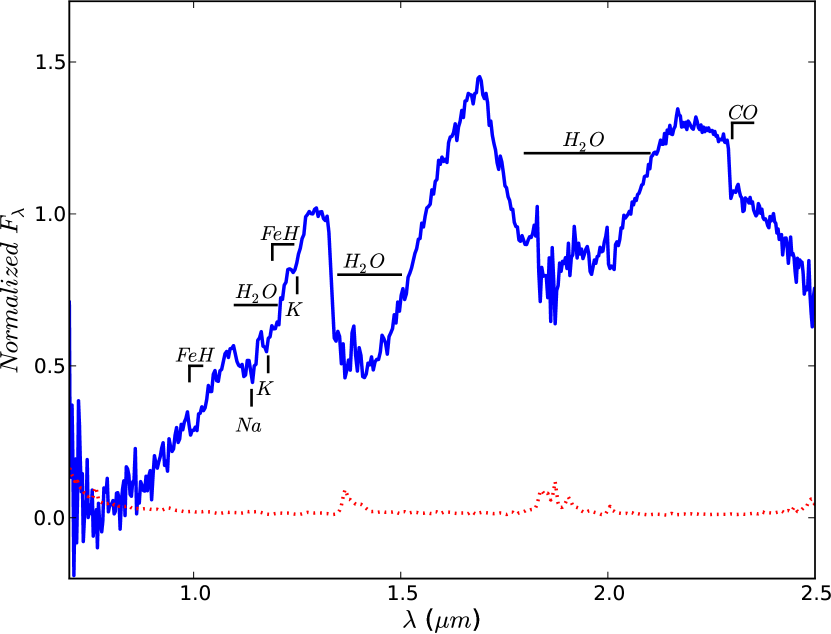
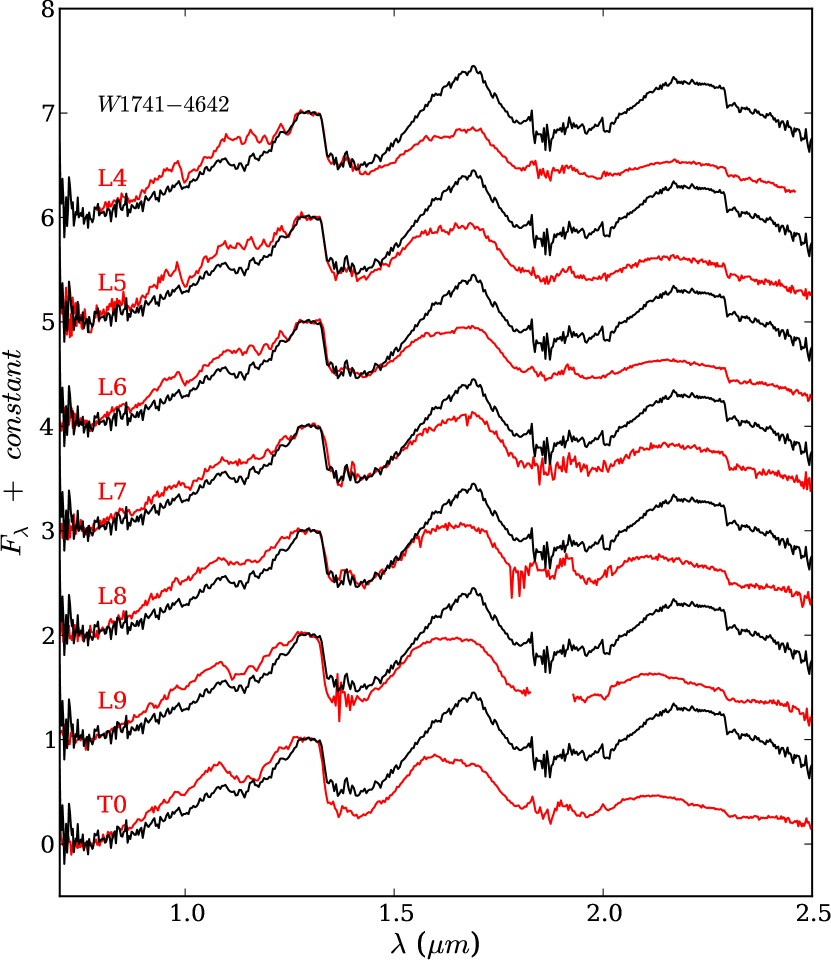
The SpeX near-infrared spectrum is presented in Figure 1, with prominent atomic and molecular lines labeled. We first attempted to determine the spectral type of WISE 17414642 by comparing the J-band spectral morphology with that of the near-infrared spectral standards (from Kirkpatrick et al. 2010 - obtained from the Spex Prism Spectral Library111http://pono.ucsd.edu/adam/browndwarfs/spexprism/library.html). A comparison of WISE 17414642 to several spectral standards is shown in Figure 2. The figure makes clear that WISE 17414642 is redder than normal L dwarfs, and a single well-fitting spectral type is not easily determined by direct comparison (see Mace et al. 2013 for an in depth discussion on the difficulties encountered when comparing red dwarfs to spectral standards). We conservatively estimate the spectral type of WISE 17414642 to be L72 from the comparison to L and T dwarf spectral standards based on H2O and FeH band strengths.
We also investigated the near-infrared spectral type indices examined by Allers & Liu (2013). Most of these indices are degenerate for spectral types later than L5. Because the by-eye comparisons suggest a spectral type later than L5, only the H2OD index, originally defined by McLean et al. (2003), is useful. We calculated an H2OD index of 0.78 which, utilizing the polynomial fits in Table 3 of Allers & Liu (2013), gives a spectral type of L5.5.
3.2 Comparison to Red L Dwarfs
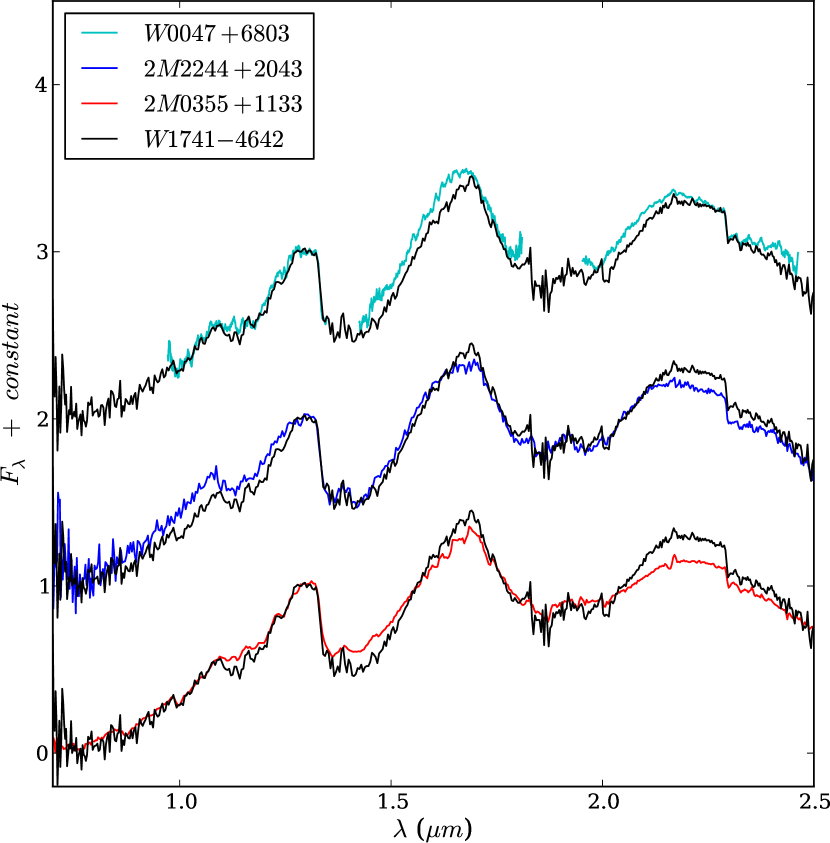
The spectrum of WISE 17414642 was compared to other unusually red late-type L dwarfs to aid in constraining its spectral type. Figure 3 shows the near-infrared SpeX spectrum of WISE 17414642 compared with the red L dwarf 2MASSW J224431.67204343.3 (2M2244+2043; SpT (NIR) = L7.5 (pec) - Kirkpatrick et al. 2008, SpT = L6 (VL-G) Allers & Liu 2013), the young L dwarf 2MASS J035523.27113343.7 (2M0355+1133; SpT (opt) = L5 - Faherty et al. 2013), and the red L dwarf WISEP J004701.06680352.1 (W00476803; SpT (NIR) = L7.5 (pec) - Gizis et al. 2012). We derive a near-infrared spectral type of L7 (pec) for 2M0355+1133 using the method outlined in Appendix A. All three spectra match WISE 17414642 reasonably well, suggesting a spectral type range of L7 - L8. While these red L dwarfs are much better comparisons than the L dwarf spectral standards, differences can still be seen. Figure 3 shows that WISE 17414642 is both redder than 2M03551133 and 2M22442043 and has a more peaked H-band profile then 2M22442043. WISE 17414642 also shows deeper H2O absorption than 2M03551133. W00476803 is the best match at J, though is slightly redder than WISE 17414642. A more detailed comparison of individual spectral lines is performed in Section 3.4.2. Combining the estimated spectral type of WISE 17414642 from the comparison of spectral standards, the H2OD spectral type index, and the comparison to other red L dwarfs, we assign a spectral type of L72 (pec) to WISE 17414642.
3.3 Comparison to Model Spectra
The “BT-Settl” models from the Phoenix/NextGen group (Allard et al., 2011), using the solar abundances from Asplund et al. (2009), were used to estimate the and log values of WISE 17414642. We compared models from 1000 to 2000 K in steps of 100K and log values of 3.5 to 5.5 (cm s-2) in steps of 0.5 dex to our measured SpeX spectrum. In order to compare the models to our measured spectrum, each model spectrum was resampled to be uniform in ln() space, smoothed with a Gaussian kernel to a resolving power of 150, and resampled onto the same wavelength grid as the SpeX spectrum. Following Cushing et al. (2008), a goodness of fit parameter is evaluated for each model spectrum. The goodness of fit parameter is defined as
| (1) |
where corresponds to each data pixel, is the flux density of the data, is the flux density of the model , and are the errors for each observed flux density. The parameter is a multiplicative constant given by
| (2) |
is equivalent to , where is the stellar radius and is the distance (see Section 3.4.1). We performed a Monte Carlo simulation using our observed spectrum to determine the uncertainty of the best fitting spectrum (e.g. Cushing et al. 2010). We generated 1000 simulated data sets using both the absolute flux calibration uncertainty and the individual flux uncertainties at each wavelength. Each measured flux in the SpeX spectrum is randomly drawn from a single Gaussian distribution centered on the observed flux with a width given by the observed variance. The entire spectrum is also multiplied by a factor randomly drawn from a Gaussian distribution centered at one with a width given by the absolute flux calibration uncertainty.
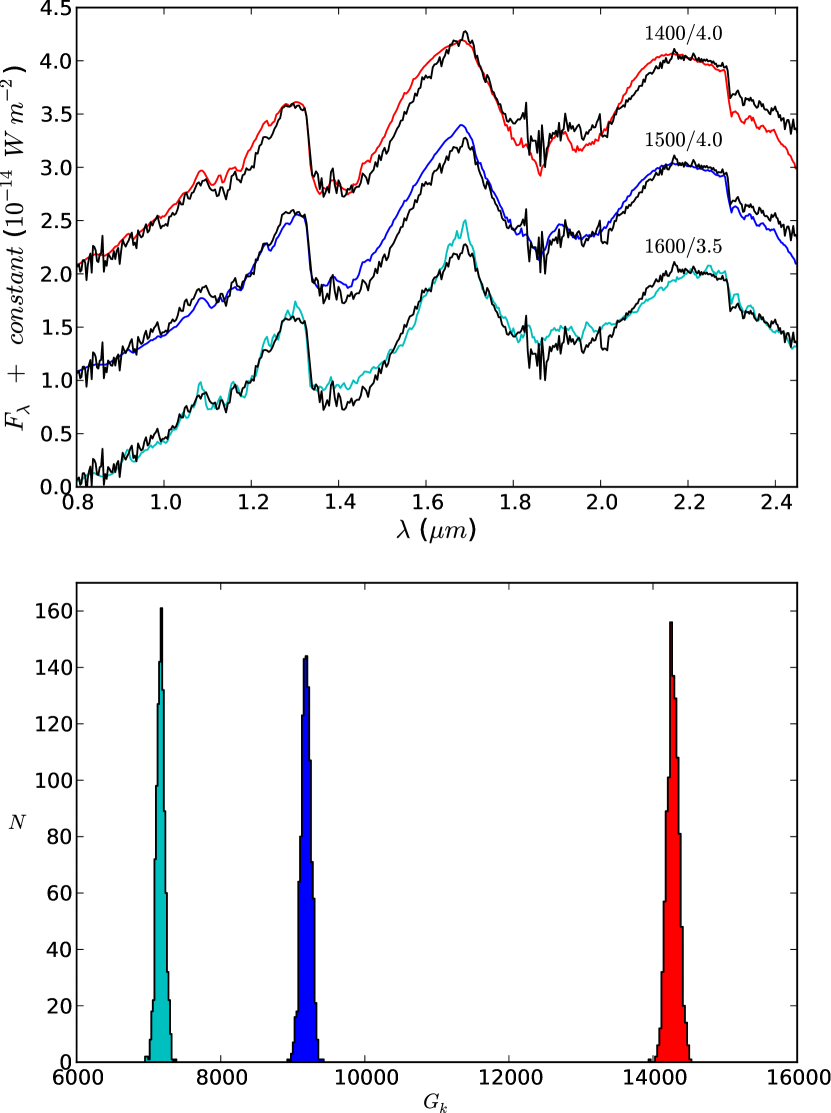
Several low-gravity spectral models provided the best fits (Figure 4). The best fitting model spectrum was that with = 1600 K and a log value of 3.5. In Section 3.4.3 we show that a of 1600 K and a log of 3.5 suggest an unphysical age of 5 Myr for WISE 17414642. Therefore, we selected the next two best fitting spectral models ( = 1500 K and log = 4.0; = 1400 K and log = 4.0) for further analysis. The three best fitting models are displayed in Figure 4. We take = 1450100 K and log = 4.00.25 (cm s-2) as our final estimates for these parameters. This temperature is in agreement with temperatures deduced for other L7 dwarfs (Golimowski et al., 2004).
3.4 Physical Characteristics
3.4.1 Distance
A byproduct of the model fitting technique is an estimate of the multiplicative constant that is equivalent to (/)2, where is the radius of the star and is the distance from Earth. Therefore, a stellar radius, in combination with model spectrum comparisons, can provide a distance estimate. We utilized four sets of low-mass evolutionary models combined with our best fit and log ranges to estimate a stellar radii; the “COND” models (Baraffe et al., 2003), the “DUSTY” models (Chabrier et al., 2000), and the cloudy and cloudless models of Saumon & Marley (2008). For the “DUSTY” models, dust grains are suspended, while in the “COND” models dust is removed from the photosphere. Similarly, the cloudy and cloudless models of Saumon & Marley (2008) account for cloud sedimentation, where the sedimentation efficiency parameter () = 2 for the cloudy models and the cloudless models include no opacity from clouds. We found a radius range of 0.137-0.161 R☉ (1.36-1.60 RJup) for the “DUSTY” and “COND” models, and a range of 0.1398-0.1752 R☉ (1.39-1.74 RJup) for the Saumon & Marley (2008) models. This range, in combination with the values determined via model fitting result in a so-called “spectroscopic parallax” (Bowler et al., 2009) of 8-11 pc.
We also estimate photometric distances using the relations of Looper et al. (2008a), Kirkpatrick et al. (2011), and Dupuy & Liu (2012). For a spectral type range of L5-L9 and the 2MASS and WISE magnitudes given in Table 1, we calculate distance ranges of 12-25 pc and 11-28 pc for the Looper et al. (2008a) and Dupuy & Liu (2012) relations, respectively. For the WISE W2 relation of Kirkpatrick et al. (2011), we calculated a distance range of 11-14 pc. The distance estimates using the , W1, and W2 magnitudes provided the closest matches to the distance derived via spectroscopic parallax (11-20 pc, 11-17 pc, and 10-15 pc for , W1, and W2, respectively), which could imply that the magnitudes from the wavelength region between and WISE W2 is the least affected by youth. This is further supported by Figure 9 of Faherty et al. (2013), which shows that the absolute flux of 2M03551133 matches the field L5 2M1507-16 well at K, while it is underluminous everywhere blueward of 2 m. Liu et al. (2013) also find that many of their young mid-L dwarfs with measured parallaxes are fainter at J than field objects of comparable spectral type. This is supported by the results of Faherty et al. (2012), in which they find that 80% of objects in their low-gravity and young companion L dwarf sample are underluminous at J. According to Table 10 of Faherty et al. (2012), low-gravity and young companions are, on average, 0.48 mag underluminous at J and only 0.17 mag underluminous at K. If WISE 17414642 is similarly underluminous at J, then one would expect the distance estimates based on its J-band magnitude to be overestimated. We found that the J-band photometric distances were the largest of all estimates; 17-28 pc and 16-26 for spectral types L5-L9 according to the Dupuy & Liu (2012) and Looper et al. (2008a) relations, respectively. We conservatively take 10-30 pc as our final distance estimate.
3.4.2 Empirical Age
The near-infrared spectrum of WISE 17414642 shows a distinctly peaked H-band continuum, a well known characteristic of young brown dwarfs (Lucas et al. 2001; Figures 1-3). The shape of the H-band continuum is determined by differing sources of opacity production that depend on an object’s surface gravity (Rice et al. 2011, Barman et al. 2011, Marley et al. 2012). For higher gravities, the H-band shape is dominated by collision-induced absorption (CIA) opacity or cloud opacity, which results in a rounded appearance. For a low surface gravity object, cloud opacity and CIA become less significant, and the H-band shape is governed by molecular bands around 1.7 m, most notably H2O, which results in a peaked triangular appearance.
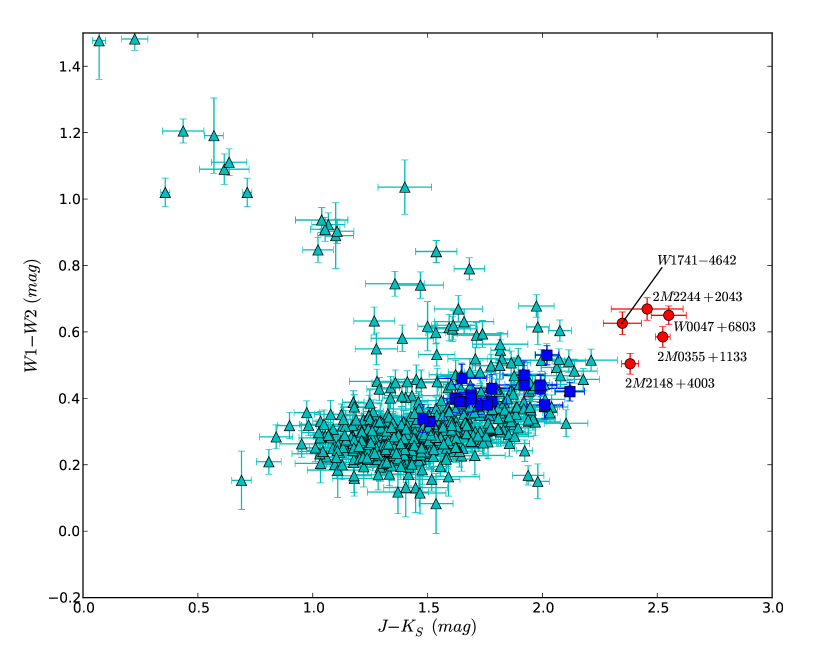
WISE 17414642 also shows a redder color ( = 2.350.08 mag) and color ( = 0.630.03 mag) compared to objects of similar spectral type (Figures 2 and 5). Faherty et al. (2013) demonstrate that the and colors of low surface gravity dwarfs deviate from the mean population. The triangular H-band shape and red and colors of WISE 17414642 are features typical of young dwarfs and are often caused by a low surface gravity. Kirkpatrick et al. (2008) show that gravity-sensitive spectral features are only evident in objects with Pleiades ages or younger. Therefore, the ability to distinguish low-gravity spectral features implies an age 100 Myr. Following the example of Cruz et al. (2009), we take 10 Myr as a lower age limit because WISE 17414642 is isolated from young, dense, star forming regions. This age is also an approximate lower limit for the ages of young nearby moving groups.
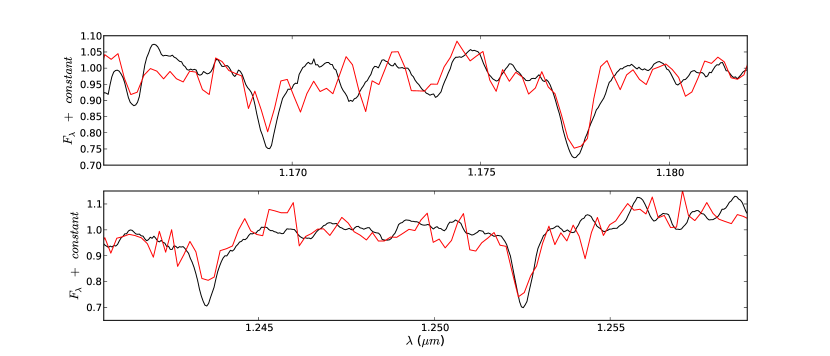
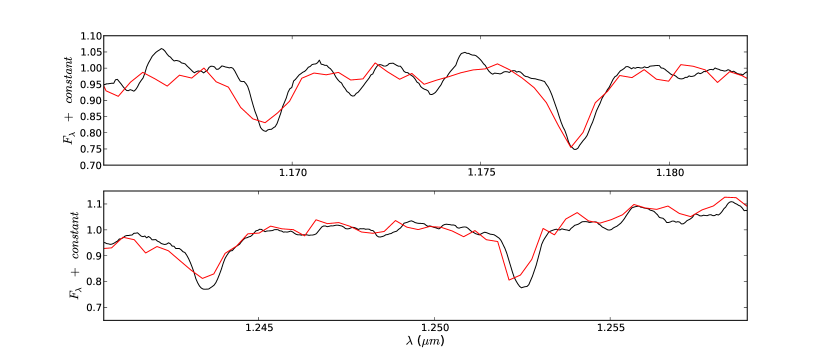
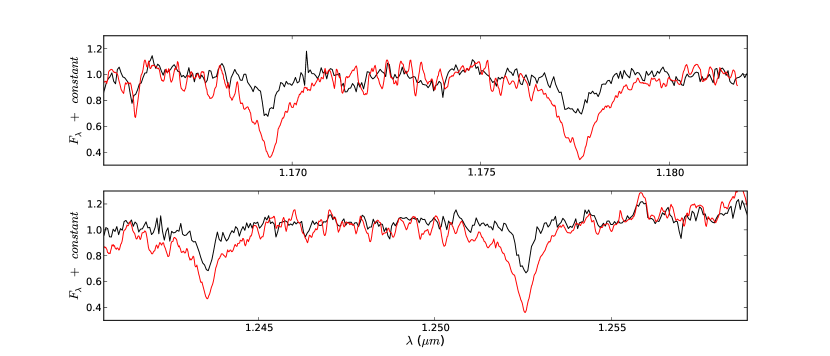
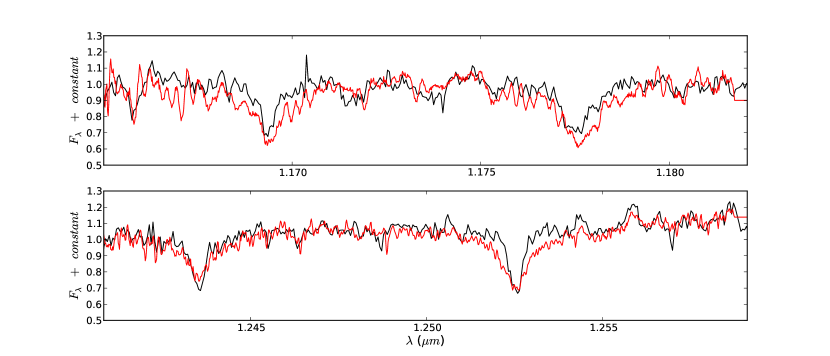
Allers & Liu (2013) define several gravity sensitive spectral indices that take advantage of gravity sensitive of FeH bands (centered on the 0.99 and 1.20 m bandheads), VO absorption (centered on the 1.06 m bandhead), the K I line at 1.14 m, and the H-band continuum shape. We note here that the alkali and molecular band indices are most useful for spectral types between M9 and L5, and are degenerate for our predicted spectral type of L7. We can, however, determine the -cont index, which is designed to quantify the H-band continuum shape. We calculated an -cont value of 0.955 for our SpeX spectrum, which follows the low gravity sequence, well separated from the location of normal field dwarfs (see Figure 24 of Allers & Liu 2013). For the similarly red L7.5 (pec) dwarf W00476803, we calculate an -cont value of 0.963. We can also utilize the K I pseudo-equivalent width (EW) definitions of Allers & Liu (2013) using our moderate-resolution FIRE spectrum. Alkali lines are known to be gravity sensitive, and can appear narrower than those seen in normal field dwarfs because of the lack of pressure broadened wings (Kirkpatrick et al., 2006). We first smoothed our FIRE spectrum with a gaussian kernel to a resolution (R 1500) similar to those inspected in Allers & Liu (2013). We measured pseudo-EW values for the 1.169, 1.177, and 1.252 m K I lines of 0.93, 1.89, and 0.86 Å, respectively. We similarly measure the pseudo-EWs of W00476803 (3.31, 2.62, and 1.16 Å) and W03551133 (2.58, 2.59, and 0.98 Å). All three measured pseudo-EWs are consistent with a low-gravity object (see Figure 23 and Table 10 of Allers & Liu 2013). Figures 6 and 7 display the K I spectral line regions of WISE 17414642 compared with the red L dwarfs W00476803 and W03551133. The FIRE spectrum has been smoothed in both figures to a resolution comparable to each comparison spectrum. Figures 6 and 7 show WISE 17414642 has comparable K I lines strengths to both W00476803 and W03551133. We also compared the K I lines with field brown dwarfs from the NIRSPEC Brown Dwarf Spectroscopic Survey (BDSS) (McLean et al., 2007). A comparison with the L5 field dwarf 2M150716 and the L7 field dwarf DENIS 020511 are shown in Figures 8 and 9. Each figure shows that the K I lines of WISE 17414642 are weaker and/or narrower than those lines seen in field dwarfs of a similar spectral type. We note that K I line strengths are also sensitive to temperature differences, which may contribute to the dissimilarity of the spectra.
Canty et al. (2013) show that the K-band continuum shape can easily distinguish young ( 10 Myr) brown dwarfs from an older field population, and can be used with confidence even with low resolution spectra. We note that the sample used in Canty et al. (2013) has a dearth of objects with intermediate ages (10 Myr and less than the age of field dwarfs) and the effectiveness of the index in this age range is not well constrained. They define an index to quantify the K-band continuum slope, given as
| (3) |
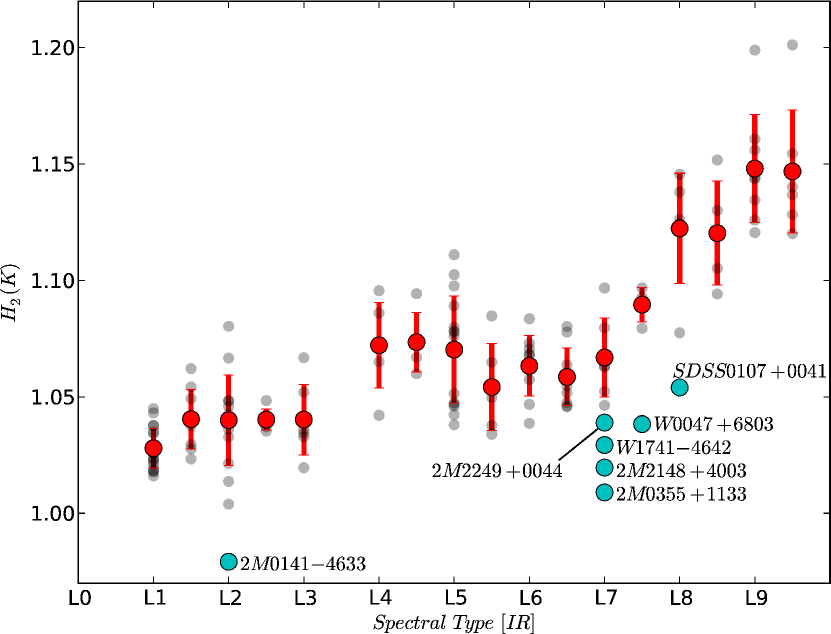
where and are the median fluxes over a total range of 0.02 m centered at 2.17 and 2.24 m, respectively. We calculated the index of WISE 17414642 and found a value of 1.029. However, we note that the analysis of K-band continuum shape by Canty et al. (2013) for young brown dwarfs was performed for spectral types L0. To extend the work of Canty et al. (2013) into the L dwarf regime, we gathered all available spectra from the Spex Prism Spectral Library for which a resolving power 120 is available. Since many of the given or published spectral types were not determined homogeneously, we independently derived near-infrared spectral types for each available spectrum based on the Kirkpatrick et al. (2010) L dwarf classification scheme (See Appendix A). The index of each L dwarf was calculated, and is shown in Figure 10 and given in Table 2. Any spectrum found to be especially noisy was not included in this analysis. While a spectral type dependance is seen past L0 (the index generally increases with increasing spectral type), WISE 1741-44642 and the red L dwarfs 2M03551133 and 2M00476803 are seen to deviate from the field population. Also showing strong deviations below their near-infrared spectral types are the young, red L6 dwarf 2MASS J214816.28400359.3 (Looper et al., 2008b), the young, red L2 dwarf 2MASS J014158.23-463357.4 (Kirkpatrick et al., 2006), the low gravity L dwarf 2MASS J224953.45+004404.6 (SpTopt = L4; Faherty et al. 2013), and the red L8 dwarf SDSSp J010752.33004156.1 (Geballe et al., 2002).
In summary, WISE 17414642 shows several traits, such as a peaked H-band continuum shape, red near-infrared colors, and a low index, that are characteristic of a young age.
3.4.3 Model Age and Mass
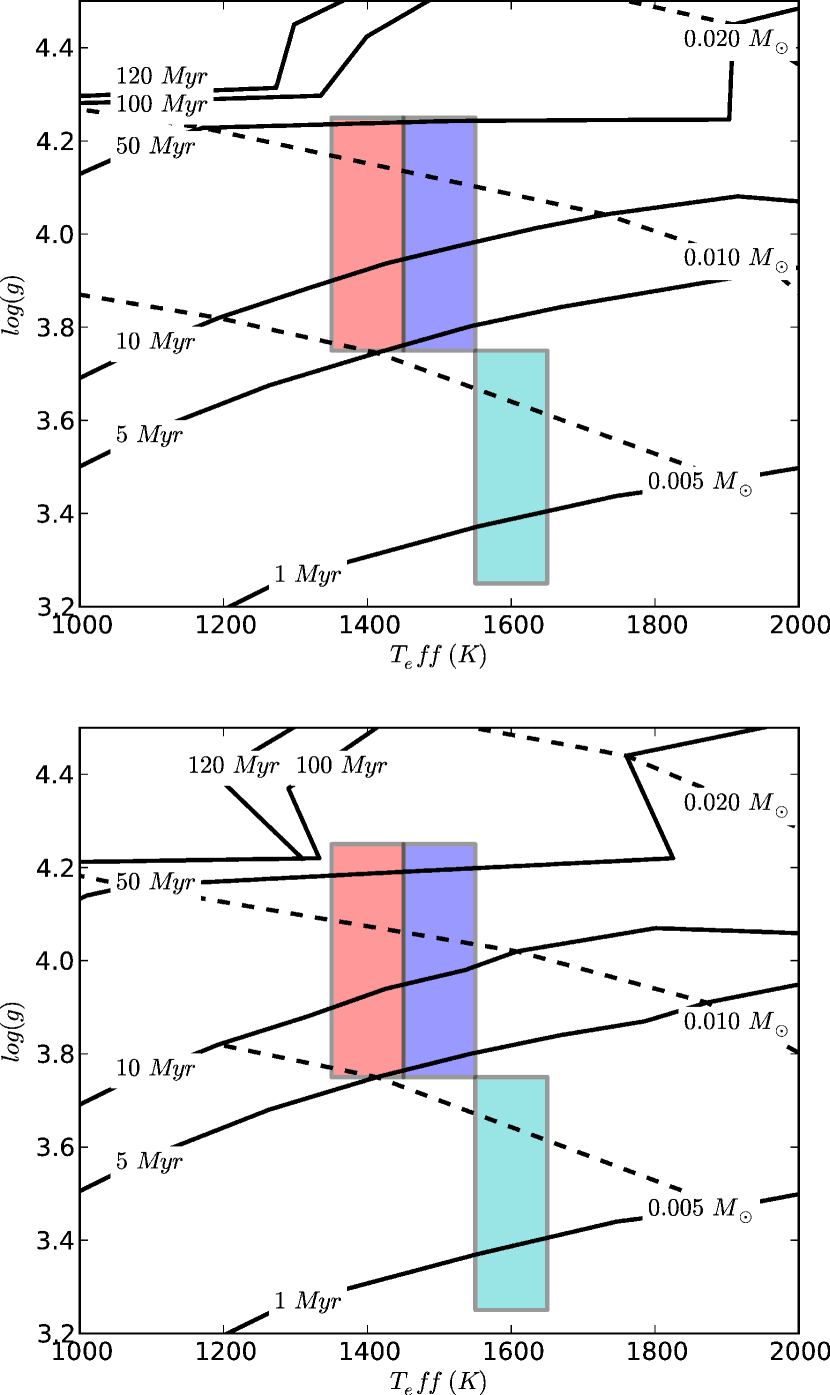
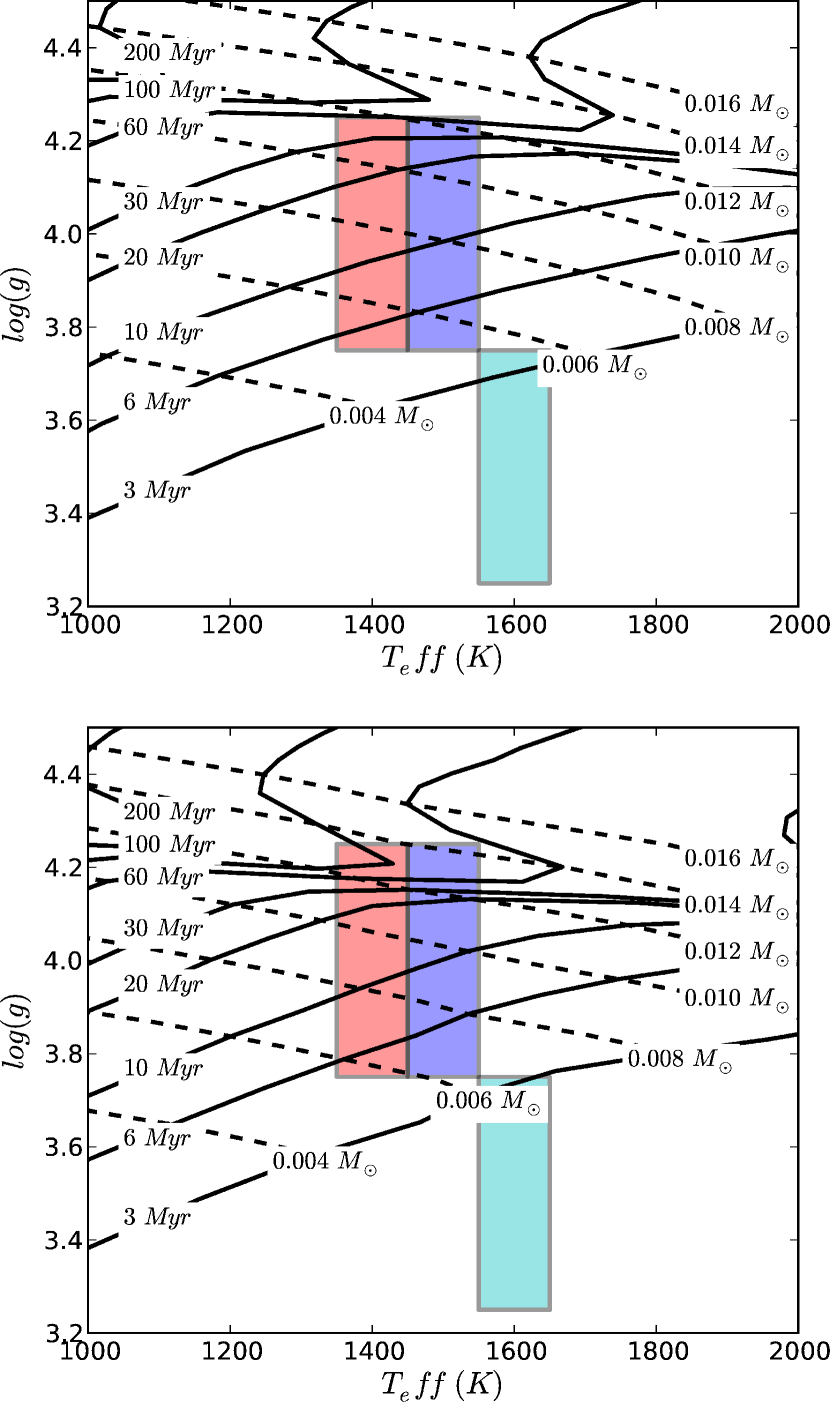
We compared the position of WISE 17414642 in vs. log space with the “COND” (Baraffe et al., 2003), “DUSTY” (Chabrier et al., 2000), and Saumon & Marley (2008) cloudy and cloudless low-mass evolutionary models (discussed in Section 3.4.1). We note here that the spectral models of Allard et al. (2011) and the low-mass evolutionary models used in Section 3.4 are not self-consistent. However, such a comparison is the only available procedure for determining the physical characteristics of WISE 17414642. Figures 11 and 12 show that the best fitting model spectrum ( = 1600, log = 3.5) suggests an age 5 Myr, but there are no regions of ongoing star formation within 30 pc. Because this is unphysical for WISE 17414642, we use the next two best fitting models. For = 1450100 K and log = 4.00.25, the “COND” and “DUSTY” models suggest an age between 5 and 100 Myr (Figure 11). The Saumon & Marley (2008) models suggest an age of 3-100 Myr (Figure 12). Both model ages are consistent with the age implied by the near-infrared spectral characteristics of WISE 17414642, and we take 10-100 Myr as our final age estimate for WISE 17414642. We take 10 Myr as a lower age limit because WISE 17414642 is isolated from young, dense, star forming regions. Even though the best fitting model was deemed unphysical, this type of object has the potential to anchor low mass evolutionary models for young ages.
The same models and spectral model parameters are used to estimate the mass of WISE 17414642. The “COND” and “DUSTY” models suggest a mass range of 5-21 MJup, while the Saumon & Marley (2008) models suggest a mass range of 4-15 MJup (Figures 11 and 12). We take 4-21 MJup as our final mass estimate.
3.5 Kinematic Analysis of WISE 17414642
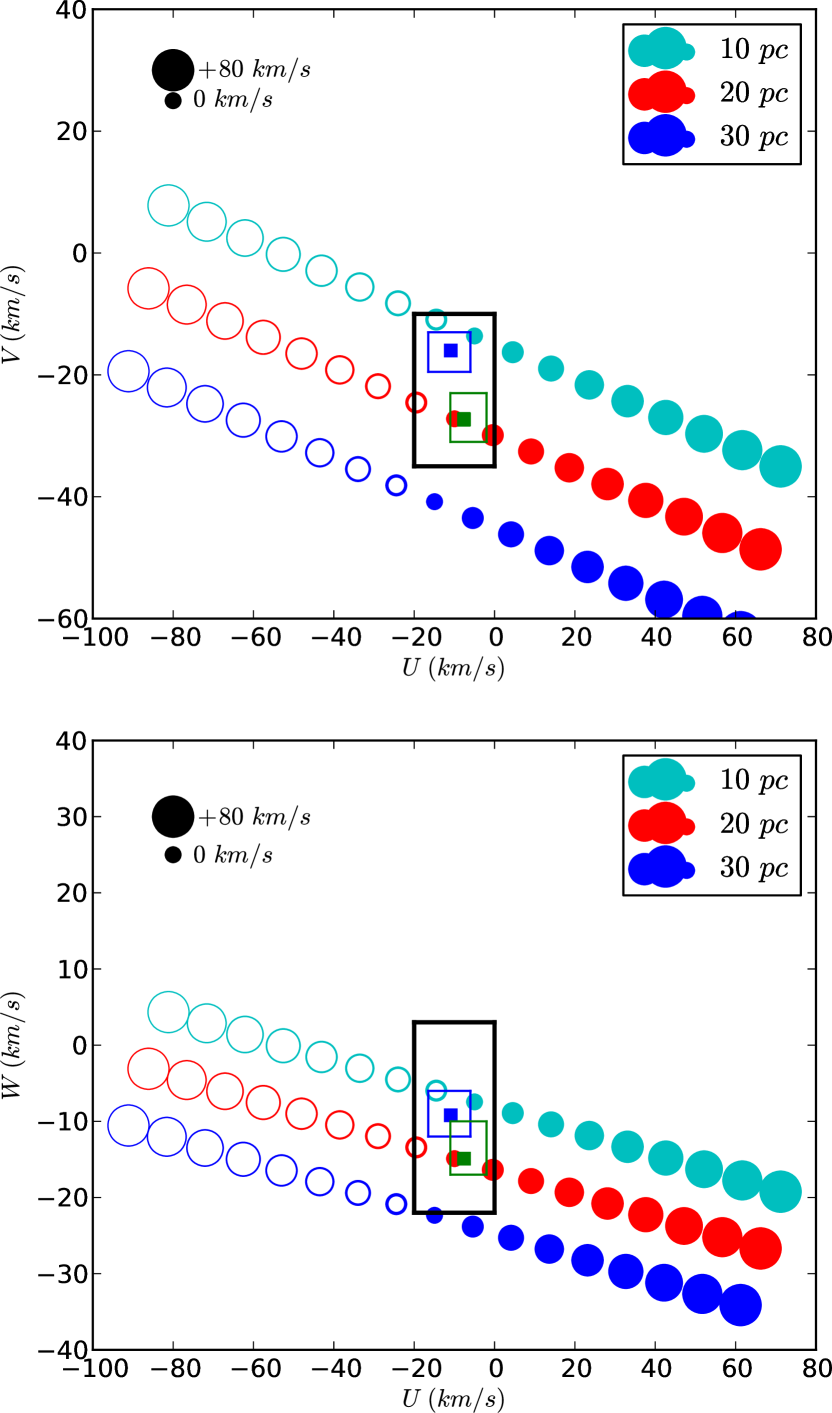
Because WISE 17414642 is located in the southern hemisphere, where many young moving groups and associations reside, we considered the possibility that it belongs to one of these. Although a full moving group membership analysis requires accurate parallax, proper motion, and radial velocity measurements, we may still explore how probable nearby moving group membership is for WISE 17414642. We calculate proper motions in right ascension and declination using the WISE All-Sky and 2MASS positions of WISE 17414642 (listed in Table 1). Using a distance estimate of 10-30 pc and the proper motions given in Table 1, we calculated UVW222UVW space motions are calculated using the measured radial velocity. are defined with respect to the Sun. U is positive toward the Galactic center, V is positive in the direction of Galactic rotation, and W is positive toward the north Galactic pole. space motions for WISE 17414642 for a range of radial velocities. Then we compared the resulting UVW space motions to the “good box” from Zuckerman & Song (2004), a region of UVW space where nearby moving group members reside. Because UVW space motions depend on an accurate distance measurement, we calculated them using 10, 20, and 30 pc as the distance to WISE 17414642. There are a range of acceptable radial velocities that would put WISE 17414642 in the UVW space which coincides with nearby young moving groups, illustrated in Figure 13. Figure 13 also shows that WISE 17414642 is much more likely to belong to a nearby young moving group if its distance is 10 or 20 pc, rather than 30 pc. As shown in Section 3.5.1, the largest photometric distance estimates come from the relations of Dupuy & Liu (2012) and Looper et al. (2008a) and the J-band magnitude of WISE 17414642, which may be underluminous.
In addition, we also took advantage of the convergent point analysis and the Bayesian young nearby association membership probability tools developed by Rodriguez et al. (2013) and Malo et al. (2013), respectively. As both authors state clearly, high probabilities do not guarantee young association membership. However, these tools can aid in illustrating the likelihood of nearby moving group membership for WISE 17414642.
The convergent point analysis tool of Rodriguez et al. (2013) uses the position and proper motion of an astronomical body to calculate parallel and perpendicular proper motion components relative to the convergent point of several nearby young associations. WISE 17414642 membership probabilities for the TW Hydrae Association (TWA), the Tucana-Horologium association (Tuc-Hor), the Carina-Near moving group, and the Columba moving group are all less than 10%. Membership probabilities for the Pictoris and AB Doradus associations are 94.2 and 91.9%, respectively. Furthermore, the convergent point analysis tool returns the ideal kinematic distances and radial velocities for membership in each group. The kinematic distance is predicted to be 12.3 pc for Pictoris and 19.1 pc for AB Doradus, distances that match well with our photometric distance estimates. The predicted radial velocities are -5.4 km s-1 and 2.1 km s-1 for Pictoris and AB Doradus, respectively.
The Bayesian Analysis for Nearby Young AssociatioNs tool (or BANYAN; Malo et al. 2013) uses Bayesian inference to determine association membership probabilities, predicted radial velocities, and the most probable distances for several young nearby associations. Unlike the convergent point analysis tool of Rodriguez et al. (2013), the BANYAN tool determines membership probabilities so that they sum to 100%. Using the WISE All-sky catalog position and the proper motions provided in Table 1, the BANYAN tool determined that WISE 17414642 has a 0% probability of belonging to TWA, Tuc-Hor, Columba, and Carina. Membership probabilities for Pictoris, AB Doradus, Argus, and old field stars are 40.75%, 43.45%, 15.34%, and 0.47%, respectively (Argus is not considered by the convergent point analysis tool of Rodriguez et al. 2013). As with the convergent point analysis tool, the BANYAN tool claims a high likelihood that WISE 17414642 belongs to either Pictoris or AB Doradus (84% total). Statistical distances are in excellent agreement with those from the convergent point method as well; 13.0 pc for Pictoris and 19.5 pc for AB Doradus, again consistent with our photometric distance estimates. The predicted radial velocities from BANYAN are -4.7 km s-1 and +2.57 km s-1 for Pictoris and AB Doradus, respectively.
We estimated the radial velocity of WISE 17414642 from our FIRE spectrum using measured K I central wavelengths compared to the rest wavelengths found in Rayner et al. (2009). We measured the central wavelength for each of the four K I lines at 1.16934, 1.17761, 1.24356, and 1.252566 m and from these calculated a radial velocity, corrected for the heliocentric radial velocity, of -5.7 5.1 km s-1. While uncertainties using this method are large, a radial velocitiy significantly discrepant from those predicted for WISE 17414642 if it is a Pictoris or AB Doradus member could have ruled out potential membership. Our measured radial velocity range does not rule out Pictoris or AB Doradus membership. We also examined the XYZ position of WISE 17414642 using the WISE All-Sky position and our distance estimate of 10-30 pc. We find XYZ values of (9.5, -2.7, -1.5), (19.0, -5.3, -2.9), and (28.6, -8.0, -4.4) pc for distances of 10, 20, and 30 pc, respectively. Comparing these values to the mean XYZ positions and dispersions for Pictoris (9.2731.71, -5.9615.19, -13.598.22) pc and the AB Doradus association (-2.3720.03, 1.4818.83, -15.6216.59) pc from Malo et al. (2013), we find that the XYZ positions of WISE 17414642 are consistent with known members of the Pictoris and AB Doradus associations.
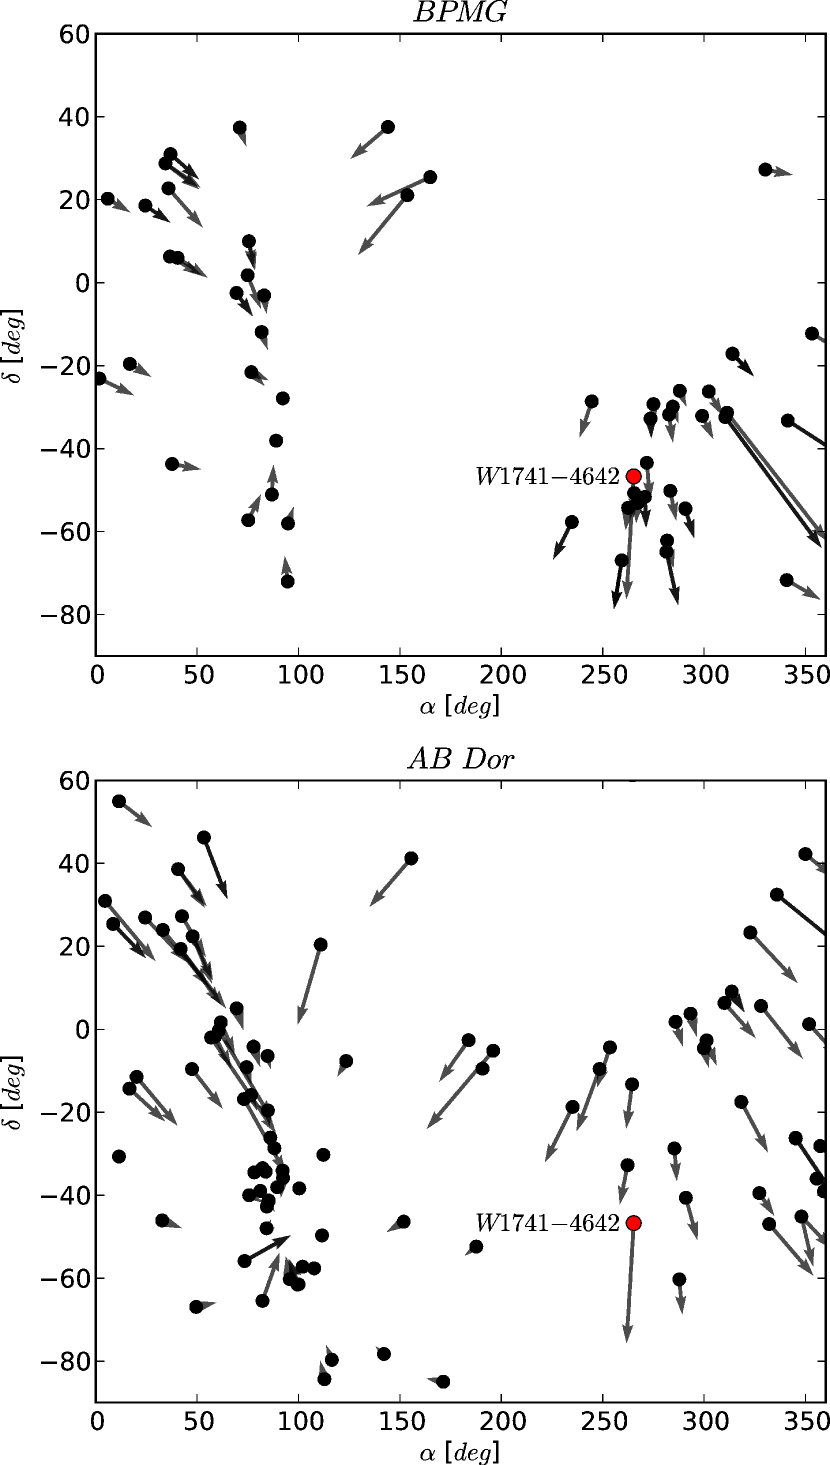
Given the youthful characteristics of the near-infrared spectrum of WISE 17414642 and the good agreement of its space motion with the Pictoris and AB Doradus associations, we believe there is a strong possibility of moving group membership. The position and proper motion of WISE 17414642 along with known members of Pictoris and AB Dordados members from Schneider (2013) is displayed in Figure 14. Accurate parallax and radial velocity measurements will aid in clearing up any young association membership ambiguity.
4 Conclusions
We have shown through an analysis of the near-infrared spectrum and photometric colors of WISE 17414642 that it shows characteristics indicative of an age of 10-100 Myr. Since WISE 17414642 is young, it is less massive than the majority of objects with similar spectral types, which typically have ages greater than 1 Gyr (assuming spectral type correlates with effective temperature). We estimated a spectral type of L72 by a comparison of the near-infrared spectrum to spectral standards and other red L dwarfs. We determined an effective temperature of 1450100 K and a log of 4.00.25 from a comparison to spectral models. From the and log estimates, we estimate the mass of WISE 17414642 to be 4-21 MJup. We also explored the possibility that WISE 17414642 is a member of one of the established nearby, young moving groups or associations. We found that membership of WISE 17414642 in the Pictoris or AB Doradus moving groups is a possibility deserving follow-up observations. Future parallax and radial velocity measurements can confirm any association membership.
References
- Allard et al. (2011) Allard F., Homeier, D., & Freytag B. 2011, in Astronomical Society of the Pacific Conference Series, Vol. 448, 16th Cambridge Workshop on Cool Stars, Stellar Systems, and the Sun, Johns-Krull C., Browning M. K., West, A. A., eds. p. 91
- Allers & Liu (2013) Allers, K. N. & Liu, M. C. 2013, ApJ, 772, 79
- Asplund et al. (2009) Asplund, M., Grevesse, N., & Sauval, A. J. 2009, ARA&A, 336, 25
- Baraffe et al. (2003) Baraffe, I., Chabrier, G., Barman, T. S., Allard, F., & Hauschildt, P. H. 2003, A&A, 402, 701
- Barman et al. (2011) Barman, T., Macintosh, B., Konopacky, Q. M., & Marois, C. 2011, ApJ, 733, 65
- Bonnefoy et al. (2013) Bonnefoy, M., Chauvin, G., Lagrange, A.-M., et al. 2013, preprint (arXiv: 1306:3709)
- Bowler et al. (2009) Bowler, B. P., Liu, M. C., & Cushing, M. 2009, ApJ, 706, 1114
- Burgasser et al. (2004) Burgasser, A. J., McElwain, M. W., Kirkpatrick, J. D., et al. 2004, AJ, 127, 2856
- Burgasser et al. (2006) Burgasser, A. J., Geballe, T. R., Leggett, S. K., Kirkpatrick, J. D., & Golimowski, D. A. 2006, ApJ, 637, 1067
- Burgasser & McElwain (2006) Burgasser, A. J., & McElwain, M. W., 2006, AJ, 131, 1007
- Burgasser et al. (2007a) Burgasser, A. J., Looper, D. L., Kirkpatrick, J. D., & Liu, M. C. 2007a, ApJ, 658, 557
- Burgasser (2007b) Burgasser, A. J. 2007b, ApJ, 659, 655
- Burgasser (2007c) Burgasser, A. J. 2007c, AJ, 134, 1330
- Burgasser et al. (2008a) Burgasser, A. J., Looper, D. L., Kirkpatrick, J. D., Cruz, K. L., & Swift, B. J. 2008a, ApJ, 674, 451
- Burgasser et al. (2008b) Burgasser, A. J., Liu, M. C., Ireland, M. J., Cruz, K. L., & Dupuy, T. J. 2008b, ApJ, 681, 579
- Burgasser et al. (2009) Burgasser, A. J., Dhital, S., & West, A. A. 2009, AJ, 138, 1563
- Burgasser et al. (2010) Burgasser, A. J., Cruz, K. L., Cushing, M. C., et al. 2010, ApJ, 710, 1142
- Burgasser et al. (2011) Burgasser, A. J., Bardalez-Gagliuffi, D. C., & Gizis, J. E. 2011, AJ, 141, 70
- Canty et al. (2013) Canty, J., Lucas, P., Roche, P., & Pinfield, D., preprint (arXiv: 1308:1296)
- Chabrier et al. (2000) Chabrier, G., Baraffe, I., Allard, F., & Hauschildt, P. 2000, ApJ, 542, 464
- Chiu et al. (2006) Chiu, K., Fan, X., Leggett, S. K., et al. 2006, AJ, 131, 2722
- Cruz et al. (2004) Cruz, K. L., Burgasser, A. J., Reid, I. N., & Liebert, J. 2004, ApJ, 604, L61
- Cruz et al. (2007) Cruz, K. L., Reid, I. N., Kirkpatrick, J. D., et al. 2007, AJ, 133, 439
- Cruz et al. (2009) Cruz, K. L., Kirkpatrick, J. D., & Burgasser, A. J. 2009, AJ, 137, 3345
- Cushing et al. (2004) Cushing, M. C., Vacca, W. D., & Rayner, J. T. 2004, PASP, 116, 362
- Cushing et al. (2005) Cushing, M. C., Rayner, J. T., &Vacca, W. D. 2005, ApJ, 632, 1115
- Cushing et al. (2008) Cushing, M. C., Marley, M. S., Saumon, D., et al. 2008, ApJ, 678, 1372
- Cushing et al. (2010) Cushing, M. C., Saumon, D., & Marley, M. S. 2010, AJ, 148, 1428
- Cutri et al. (2003) Cutri, R. M., Skrutskie, M. F., van Dyk, S., et al. 2003, VizieR Online Data Catalog, 2246, 0
- Cutri et al. (2012) Cutri, R. M., et al. 2012, VizieR Online Data Catalog, 2311, 0
- Dahn et al. (2002) Dahn, C. C., Harris, H. C., Vrba, F. J., et al. 2002, AJ, 124, 1170
- Dhital et al. (2011) Dhital, S., Burgasser, A. J., Looper, D. L., & Stassun, K. G. 2011, AJ, 141, 7
- Dupuy & Liu (2012) Dupuy, T. J. & Liu, M. C. 2012, ApJS, 201, 19
- Faherty et al. (2009) Faherty, J. K., Burgasser, A. J., Cruz, K. L., et al. 2009, AJ, 137, 1
- Faherty et al. (2012) Faherty, J. K., Burgasser, A. J., Walter, F. M., et al. 2012, ApJ, 752, 56
- Faherty et al. (2013) Faherty, J. K., Rice, E., Cruz, K. L., et al. 2013, AJ, 145, 2
- Geballe et al. (2002) Geballe, T. R., Knapp, G. R., Leggett, S. K., et al. 2002, ApJ, 564, 466
- Gelino & Burgasser (2010) Gelino, C. R., & Burgasser A. J. 2010, AJ, 140, 110
- Gizis et al. (2012) Gizis, J. E., Faherty, J. K., Liu, M., et al. 2012, AJ, 144, 94
- Golimowski et al. (2004) Golimowski, D. A., Leggett, S. K., Marley, M. S., et al. 2004, AJ, 127, 3516
- Horne (1986) Horne, K. 1986, PASP, 98, 609
- Kirkpatrick et al. (2006) Kirkpatrick, J. D., Barman, T. S., Burgasser, A. J., et al. 2006, ApJ, 639, 1120
- Kirkpatrick et al. (2008) Kirkpatrick, J. D., Cruz, K. L., Barman, T., et al. 2008, ApJ, 689, 1295
- Kirkpatrick et al. (2010) Kirkpatrick, J. D., Looper, D. L., Burgasser, A. J., et al. 2010, ApJS, 190, 100
- Kirkpatrick et al. (2011) Kirkpatrick, J. D., Cushing, M. C., Gelino, C. R., et al. 2011, ApJS, 197, 19
- Liu et al. (2013) Liu, M. C., Dupuy, T. J., & Allers, K. N. 2012, Astronomische Nachrichten, 334, 85
- Looper et al. (2007) Looper, D. L., Kirkpatrick, J. D., & Burgasser, A. J. 2007, AJ, 134, 1162
- Looper et al. (2008a) Looper, D. L., Burgasser, A., J., Gelino, C. R., & Kirkpatrick, J. D. 2008a, ApJ, 685, 1183
- Looper et al. (2008b) Looper, D. L., Kirkpatrick, J. D., Cutri, R. M., et al. 2008b, ApJ, 686, 528
- Lucas et al. (2001) Lucas, P. W., Roche, P. F., Allard, F., & Hauschildt, P. H. 2001, MNRAS, 326, 695
- Mace et al. (2013) Mace, G. N., Kirkpatrick, J. D., Cushing, M. C. et al., 2013, ApJS, 205, 6
- Malo et al. (2013) Malo, L., Doyon, R., Lafreniere, D., et al. 2013, ApJ, 762, 88
- Marley et al. (2012) Marley, M. S., Saumon, D., Cushing, M., et al. 2012, ApJ, 754, 135
- McElwain & Burgasser (2006) McElwain, M. W., & Burgasser A. J. 2006, AJ, 134, 1162
- McLean et al. (2003) McLean, I. S., McGovern, M. R., Burgasser, A. J., et al. 2003, AJ, 596, 561
- McLean et al. (2007) McLean, I. S., Prato, L., McGovern, M. R., et al. 2007, ApJ, 658, 1217
- Oppenheimer et al. (2013) Oppenheimer, B. R., Baranec, C., Beichman, C., et al. 2013, ApJ, 768, 24
- Rayner et al. (2003) Rayner, J. T., Toomey, D. W., Onaka, P. M., et al. 2003, PASP, 115, 362
- Rayner et al. (2009) Rayner, J. T., Cushing, M. C., & Vacca, W. D. 2009, ApJS, 185, 289
- Reid et al. (2006) Reid, I. N., Lewitus, E., Burgasser, A. J., & Cruz, K. L. 2006, ApJ, 639, 1114
- Rice et al. (2011) Rice, E. L., Faherty, J. K., Cruz, K., et al. 2011, in ASP Conf. Ser. 448, 16th Cambridge Workshop on Cool Stars, Stellar Systems, and the Sun, ed. C. Johns-Krull (San Francisco, CA; ASP), 187
- Rodriguez et al. (2013) Rodriguez, D., Zuckerman, B., Kastner, J. H., et al., preprint (arXiv: 1307:3262)
- Saumon & Marley (2008) Saumon, D. & Marley, M. S. 2008, ApJ, 689, 1327
- Schmidt et al. (2007) Schmidt, S. J., Cruz, K. L., Bongiorno, B. J., Liebert, J., & Reid, I. N. 2007, AJ, 133, 2258
- Schmidt et al. (2010) Schmidt, S. J., West, A. A., Burgasser, A. J., Bochanski, J. J., & Hawley, S. L. 2010, AJ, 139, 1045
- Schneider (2013) Schneider, A. C. 2013, Ph.D. thesis, University of Georgia
- Sheppard & Cushing (2009) Sheppard, S. S. & Cushing, M. C. 2009, AJ, 137, 304
- Siegler et al. (2007) Siegler, N., Close, L. M., Burgasser, A. J., et al. 2007, AJ, 133, 2320
- Simcoe et al. (2013) Simcoe, R. A., Burgasser A., J., Schechter, P. L., et al. 2013, PASP, 125, 270
- Thompson et al. (2013) Thompson, M., Kirkpatrick, J. D., Mace, G. N. 2013, PASP, 125, 809)
- Torres et al. (2008) Torres, C. A. O., Quast, G. R., Melo, C. H. F., & Sterzik, M. F. 2008, Handbook of Star Forming Regions, Vol. II: The Southern Sky, ASP Monograph Publications, Vol. 5, ed. B. Reipurth (San Francisco, CA: ASP), 757
- Vacca et al. (2003) Vacca, W. D., Cushing, M. C., & Rayner, J. T. 2003, PASP, 115, 389
- Wright et al. (2010) Wright, E. L., Eisenhardt, P., Mainzer, A., et al. 2010, AJ, 140, 1868
- Zuckerman & Song (2004) Zuckerman, B. & Song, I. 2004, ARA&A, 42, 685
Appendix A SpeX Near-Infrared Spectral Fitting
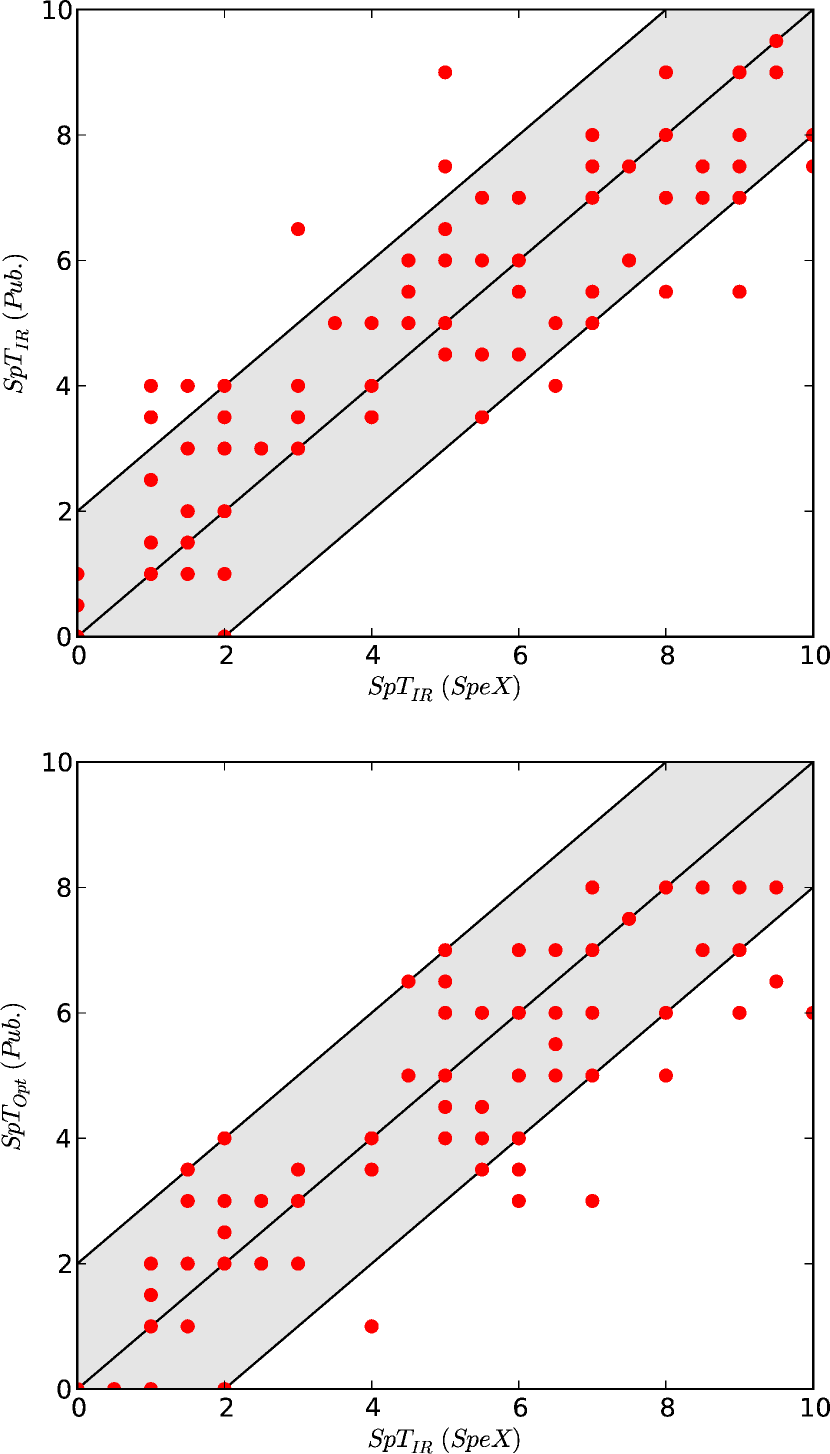
The SpeX Prism Spectral Library is an invaluable resource to the brown dwarf community. We chose to utilize this resource to extend the work of Canty et al. (2013) regarding the H2K youth index to the entire L dwarf spectral sequence. Since many of the given or published spectral types in the Spex Prism Spectral Library were not determined homogeneously, we independently derived near-infrared spectral types for each available spectrum based on the Kirkpatrick et al. (2010) L dwarf classification scheme. For each spectrum, we first normalized to 1.28 m, then performed a fitting to the region between 0.9 and 1.4 m. Each spectrum was then inspected by-eye over the entire near-infrared range from 0.8 to 2.5 m to see which subtype was most similar to the spectrum in question, with the results of the fitting used as a guide. The newly derived near-infrared spectral types are given in Table 2, along with the reference where the original near-infrared SpeX spectrum was published. We also include previously derived optical and near infrared spectral types, when available. Those spectra with blue or red near-infrared colors compared to their best fitting spectral type are labeled as blue or red in the notes section of Table 2. The newly derived infrared spectral types of the sample agree to within 2 subtypes at a rate of 89% (101/114) with previously published infrared spectral types and 93% (103/111) with optical spectral types. A comparison of the newly derived spectral types with previously published spectral types is shown in Figure 15.
| Parameter | Value | Ref. |
|---|---|---|
| Observed Properties | ||
| (J2000) | 17:41:02.79 | 1 |
| (J2000) | 46:42:25.55 | 1 |
| αcos (mas yr-1) | 20.49.2 | 3 |
| δ (mas yr-1) | 343.013.7 | 3 |
| -5.7 5.1 km s-1 | 3 | |
| J (mag) | 15.7860.075 | 1 |
| H (mag) | 14.5340.054 | 1 |
| KS (mag) | 13.4380.035 | 1 |
| W1(mag) | 12.3010.025 | 2 |
| W2 (mag) | 11.6750.023 | 2 |
| W3 (mag) | 11.4320.190 | 2 |
| W4 (mag) | 12.301 | 2 |
| (mag) | 1.250.09 | 1 |
| (mag) | 2.350.08 | 1 |
| (mag) | 4.110.08 | 1,2 |
| (mag) | 0.630.03 | 2 |
| Inferred Properties | ||
| Spectroscopic Distance | 8-11 pc | 3 |
| Photometric Distance | 10-30 pc | 3 |
| Spectral Type (NIR) | L72 (pec) | 3 |
| 1450100 K | 3 | |
| log | 4.00.25 (cm s-2) | 3 |
| Mass | 4-21 MJup | 3 |
| Age | 10-100 Myr | 3 |
| 2MASS Name | SpTopt(Pub.) | SpTNIR(Pub.) | SpTIR(Adopted) | Ref. | note | |
|---|---|---|---|---|---|---|
| 2M00044044 | L5 | L4.5 | L5 | 1.051 | 1 | |
| 2M00152959 | L7 | L7.5 (pec) | L8.5 | - | 2 | |
| 2M00164056 | L3.5 | - | L5.5 | 1.034 | 3 | |
| 2M00301450 | L7 | - | L6.5 | 1.052 | 3 | |
| 2M00321410 | - | L8 | L9 | 1.199 | 3 | |
| 2M00361821 | L3.5 | L4 | L1.5 | 1.062 | 4 | |
| 2M00362413 | - | L5.5 | L6 | - | 5 | |
| 2M00511544 | L3.5 | - | L6 | 1.047 | 3 | |
| 2M00533631 | L3.5 | - | L4 | 1.072 | 3 | |
| 2M01031935 | L6 | L7 | L7 | 1.063 | 6 | |
| 2M01070041 | L8 | L5.5 | L8 | - | 3 | red |
| 2M01304445 | - | L6 | L7.5 | - | 7 | |
| 2M01340508 | - | L1 | L1 | 1.022 | 2 | |
| 2M01411601 | - | L7: | L5.5 | - | 2 | |
| 2M01414633 | L0 | L0 (pec) | L2 | - | 22 | red |
| 2M01440716 | L5 | - | L6.5 | 1.046 | 4 | |
| 2M01474731 | - | L1.5 | L1 | 1.024 | 2 | |
| 2M02051251 | L5 | - | L6.5 | 1.046 | 8 | |
| 2M02050795 | - | L2 | L2 | 1.004 | 2 | |
| 2M02051159 | L7 | L5.5 | L9 | 1.121 | 3 | |
| 2M02062235 | - | L5.5 | L4.5 | - | 5 | blue |
| 2M02071355 | L3 | L3 | L1.5 | - | ? | |
| 2M02082542 | L1 | - | L1.5 | 1.054 | 4 | |
| 2M02082737 | L5 | - | L6 | 1.063 | 3 | |
| 2M02271624 | L1 | - | L1.5 | 1.023 | 4 | sl. red |
| 2M02282537 | L0: | L0 | L0 | - | 4 | |
| 2M02303027 | - | L1 | L1 | 1.026 | 2 | |
| 2M02352331 | L1 | L1 | L1.5 | 1.038 | 4 | |
| 2M02411241 | L2: | - | L2.5 | 1.035 | 4 | |
| 2M02554700 | L8 | L9 | L9 | 1.144 | 9 | |
| 2M02573105 | L8 | - | L8.5 | 1.094 | 10 | |
| 2M03002130 | - | L6 (pec) | L4.5 | - | 2 | |
| 2M03101648 | L8 | L9 | L9.5 | 1.140 | 1 | sl. red |
| 2M03183421 | L7 | - | L7 | 1.063 | 3 | |
| 2M03200446 | M8 | L0.5 | L0 | - | 4 | sl. blue |
| 2M03282302 | L8 | L9.5 | L9.5 | 1.155 | 4 | |
| 2M03542540 | L0 | L1 | L0 | - | 23 | |
| 2M04063812 | L0 | L1 (pec) | L2 | - | 2 | red? |
| 2M04392353 | L5: | - | L4.5 | 1.067 | 1 | |
| 2M05163332 | L3: | - | L6 | - | 3 | |
| 2M05390059 | L5 | L5 | L5 | 1.089 | ? | blue |
| 2M06244521 | L5: | - | L6.5 | 1.055 | 10 | |
| 2M06524710 | L4.5 | - | L5.5 | 1.038 | 3 | |
| 2M06546528 | - | L6 | L5.5 | - | 3 | |
| 2M07175705 | L3 | L6.5 | L3 | 1.036 | 3 | red |
| 2M07410531 | - | L1.5 | L1 | 1.023 | 2 | |
| 2M08014628 | L6.5 | - | L5 | 1.038 | 3 | |
| 2M08054812 | L4 | L9 | L5 | 1.098 | 11 | blue |
| 2M08201037 | - | L9.5 | L9.5 | - | 5 | |
| 2M08204500 | L5 | - | L7 | 1.052 | 3 | |
| 2M08232428 | L3 | - | L2 | 1.033 | 3 | sl. red |
| 2M08252115 | L7.5 | L6 | L7.5 | 1.079 | 3 | |
| 2M08281309 | L2 | - | L1 | 1.029 | 12 | |
| 2M08304828 | L8 | L9 | L9.5 | 1.120 | 4 | |
| 2M08351953 | - | L5 | L5 | 1.080 | 5 | |
| 2M08350819 | L5 | - | L6.5 | 1.048 | 3 | |
| 2M08471532 | L2 | - | L1.5 | 1.049 | 13 | |
| 2M08501057 | L6 | - | L6.5 | 1.059 | 14 | |
| 2M08511817 | - | L4.5 | L6 | - | 5 | |
| 2M08524720 | - | L9.5 | L9.5 | 1.128 | 3 | |
| 2M08562235 | L3: | - | L3 | 1.033 | 3 | |
| 2M08575708 | L8 | L8 | L7 | 1.097 | 3 | red |
| 2M08591949 | L6:: | - | L8 | 1.146 | 10 | |
| 2M09055623 | L5 | - | L5 | 1.070 | 3 | |
| 2M09085032 | L5 | L9 | L8 | 1.124 | 10 | blue |
| 2M09150422 | L7 | - | L6 | 1.068 | 1 | |
| 2M09212104 | L1.5 | L4 | L1 | 1.043 | 12 | blue |
| 2M09293429 | L8 | L7.5 | L7 | 1.080 | 3 | |
| 2M10071930 | - | L8 | L9 | 1.144 | 3 | |
| 2M10100406 | L6 | L6 | L6 | 1.071 | 8 | |
| 2M10253212 | - | L7.5 | L9 | - | 5 | |
| 2M10224114 | L0 | L (early) | L0.5 | - | 4 | |
| 2M10363441 | L6 | - | L9 | 1.126 | 3 | |
| 2M10431213 | - | L7 | L9 | 1.156 | 3 | |
| 2M10432225 | L8 | - | L8.5 | 1.152 | 10 | sl. red |
| 2M10440429 | - | L7 | L8.5 | 1.130 | 3 | |
| 2M10464441 | - | L5 (pec) | L4 | 1.096 | 2 | |
| 2M10480111 | L1 | L4 | L1 | 1.021 | 4 | |
| 2M10581548 | L3 | L3 | L2.5 | 1.037 | 3 | |
| 2M11004957 | L3.5 | - | L3 | 1.052 | 10 | sl. red |
| 2M11041959 | L4 | - | L4 | 1.086 | 15 | |
| 2M11123548 | L4.5 | - | L5 | 1.042 | 3 | |
| 2M11133430 | - | L3 | L3 | - | 5 | |
| 2M11214332 | - | L7.5 | L5 | - | 5 | blue |
| 2M11265003 | L4.5 | L6.5 (pec) | L5 | 1.102 | 16 | blue |
| 2M11462230 | L3 | - | L2.5 | 1.041 | 3 | |
| 2M11550559 | - | L7.5 | L5 | 1.078 | 3 | |
| 2M12073151 | L3: | - | L2 | 1.036 | 3 | red |
| 2M12163003 | - | L3.5 | L4 | - | 5 | |
| 2M12193128 | - | L8 | L9 | 1.161 | 3 | sl. red |
| 2M12210257 | L0 | - | L0.5 | - | 4 | |
| 2M12281547 | L5 | L6 | L4.5 | 1.073 | 3 | |
| 2M12302827 | - | L4: | L2 | 1.043 | 17 | |
| 2M12395515 | L5 | - | L5 | 1.048 | 3 | |
| 2M12471117 | - | L0: | L0 | - | 2 | |
| 2M13025650 | L2 | L3 (pec) | L3 | - | 2 | |
| 2M13052541 | L2 | L2 | L2 | 1.021 | 12 | |
| 2M13181736 | - | L5.5 | L6 | 1.039 | 2 | |
| 2M13260038 | L8: | L5.5 | L7 | 1.046 | 3 | |
| 2M13313407 | L0 | L1 (pec) | L1 | 1.019 | 2 | sl. red |
| 2M13310116 | L6 | L8 | T0 | - | 3 | |
| 2M13421340 | - | L5.5 | L6 | - | 5 | |
| 2M13455216 | - | L3.5 | L3 | - | 5 | |
| 2M13571428 | L4: | - | L2 | 1.014 | 3 | |
| 2M14004338 | - | L7 | L8 | 1.138 | 3 | |
| 2M14071241 | L1:: | - | L4 | 1.042 | 3 | |
| 2M14161348 | L6 | - | L5 | 1.111 | 18 | blue |
| 2M14165006 | - | L5.5 | L4.5 | - | 5 | |
| 2M14183538 | - | L1.5 | L1.5 | 1.030 | 2 | |
| 2M14195919 | - | L1: | L1 | - | 2 | |
| 2M14222215 | - | L6.5 | L5 | - | 5 | blue |
| 2M14311436 | L2 | L3.5 | L1 | 1.018 | 17 | blue |
| 2M14342202 | - | L2.5 | L1 | 1.045 | 17 | blue |
| 2M14391929 | L1 | - | L1 | 1.016 | 15 | |
| 2M14401303 | L1 | L1 (pec) | L1 | 1.038 | 2 | |
| 2M14481031 | L4: | L3.5 | L5.5 | 1.065 | 3 | |
| 2M15061321 | L3 | L3 | L3 | 1.020 | 9 | |
| 2M15154436 | - | L7.5 | L7.5 | 1.093 | 3 | |
| 2M15233014 | L8 | L8 | L8 | 1.126 | 3 | |
| 2M15262043 | L7 | - | L5 | 1.076 | 15 | |
| 2M15341219 | - | L4 | L3 | 1.067 | 5 | |
| 2M15403742 | - | L9 | L9 | 1.135 | 3 | |
| 2M15481722 | - | L5 | L4.5 | - | 5 | |
| 2M15501455 | L2: | - | L2.5 | 1.039 | 19 | |
| 2M16174019 | - | L4 | L6.5 | 1.064 | 5 | sl. red |
| 2M16221159 | - | L6 | L4.5 | - | 5 | |
| 2M16304344 | - | L7 | L8.5 | 1.105 | 3 | |
| 2M16321904 | L8 | L8 | L8 | 1.078 | 15 | |
| 2M16330640 | - | L6 | L5.5 | 1.085 | 5 | sl. blue |
| 2M16381327 | - | L2 | L1.5 | 1.039 | 2 | |
| 2M16451319 | L1.5 | - | L1 | 1.018 | 4 | |
| 2M16494643 | - | L5 | L4.5 | - | 5 | sl. blue |
| 2M16536231 | L3 | - | L1.5 | 1.028 | 3 | |
| 2M17050516 | - | L4 | L1 | 1.034 | 3 | |
| 2M17070558 | - | L3 | L2 | 1.067 | 13 | |
| 2M17112232 | L6.5 | - | L9.5 | 1.137 | 3 | |
| 2M17283948 | L7 | - | L6.5 | 1.080 | 14 | |
| 2M17315310 | - | L6 | L5 | 1.078 | 5 | |
| 2M17322656 | - | L1 | L1 | 1.026 | 2 | |
| 2M17392454 | - | L4 | L2 | 1.048 | 2 | |
| 2M17500016 | - | L5.5 | L4.5 | 1.060 | 3 | sl. blue |
| 2M18075015 | L1.5 | L1 | L1 | 1.029 | 4 | |
| 2M18135101 | - | L5 | L4.5 | 1.094 | 2 | |
| 2M18211414 | L4.5 | L5 (pec) | L5 | 1.047 | 20 | |
| 2M19163700 | - | L1 | L1 | - | 2 | |
| 2M19284356 | L4 | - | L6 | 1.057 | 3 | |
| 2M19416826 | - | L2 | L2 | 1.046 | 2 | |
| 2M19496222 | L2 (pec) | L2 (pec) | L2 | - | 2 | |
| 2M20020521 | L6 | - | L5.5 | 1.050 | 4 | sl. red |
| 2M20262943 | L1: | - | L1 | - | 21 | |
| 2M20280052 | L3 | - | L2.5 | 1.048 | 15 | |
| 2M20340827 | L1 | - | L1 | 1.038 | 3 | |
| 2M20361051 | L3 | - | L2 | 1.041 | 3 | |
| 2M20431551 | - | L9 | L9.5 | 1.201 | 3 | |
| 2M20570252 | L1.5 | L1.5 | L1 | 1.028 | 15 | |
| 2M21011756 | L7.5 | - | L7.5 | 1.097 | 3 | |
| 2M21041037 | L2.5 | - | L2 | 1.038 | 3 | |
| 2M21300845 | L1.5 | - | L1 | 1.035 | 2 | |
| 2M21310119 | - | L9 | L9.5 | - | 5 | |
| 2M21321029 | - | L4.5 | L5.5 | - | 5 | |
| 2M21321341 | L6 | - | L6 | 1.068 | 10 | |
| 2M21331018 | - | L5 | L3.5 | - | 5 | |
| 2M21423101 | L3 | - | L2 | 1.048 | 3 | |
| 2M21484003 | L6 | L6 (pec) | L7 | - | 20 | red |
| 2M21513402 | - | L7 (pec) | L6 | 1.084 | 2 | |
| 2M21512441 | L3 | - | L3 | 1.034 | 4 | red |
| 2M21552345 | - | L2 | L2 | 1.080 | 2 | |
| 2M21581550 | L4: | L4 | L4 | 1.065 | 2 | |
| 2M22116856 | - | L2 | L2 | - | 2 | |
| 2M22123430 | L5: | L6 | L6 | 1.073 | 3 | |
| 2M22490044 | L3 | L5 | L7 | 1.038 | 4 | |
| 2M22521730 | - | L7.5 | T0 | - | 8 | |
| 2M23174838 | L4 (pec) | L6.5 (pec) | L5 | 1.046 | 2 | red |
| 2M23281038 | - | L3.5 | L2 | - | 5 | |
| 2M23513010 | L5.5 | L5 (pec) | L6.5 | 1.078 | 2 |
References: (1) Burgasser 2007b; (2) Kirkpatrick et al. 2010; (3) Burgasser et al. 2010; (4) Burgasser et al. 2008b; (5) Chiu et al. 2006; (6) Cruz et al. 2004; (7) Dhital et al. 2011; (8) Reid et al. 2006; (9) Burgasser 2007b; (10) Siegler et al. 2007; (11) Burgasser 2007c; (12) Burgasser et al. 2007a; (13) McElwain & Burgasser 2006; (14) Burgasser et al. 2011; (15) Burgasser et al. 2004; (16) Burgasser et al. 2008a; (17) Sheppard & Cushing 2009; (18) Schmidt et al. 2010; (19) Burgasser et al. 2009; (20) Looper et al. 2008b; (21) Gelino & Burgasser 2010; (22) Kirkpatrick et al. 2006; (23) Burgasser & McElwain 2006