Human Mobility and Predictability enriched by Social Phenomena Information
Abstract
The massive amounts of geolocation data collected from mobile phone records has sparked an ongoing effort to understand and predict the mobility patterns of human beings. In this work, we study the extent to which social phenomena are reflected in mobile phone data, focusing in particular in the cases of urban commute and major sports events. We illustrate how these events are reflected in the data, and show how information about the events can be used to improve predictability in a simple model for a mobile phone user’s location.
I Introduction
Mobile phone operators have access to an unprecedented volume of information about users’ real-world activities. The records of calls and messages exchanged between their users provides a deep insight into the interactions and activities of millions of individuals. The social graph induced by mobile communications has provided a rich field to apply social network analysis to real-world problems. For instance, we can highlight the use of community detection techniques (see [1][2][3][4]); and the more recent advances in detecting the evolution of communities in dynamic networks (taking into account the evolution of the social graph over time) in [5][6].
A key aspect of the data collected by mobile phone operators that has attracted considerable attention in recent years is the information about how people are moving in the real world. In fact, mobile phone records can be considered as the most detailed information on human mobility across a large part of the population [7]. The study of the dynamics of human mobility using the collected geolocations of users, and applying it to predict future users’ locations, has been an active field of research [8][9]. In particular, this information can be used to validate human mobility models (as the authors of [10] did with the information from a location-based social networking site); and to study the interplay between individual mobility and social networks [11].
The study of human mobility can be applied to domains as diverse as city planning and traffic engineering (e.g. to optimize the public transportation system and the roads network); public health (e.g. to allow health officials to track and predict the spread of contagious diseases); or to guide humanitarian relief after a large-scale disaster (see [9] wherein the authors study population movements after the Haiti 2010 earthquake). Using real-world data to understand human mobility is critical to such applications. On the business side of applications, mobile carriers are seeking for new revenue streams based on the anonymized and aggregated analysis of their subscribers’ mobility data [12].
In this work, we study the extent to which social phenomena are reflected in mobile phone data, focusing in particular in the cases of urban commute and major sports events. The rest of the paper is organized as follows. Section II briefly describes the real-world data source that we used for our experiments. In Section III, we present a simple model to predict the location of a mobile phone user, that we used as baseline of predictability. In Section IV, we illustrate how urban commute can be observed in the data, and compute basic metrics. We also show the mobility pattern associated with a sports event (namely a soccer match). In Section V, we show how information about social events can be used to improve the predictability of the simple model. We illustrate this idea in the case of soccer matches, and use the information of the soccer fixture to improve location predictions. Section VI concludes the paper, and discusses ideas for future work.
II Mobile Data Source

Our data source is anonymized traffic information from a mobile operator in Argentina, focusing mostly in the Buenos Aires metropolitan area, over a period of 5 months. The raw data logs contain around 50 million calls per day. Call Detail Records (CDR) are an attractive source of location information since they are collected for all active cellular users (about 40 million users in Argentina), and creating additional uses of CDR data incur little marginal cost.
For our purposes, each record is represented as a tuple , where user is the caller, user is the callee, is the date and time of the call, is the direction of the call (incoming or outgoing, with respect to the mobile operator client), and is the location of the tower that routed the communication. The temporal granularity used in this study is the hour, justified by the findings in [7][13].
From the operator’s data, it is possible to have direct information on mobile phone usage patterns, as can be seen in Figure 1, which shows the volume of communications according to the day of the week and the hour. The expected contrast between weekend and workweek is evident. More interesting information is given by the communications peaks during the morning (around 11 a.m.) and the afternoon (around 18 p.m.) from Monday through Friday, which depend on the working habits in Argentina. Most of public holidays in the period studied where on Mondays, and this fact shows perfectly well in Figure 1, if we assume during holidays people show a similar calling pattern as during weekends.
III Mobility Model
To predict a user’s position, we use a simple model based on previous most frequent locations. We compute the correct prediction probability (i.e. accuracy) as the ratio between the number of correct predictions and total predictions made. In order to compute these locations, we split the week in time slots, one for each hour, totalizing slots per week. Since humans tend to have very predictable mobility patterns [7][14][15], this simple model turns out to give a good predictability baseline, achieving an average of around correct predictions for a period of 2 weeks, training with 15 weeks of data, including peaks of over predictability. This model was used as a baseline in [16], with which our results agree. In Figure 2 we show the average predictability for all time slots (considering the week from Sunday to Saturday).

Although the kind of periodic behaviour observed in the figure is widely explained in the literature, it is important to make a few remarks about the results obtained:
-
•
It is clear that predictability is at least higher during weekdays (Monday - Friday) than during the weekend.
-
•
During the night, people have a peak of predictability, corresponding to the time they typically spend at home.
-
•
Predictability is slightly higher when computed from outgoing calls than when computed from incoming calls.
-
•
We expect correct prediction probability to improve, and its curve to be smoother, if we filter users and make predictions only among the ones with high number of communications. This analysis will be performed in the near future.
It is important to notice that it is possible to improve the accuracy of this simple model by clustering antennas as we are considering each antenna as a different location. Although this seems to be a reasonable choice, real life situations do not adjust perfectly to this schema. While a user is at her house, she might be using more than one antenna, and we are considering that she is in two different places. On the other hand, a user might use the same antenna while she is in different locations, like her workplace and the nearby restaurant where she eats lunch. Some of these problems are pathological, and can not be tackled due to the poor space resolution given by antennas (as contrasted, for example, with GPS information). However, several problems can be solved by clustering antennas, where those clusters would represent real locations for users.
IV Mobility Patterns
IV-A Urban Commute
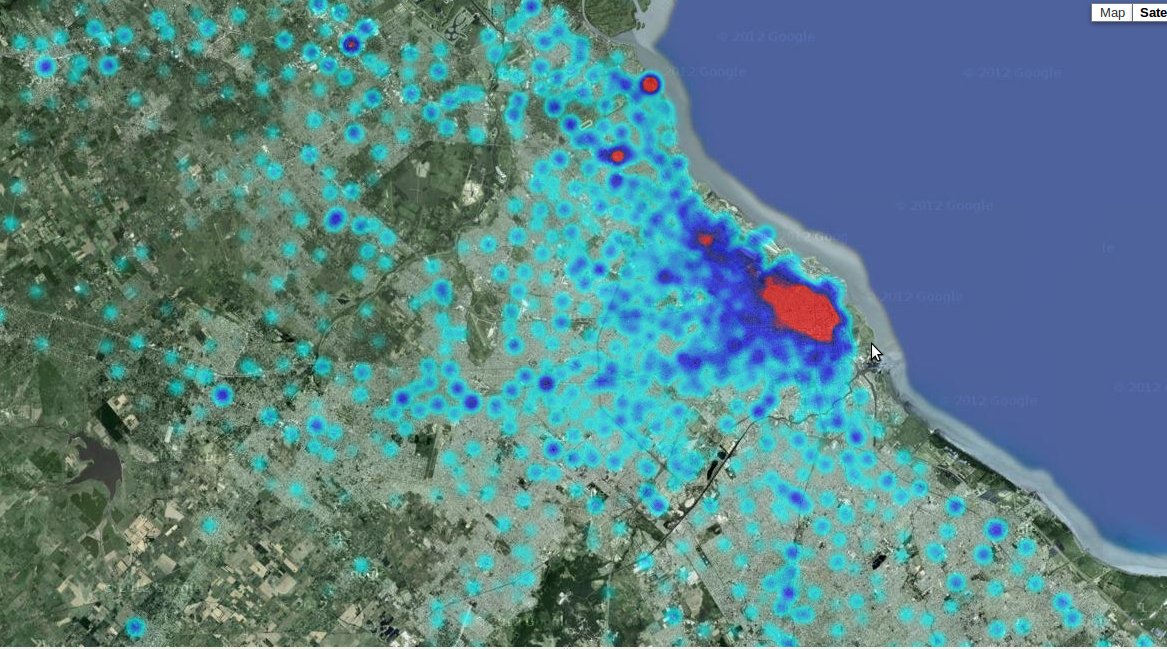
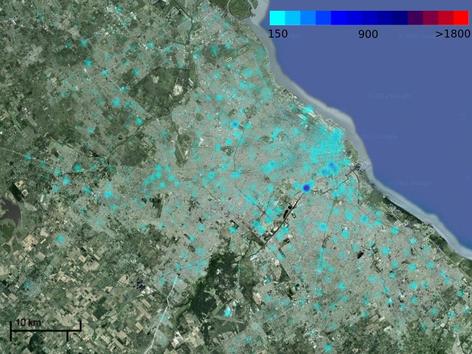
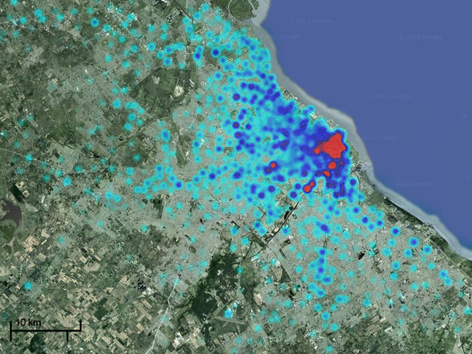
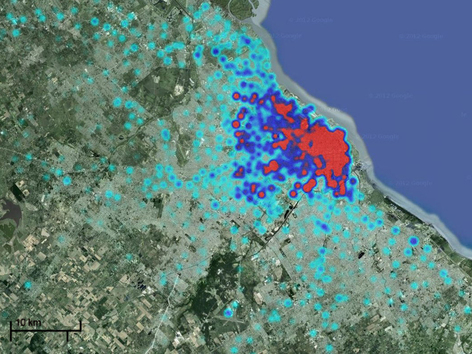
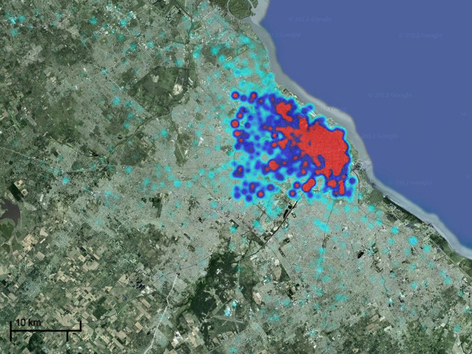
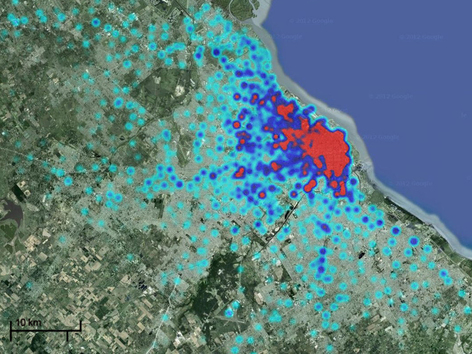
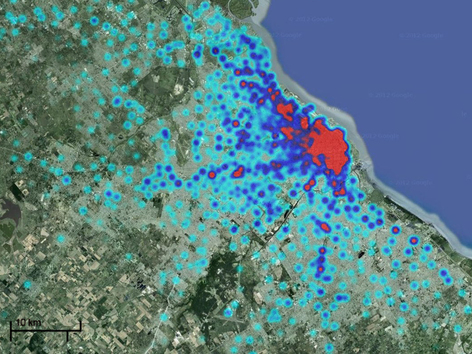
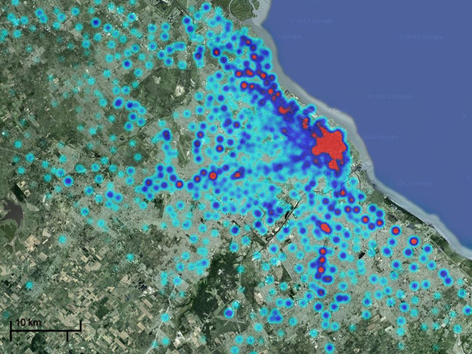
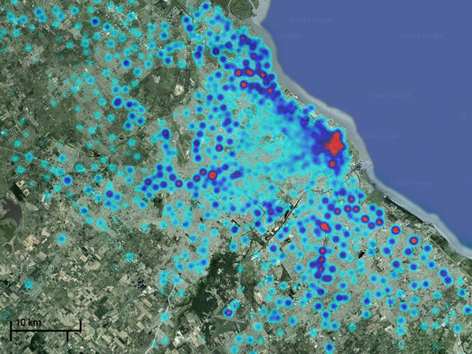
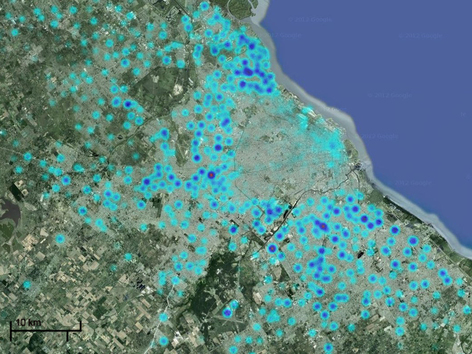
The phenomenon of commuting is prevalent in large metropolitan areas (often provoking upsetting traffic jams and incidents), and naturally appears in mobile phone data. For instance, in [17] the authors study commute distances in Los Angeles and New York areas. Mobile data can lead to quantification of this phenomenon in terms of useful quantities, which are much harder to measure directly. Figure 3 shows the call distribution for each antenna in the area of interest, averaged over a whole month. We include a series of call patterns illustrating the Buenos Aires commute in Figure 4.
(a) 6 a.m.
(b) 8 a.m.
(c) 10 a.m.
(d) 2 p.m.
(e) 5 p.m.
(f) 6 p.m.
(g) 7 p.m.
(h) 8 p.m.
(i) 10 p.m.
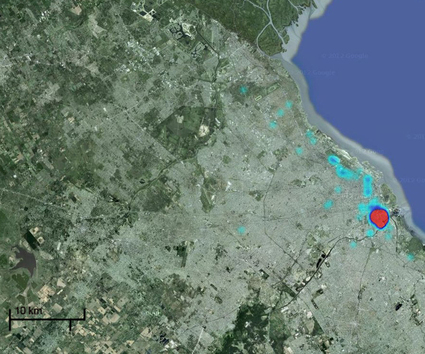
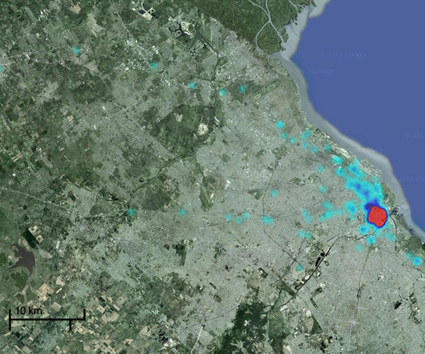
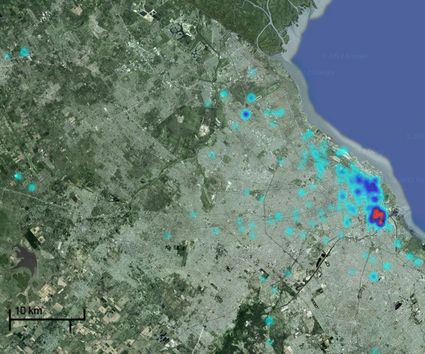
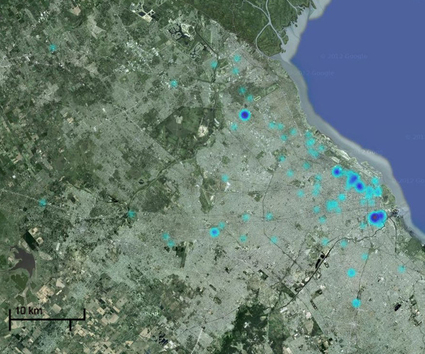
(a) 5 hours before
(b) 2 hours before
(c) 1 hour before
(d) 1 hour after
(e) 2 hours after
(f) 3 hours after
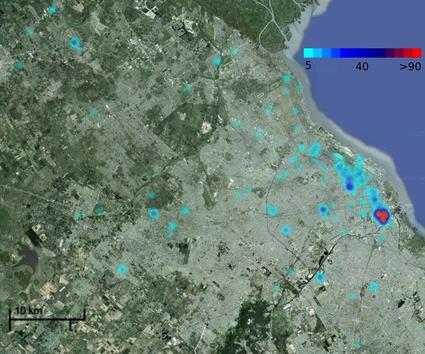
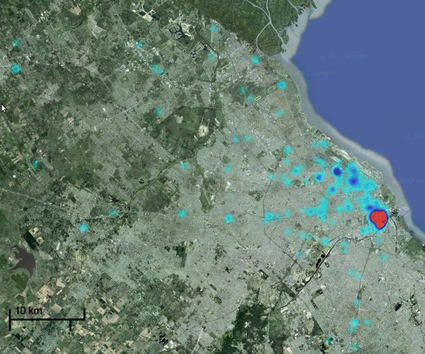
Red color corresponds to a higher number of calls, whereas blue corresponds to an intermediate number of calls and light blue to a smaller one.
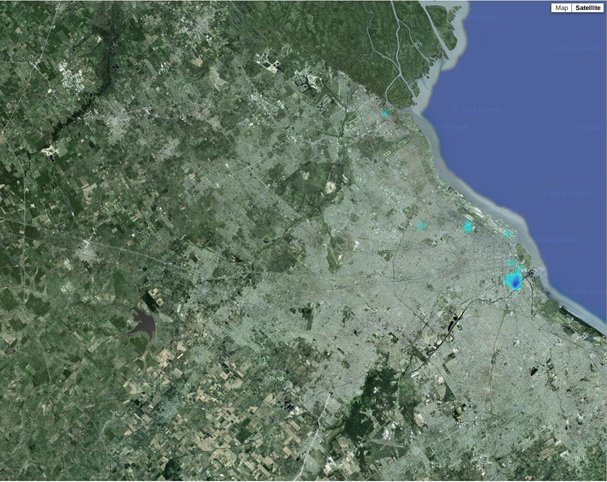
(a) 5 hours before
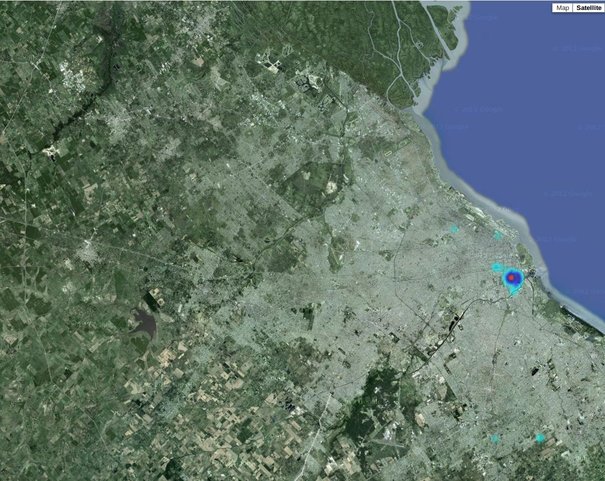
(b) 1 hour before
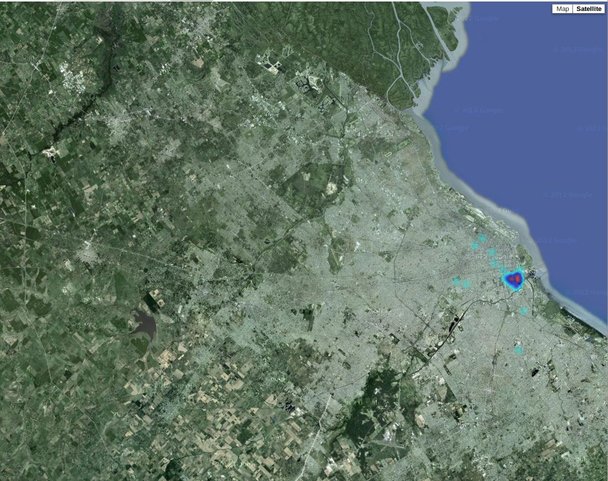
(c) 1 hour after
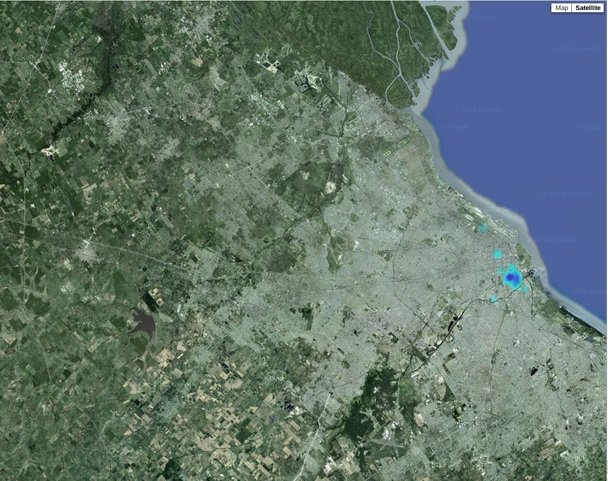
(d) 3 hours after
From the data, we can estimate the radius of the commute (ROC - the average distance travelled by commuters). To do so, we take into consideration the two most frequently used antennas as the important places for each user (home and work, see [18]). We proceed first to define a night time, where users are usually at their houses (9 p.m. - 5 a.m. during weekdays) and a day time where users are usually at their work places (12 p.m. - 4 p.m. during weekdays). Afterwards, we count how many times each user makes calls in each of those two time spans both from inside and outside Buenos Aires city.
To simplify computations, we take a square area roughly corresponding to the country capital (the autonomous city of Buenos Aires), which is separated by a political boundary from the rest of the large metropolitan area (the Greater Buenos Aires). Around 3 million people live in Buenos Aires city, whereas around 13 million people live in the Greater Buenos Aires, which is among the top 20 largest agglomerations of the world by population.
A large part of the individuals working in Buenos Aires city live in the Greater Buenos Aires, and commute every day. Surveys and estimations state that more than 3 million people commute to Buenos Aires city every day. Thereby, we define a user as a commuter if she makes most of her night time calls from outside the city and most of her day calls from inside the city. To perform the experiment, we chose a threshold , meaning that at least of a user’s night time calls must be made from outside the city and at least of day time calls must be made from inside the city in order to be considered a commuter.
After defining commuters, their home and work locations have to be found in order to compute the radius of commute. We define their home to be the antenna with the highest number of communications from outside the city during night time, and analogously define their work to be the antenna with highest number of communications inside the city during day time. We consequently consider the distance between those two main antennas as the ROC for each user.
Having made the preceding definitions and assumptions, we compute an average ROC of km (as a comparison, the diameter of the city is about 14 km, and the diameter of the considered metropolitan area is 90 km).
We also computed a random ROC assuming users’ locations were randomly distributed in the region of interest and, once more, defining as commuters users that live outside the city but work inside. The result was a randomized average ROC of km.
The previous result confirms an intuitive idea: people’s living and working places tend to be closer than what a random distribution would predict.
IV-B Sports Events
As in the urban commute case, we study human mobility in sports events as seen through mobile phone data. In Figure 5, we show how assistants to a Boca Juniors soccer match converge to the stadium in the hours prior to the game, and disperse afterwards. Average attendance to Boca Juniors home matches is 42000 people.
Note that postselecting the users attending the event necessarily produces the effect of having no calls outside the chosen area during the match. However, the convergence pattern observed is markedly different from the one seen for the same time slot of the week on a day with no match, as shown in Figure 6.
V Improving Predictability with External Data
So far, our results allow us to understand (and quantify) social events through the analysis of mobile phone data. This understanding can be in turn used to improve the mobility model. Social relations among individuals have been used to improve predictability in mobility models before, as in [16], where social links learned from the mobile phone records are used to this end. Here, instead of peer to peer links learned from the mobile data, we show how an external data source can be used to improve the model.
We illustrate this effect using as proof of concept the case study of soccer matches. By taking the soccer fixture, we tag users as “Boca Juniors fans” if they make calls using antennas around the stadium and during the time slots of Boca matches for three selected consecutive matches (which include both home and away matches), which can be considered as part of our training set for the new approach. Using this tagging, we can dramatically improve predictability for this group of Boca fans, even predicting locations that had never been visited by a user before, 1000 km away from her usual location.
In the basic model, we predicted a user’s location in a particular time slot to be her most frequent location in that particular time slot in the training set, whereas in this enriched model, we predict the stadium location (as a cluster of the antennas surrounding it) in case the user is a Boca Juniors fan and we are making predictions on a day where Boca plays a match on that stadium. To evaluate the basic model, we use 15 weeks of data for training purposes, as described in section III. For the enriched model, we use the same training data, adding the previously mentioned social information (i.e. tagging users) on three consecutive Boca matches in that period. The evaluation is made on the same testing data set in both cases, consisting on the three days where Boca plays the next matches.
The predictability of the model for these tagged users considering the fixture data rises for the days where there is a Boca Juniors match to – which doubles the accuracy achieved by our previous model for the same set. Moreover, the initial model is only able to make predictions in of events in the given set (as a consequence of a lack of information from the training set data), whereas the socially enriched model tries to predict of the events during match days, which make the previous results even more significant.
In order to understand these results, we illustrate with a few examples where the enriched model outperforms the simple model:
-
•
The simple model would rarely predict a user’s location on a different city or in an unvisited location, whereas the enriched model would do so if the user is a Boca fan, and Boca has an away match in that city.
-
•
If Boca usually plays matches on Sundays at 7 p.m. a Boca fan could have a stadium antenna as its most frequent antenna for that particular time slot. Consequently, the simple model would predict her to be in that location for any other Sunday. However, the enriched model wouldn’t do so for away matches, and can even take into account that season is over, and therefore predict the location of the following most frequent antenna.
VI Conclusion and Future Work
We illustrated how social phenomena can be studied through the lens of mobile phone data, which can be used to quantify different aspects of these phenomena with great practicality. Furthermore, we showed how including external information about these phenomena can improve the predictability of human mobility models.
Although we showed this in a specific case as a proof of concept experiment, we note that this procedure can be extended to other settings, not restricted to sports but including cultural events, vacation patterns and so on (see [9] for a specially relevant application). The tagging obtained is useful on its own and is of great value for mobile phone operators. The big challenge in this line of work is to manage to include external data sources in a systematic way.
The results obtained, as well as interesting ideas and questions related with this subject that were not addressed here, give a great perspective on future work. A simple approach to improve these metrics is to cluster antennas in order to consider clusters as locations, which is much more real than considering a single antenna as a location. The next step would be to keep working on more complex location prediction models, specially using social information, in order to improve the obtained accuracy and predictability rate.
Moreover, an important goal is to manage to include external data sources in a systematic way, trying to work with more and possibly bigger communities other than the ”Boca Juniors fans” community, and analyzing how social information modifies the predictions made by models during longer periods.
The communities idea shows a complementary way to use social information in order to improve the models’ predictions, by taking tag-based predictions to the community level. Defining, for instance, the “Boca Juniors fans” community, we can predict that if some users of this community make or receive calls in a certain location, other users in the community will do it as well.
Acknowledgments
The authors would like to thank Matias Travizano and Martin Minnoni for their ideas and suggestions, and the anonymous reviewers for their feedback.
References
- [1] Mark EJ Newman and Michelle Girvan. Finding and evaluating community structure in networks. Physical review E, 69(2):026113, 2004.
- [2] Vincent Blondel, Jean-Loup Guillaume, Renaud Lambiotte, and Etienne Lefebvre. Fast unfolding of communities in large networks. Journal of Statistical Mechanics: Theory and Experiment, 2008(10):P10008, 2008.
- [3] Santo Fortunato. Community detection in graphs. Physics Reports, 486(3):75–174, 2010.
- [4] Qinna Wang and Eric Fleury. Community detection with fuzzy community structure. In Advances in Social Networks Analysis and Mining (ASONAM), 2011 International Conference on, pages 575–580. IEEE, 2011.
- [5] Thomas Aynaud and Jean-Loup Guillaume. Static community detection algorithms for evolving networks. In WiOpt’10, pages 513–519. IEEE, 2010.
- [6] Carlos Sarraute and Gervasio Calderon. Evolution of communities with focus on stability. In Third International Conference on the Analysis of Mobile Phone Datasets (NetMob), 2013.
- [7] Chaoming Song, Zehui Qu, Nicholas Blumm, and Albert-László Barabási. Limits of predictability in human mobility. Science, 327(5968):1018–1021, 2010.
- [8] Manlio De Domenico, Antonio Lima, and Mirco Musolesi. Interdependence and predictability of human mobility and social interactions. Nokia Mobile Data Challenge Workshop, 2012.
- [9] Xin Lu, Linus Bengtsson, and Petter Holme. Predictability of population displacement after the 2010 haiti earthquake. Proceedings of the National Academy of Sciences, 109(29):11576–11581, 2012.
- [10] Tommy Nguyen and Boleslaw K Szymanski. Using location-based social networks to validate human mobility and relationships models. In Advances in Social Networks Analysis and Mining (ASONAM), 2012 IEEE/ACM International Conference on, pages 1215–1221. IEEE, 2012.
- [11] Dashun Wang, Dino Pedreschi, Chaoming Song, Fosca Giannotti, and Albert-Laszlo Barabasi. Human mobility, social ties, and link prediction. In Proceedings of the 17th ACM SIGKDD international conference on Knowledge discovery and data mining, pages 1100–1108. ACM, 2011.
- [12] Jessica Leber. How wireless carriers are monetizing your movements. MIT Technology Review, 2013.
- [13] Chaoming Song, Tal Koren, Pu Wang, and Albert-László Barabási. Modelling the scaling properties of human mobility. Nature Physics, 6(10):818–823, 2010.
- [14] Marta C Gonzalez, Cesar A Hidalgo, and Albert-Laszlo Barabasi. Understanding individual human mobility patterns. Nature, 453(7196):779–782, 2008.
- [15] Shan Jiang, Joseph Ferreira, and Marta C González. Clustering daily patterns of human activities in the city. Data Mining and Knowledge Discovery, pages 1–33, 2012.
- [16] Eunjoon Cho, Seth A Myers, and Jure Leskovec. Friendship and mobility: user movement in location-based social networks. In ACM SIGKDD, pages 1082–1090. ACM, 2011.
- [17] Sibren Isaacman, Richard Becker, Ramón Cáceres, Stephen Kobourov, Margaret Martonosi, James Rowland, and Alexander Varshavsky. Identifying important places in people’s lives from cellular network data. Pervasive Computing, pages 133–151, 2011.
- [18] Balázs Cs Csáji, Arnaud Browet, VA Traag, Jean-Charles Delvenne, Etienne Huens, Paul Van Dooren, Zbigniew Smoreda, and Vincent D Blondel. Exploring the mobility of mobile phone users. Physica A: Statistical Mechanics and its Applications, 2012.