Numerical simulations of super-critical black hole accretion flows in general relativity
Abstract
A new general relativistic radiation magnetohydrodynamical code KORAL is described, which employs the M1 scheme to close the radiation moment equations. The code has been successfully verified against a number of tests. Axisymmetric simulations of super-critical magnetized accretion on a non-rotating black hole () and a spinning black hole () are presented. The accretion rates in the two models are . These first general relativistic simulations of super-critical black hole accretion are potentially relevant to tidal disruption events and hyper-accreting supermassive black holes in the early universe. Both simulated models are optically and geometrically thick, and have funnels through which energy escapes in the form of relativistic gas, Poynting flux and radiative flux. The jet is significantly more powerful in the run. The net energy outflow rate in the two runs correspond to efficiencies of 5% () and 33% (), as measured with respect to the mass accretion rate at the black hole. These efficiencies agree well with those measured in previous simulations of non-radiative geometrically thick disks. Furthermore, in the run, the outflow power appears to originate in the spinning black hole, suggesting that the associated physics is again similar in non-radiative and super-critical accretion flows. While the two simulations are efficient in terms of total energy outflow, both runs are radiatively inefficient. Their luminosities are only , which corresponds to a radiative efficiency . Interestingly, most of the radiative luminosity emerges through the funnels, which subtend a very small solid angle. Therefore, measured in terms of a local radiative flux, the emitted radiation is highly super-Eddington.
keywords:
accretion, accretion discs – black hole physics – relativistic processes – methods: numerical – galaxies: jets1 Introduction
Accretion onto black holes (BHs) can occur through two major modes. If the amount of mass reaching the BH in a given time (mass accretion rate, ) is small, the accretion disk is expected to be optically thin. Such a disk cannot cool efficiently. Therefore, it is hot and geometrically thick (Narayan & McClintock, 2008; Yuan & Narayan, 2014). This mode of accretion is observed in quiescent AGN and in the low/hard state of X-ray binaries. Because of the relative simplicity of the physics involved (cooling is local and in many cases negligible), such systems have been extensively studied numerically. Having a code evolving a relativistic gas threaded by seed magnetic field in the proper general relativistic metric is enough to obtain the disk structure, at least in the very vicinity of the BH. In the last decade a number of such codes were developed (e.g., De Villiers et al., 2003; Gammie et al., 2003; Anninos et al., 2005; Del Zanna et al., 2007). They were used to study, e.g., physics of accretion near the inner edge of the disk (Shafee et al., 2008; Penna et al., 2010; Noble et al., 2011), jets (e.g., Tchekhovskoy et al., 2010a, b, 2011; Tchekhovskoy & McKinney, 2012a; Narayan et al., 2010; Penna et al., 2013b), outflows (e.g., Narayan et al., 2012b; Sa̧dowski et al., 2013b), viscosity (e.g., Penna et al., 2013a). What is more, the small optical depth allows us to calculate the electromagnetic spectrum in a separate postprocessing step (e.g., Shcherbakov et al., 2010; Dexter & Fragile, 2011). All these factors make hot thick disks relatively well understood.
The other accretion mode is optically thick accretion. In principle, it could take place at any accretion rate (Shakura & Sunyaev, 1973). For the smallest rates the disk cools efficiently and is geometrically thin. It can be either gas or radiation pressure dominated. When the accretion rate approaches and exceeds the Eddington rate,
| (1) |
(where we put the efficiency of a radiativelly efficient thin disk around a non-rotating BH111Such definition of ensures that a thin disk with and emits the Eddington luminosity, . However, this correspondence between the Eddington accretion rate and the Eddington luminosity is no longer valid for because efficiency of accretion on rotating BHs is higher. For example, a thin disk around a BH with () emits ., , and ), photons do not have enough time to diffuse out of the disk. Instead, they are advected with the flow, and end up inside the BH (Begelman, 1978; Abramowicz et al., 1988). Such photon-trapped accretion is, as in the case of hot thick disks, radiatively inefficient.
Optically thick accretion is understood only superficially. Most of our knowledge and modeling of such disks is based on the 40 year old papers of Shakura & Sunyaev (1973) and Novikov & Thorne (1973), who constructed a one-dimensional (1D) model of a radiatively efficient disk. Since that time, a large amount of data has been obtained by optical, X-ray, and -ray observatories. This new data has only brought new questions which remain open even today.
In contrast to optically thin disks, numerical studies of optically thick disks have so far been almost terra incognita. This is because of the level of complexity that the radiation field introduces — when scattering opacity is not negligible, each photon is scattered many times between its origin and the point of absorption, and tracking of single photons, is too demanding even for grey (frequency independent) problems. Other approaches must be considered. Most useful is to treat the radiation field as another fluid described by its own stress-energy tensor. The exact form of this tensor depends on the adopted approximation — the closure scheme.
The only existing radiative global simulations of accretion disks have been performed with non-relativistic codes and using the flux-limited diffusion or the Eddington approximation (Ohsuga et al., 2009; Ohsuga & Mineshige, 2011). These approaches are far from satisfactory as they do not handle optically thin regions, e.g., disk corona, properly, and do not include general relativity (GR). Recently, a more sophisticated approach — the variable Eddington tensor method — has been adopted in shearing box simulations (Jiang et al., 2012). However, due to its non-local character, implementing this scheme in GR is currently not feasible.
A natural closure scheme for global simulations in GR is M1 closure (Levermore, 1984) which evolves the radiative flux independently of the radiative energy density. It has been recently implemented into a GR hydrodynamical code KORAL (Sa̧dowski et al., 2013a), for neutrino radiation transport in a GRMHD code (Shibata & Sekiguchi, 2012), and into a special-relativistic magnetohydrodynamical (MHD) code by Takahashi & Ohsuga (2013).
In this work we introduce an MHD version of the GR radiation code KORAL, verify the code by solving a number of test problems (including relativistic radiation-modified magnetosonic linear waves), and apply it to a BH accretion problem by simulating super-critical accretion onto a BH.
The structure of the paper is as follows: In Section 2 we introduce the equations describing the evolution of gas, magnetic field, and radiation. In Section 3 we give details of the numerical code followed by a description of test problems in Section 4. In Section 5 we introduce and describe two simulations of super-critical accretion we have performed. We conclude and discuss the implications in Section 6.
2 Equations
2.1 Conservation of mass, energy and momentum
The conservation laws for a fluid can be written in the covariant form,
| (2) | |||||
| (3) |
where is the gas density in the comoving fluid frame, is the gas four-velocity as measured in the “lab frame”, and is the MHD stress-energy tensor in this frame (Gammie et al., 2003),
| (4) |
Here and represent the internal energy and pressure of the gas in the comoving frame and is the magnetic field 4-vector (Gammie et al., 2003).
The conservation of energy and momentum of the radiative field can be described by introducing the radiative stress-energy tensor (Mihalas & Mihalas, 1984, Section 2.3) which satisfies, assuming zero opacities for the moment,
| (5) |
In more general case of non-zero opacities, the gas and radiation field are coupled and must satisfy conservation of total energy and momentum,
| (6) |
The interaction between the gas and the radiation may be described with the help of the radiation four-force density (Section 2.3) such that,
| (7) | |||||
The opposite signs of the source terms on the right hand sides of the two equations reflect the fact that the gas-radiation interaction is conservative, i.e., it transfers energy and momentum between gas and radiation.
2.2 Maxwell’s equations
We adopt the ideal MHD approximation and assume that the electric field vanishes in the fluid rest frame. Maxwell’s equations may be written as (Gammie et al., 2003),
| (11) |
where is the Maxwell electromagnetic tensor, and is the four-vector of comoving magnetic field. They can be further simplified by introducing the magnetic field three-vector (Komissarov, 1999) which satisfies,
| (12) |
| (13) |
In terms of , Maxwell’s equations in the coordinate basis are,
| (14) |
| (15) |
The first equation is the induction equation which describes the oveolution of the magnetic field. The second equation is the divergence-free condition and is not evolved directly. Instead, the flux-interpolated contrained transport (Flux-CT) method of Tóth (2000) is used to prevent numerical generation of magnetic monopoles.
2.3 Radiative stress-energy tensor and four-force
The radiation stress-energy tensor in an orthonormal frame comprises various moments of the specific intensity , e.g., in the fluid frame it takes the following form,
| (16) |
where the fluid-frame quantities, denoted with “hats”, are defined as,
| (17) | |||||
| (18) | |||||
| (19) |
is the radiation energy density, is the radiation flux and is radiation pressure tensor, and is the unit vector in the direction of .
In the same frame, the four-force is given by (Mihalas & Mihalas, 1984),
| (20) |
where and denote the frequency-dependent opacity and emissivity coefficients. takes a particularly simple form for grey opacities,
| (21) |
Here, is the integrated Planck function corresponding to the gas temperature , is the Stefan-Boltzmann constant, and are the grey absorption and total opacity coefficients, respectively. The total opacity consists of the absorption () and scattering () opacities, i.e., .
The comoving-frame radiative four force (Eq. 21) may be written in the following form,
| (22) |
The contravariant and covariant orthonormal comoving-frame gas velocities are , and , respectively. From Eq. (16) it follows that,
| (23) |
and
| (24) |
Using these definitions in Eq. (22) we obtain,
| (25) |
This expression is written in a covariant form, so it is valid in any frame. Therefore, we can skip the “hats” and obtain the following expression for the radiative four-force, which is valid in an arbitrary frame,
| (26) |
Note that for non-trivial four-velocities , the four-force depends on all the components of , not just the lab frame energy density () and flux ().
2.4 Closure scheme
To close the above set of equations we need a prescription to compute the second moments of the radiation intensity. Specifically, we need a prescription to write down the full radiation stress tensor knowing only the radiative energy density and the fluxes . We follow the M1 scheme, introduced by Levermore (1984), and assume that the radiation tensor is isotropic, and satisfies the Eddington closure, not in the fluid frame, but in the orthonormal “rest frame” of the radiation. The latter is defined as the frame in which the radiative flux vanishes.
Sa̧dowski et al. (2013a) introduced a covariant formalism for the M1 scheme. Herein, we give only the essential formulae and ask the reader to refer to that paper for details.
Knowing we may calculate the time-component of the radiative rest-frame four velocity, , and radiative energy density in this frame, , by solving a set of two equations,
| (27) |
| (28) |
These quantities may be then used to find the spatial components of using the time component of,
| (29) |
Once the four-velocity of the radiative rest frame, , and the radiative energy density in that frame, , are known, one can use Eq. (29) again to find all the unknown components of the radiative stress energy tensor .
The M1 closure scheme handles well both extremes of the optical depth and it is found to be fairly good at intermediate optical depths as well. However, the implicitly assumed specific intensity is always symmetric with respect to the mean flux. The M1 closure scheme is thus expected to be inaccurate when multiple sources of radiation are involved. In problems involving accretion disks, which are the primary interest of this paper, anisotropic configurations with multiple beams are not very common, as the light is expected to be emitted into the optically thin region from a continuous and smooth photosphere, and the M1 scheme is probably adequate. In any case, M1 closure provides a significantly superior treatment of radiation in the optically thin regions near and above the disk photosphere, compared to the Eddington approximation or flux-limited diffusion. It is, in the same time, much less precise than non-local methods, e.g., the Variable Eddington Tensor approach (Jiang et al., 2012), which are, unfortunately, difficult to implement in general relativity.
3 The GRRMHD code — KORAL
The numerical code KORAL was developed initially without magnetic fields as a general relativistic radiation hydrodynamics code (Sa̧dowski et al., 2013a). In this paper we describe the extension of KORAL to GRRMHD. The basic methods we use are the same as in the original code except that the radiation implicit solver has been updated as described in Section 3.3. Below we give a general description of the code and refer the reader to Sa̧dowski et al. (2013a) for details not given here.
3.1 The algorithm
The code uses a finite difference scheme with linear slope-limited reconstruction and the van-Leer’s one-parameter family of minmod limiters with the dissipation parameter if not mentioned otherwise. The fluxes at the cell faces are calculated using the Lax-Friedrichs method. The source terms are applied at the cell centers and the time stepping is performed using the second order Runge-Kutta method.
A set of 13 equations is evolved. It comprises of rest mass conservation (Eq. 8), four energy and momentum conservation equations for the MHD fluid (Eq. 9), and for the radiation field (Eq. 10), three components of the induction equation (Eq. 14), and the entropy evolution equation, , which in the coordinate frame is,
| (30) |
where,
| (31) |
is the gas entropy per unit volume.
The vector of conserved quantities is (see Section 3.4)
| (32) |
while the primitive quantities are,
| (33) |
Conversion from conserved to primitive quantities is described in Section 3.2.
During each sub-step of the Runge-Kutta time integration, the code carries out the following steps in the given order:
- 1.
-
2.
Ghost cells at the boundaries of the computational domain are assigned primitives appropriate to the boundary conditions of the particular problem of interest.
- 3.
-
4.
For each dimension, primitives are interpolated to obtain their left- and right-biased values at cell faces: and which are verified against floors.
-
5.
From and , left- and right-biased fluxes and are calculated at cell faces and are then combined using the Lax-Friedrichs scheme.
-
6.
These combined fluxes are modified following the flux-interpolated constrained transport algorithm (Tóth, 2000) to preserve divergence-free magnetic field.
-
7.
The advective time derivative is calculated using an unsplit scheme,
(34) where denotes cell size in the direction .
- 8.
-
9.
The advective and geometrical operators are used to update the conserved quantities according to
(35) That is, all these terms are treated in an explicit fashion.
-
10.
The updated vectors of conserved quantities are used to calculate the corresponding updated primitive quantities at cell centers. Floors are applied if required.
-
11.
Finally, the remaining four-force density , is handled implicitly using the method described in Section 3.3. This results in a final update of the vector of conserved quantities at each cell center.
3.2 Conversion between conserved and primitive quantities
Throughout the algorithm the vectors of conserved and primitive quantities have to be converted one to the other multiple times. In our problem, the MHD and radiative variables decouple, so the conversion may be done separately for each.
In GR numerical codes starting from MHD primitive quantities and calculating the vector of MHD conserved quantities is algebraic and straightforward. The opposite calculation (inversion) requires a numerical solve for which we use the “” inversion scheme described in Noble et al. (2006).
The radiative conserved variables () may in principle be easily converted to the radiative primitives (, ) following the algorithm described in Sect. 2.4. However, it requires solving a quadratic equation which may not provide a finite and positive solution for . Such a case corresponds to unphysical flux, , where stands for the speed of light, and may appear because of truncation error, especially near radiation fronts in optically thin regions. To handle such failed inversions we increase the lab-frame energy density, , to achieve a prescribed limiting value of the radiation rest frame Lorentz factor, . Details of this procedure are given in the companion paper McKinney et al. (2013).
3.3 Implicit treatment of radiative source terms
The radiative source term in Eqs. (9) and (10) becomes stiff in optically thick regime and has to be handled implicitly (e.g., Zanotti et al., 2011). In both the original and the GRRMHD version of the KORAL code we take the semi-implicit approach, i.e., we split the advective operator (spatial derivatives in Eqs. 8-10) from the radiative source term operator (terms proportional to ) and apply the latter locally. Such an approach is possible because the time step is already limited by the speed of light just from the fluid dynamics, so advection of radiation is guaranteed to be stable in an explicit scheme. The implicit solver has been updated and is described in detail below.
The radiative source term operator describes the interchange of the energy and momentum density between the gas and radiation field. The corresponding equations are,
| (36) | |||
| (37) |
which can be put in the implicit form as,
| (38) | |||
| (39) |
where the subscripts and denote values at the beginning and end of a time step of length , respectively.
Because of the symmetry of the problem, specifically, the right-hand sides of eqs. (38) and (39) differing only by sign, the system of equations may be reduced to four non-linear equations. In the original version of KORAL we chose the radiative conserved quantities, , as the quantities we iterated inside the numerical solver. This approach, however, turned out not to be very robust. It fails when the energy densities of the gas and radiation are many orders of magnitude different, or when iteration steps lead to unphysical states, preventing a proper radiative or MHD inversion. The algorithm we propose here uses radiative or MHD primitives (in place of conserved quantities) as the iterated quantities, prevents the iterations from going out of bounds, and reverts to the entropy conservation equations when the energy equation does not provide a solution. We solve the equations in the lab frame, but if that fails, we try again with the energy equation written in the fluid-frame. The scheme adopted here is not unique, and other approaches turn out to be efficient as well (e.g., McKinney et al., 2013).
The semi-implicit scheme implemented in KORAL is decribed in detail below. We assume that it iterates the MHD subset of primitive quantities, though the algorithm is the same even for the case of radiative primitives.
-
1.
The complete set of primitives (initial guess or current iteration stage), , is used to calculate the radiative four force .
-
2.
Residuals and the error measure are calculated through,
(40) (41) where are the MHD conserved quantities obtained from . If the solution is found.
In case of the fluid-frame-based method, the time component of Eq. 40 is replaced by,
(42) with . The error measure is calculated appropriately.
-
3.
In a similar fashion we estimate the Jacobi matrix,
(43) by repeating the procedure for slightly (we choose factor of ) modified values of each of the MHD primitives. If such a sub-step leads to an unphysical state, e.g., , we recalculate the residuals modifying the quantity of interest by the same amount but with the opposite sign.
-
4.
The iterated primitives are then updated using the inverse of the Jacobi matrix, (this is the Newton-Raphson method),
(44) where the factor is initially set to .
-
5.
If the new time-component of the primitive vector, i.e., the energy density, is negative, the factor is reduced appropriately (using linear interpolation) not to leave the physical regime.
-
6.
Knowing the new vector of MHD primitives, , we calculate the corresponding set of conserved quantities, .
-
7.
We use the conservation of energy and momentum to calculate the radiative conserved quantities, , through,
(45) -
8.
We perform the radiative inversion to obtain the corresponding set of radiative primitives . We note that this is the only inversion that has to performed, in contrast to the method described in Sa̧dowski et al. (2013a) where full (radiative and MHD) inversion was required. Moreover, we stress that the radiative inversion is given in a closed form and does not require numerical solvers. Therefore, iterating MHD primitives is less computationaly expensive than iterating radiative primitives.
-
9.
If the inversion fails (corrections were applied indicating an unphysical state), the factor is reduced by a factor of and are recalculated (step iv). This procedure is repeated until a physical state is found or until in which case a failure is reported.
Having in mind that the iterated quantites should be the sub-dominant ones (in the other case even small shifts in the dominant primitives may have an overwhelming effect on the sub-dominant ones) we choose to solve initially using the MHD primitives if , i.e., we compare fluid frame energy densities after the advection operator has been applied. If implicit solver fails, we revert to the other set of primitives. If both methods fail (rare event, see below) we try them again in the same order but this time replacing the energy equation (Eq. 40),
| (46) |
with the fluid-frame entropy evolution equation,
| (47) |
where is the entropy per unit volume given in Eq. 31.
The method described above is robust and fails only in pathological situations which may occur sporadically near shock fronts or near the axis. In such a case the code averages out the problematic cell by taking the average of primitives in the neighbouring cells which have evolved properly.
In the developed stage of a disk-jet simulation with BH spin described in Section 5 the implicit solver works in 97% of cases on the most-robust MHD primitives, and on radiative primitives in the remaining 3% of cases. The average numbers of iterations within the solver are 2.2 and 3.1, respectively. The solver practically never reverts to the entropy evolution. The latter is used very sporadically in the initial stages of the simulation when the empty space outside the torus is abrubtly filled first by the radiation fields, and then by magnetic fields. Once this initial transient adjustment is over, the energy evolution equation works 100% of the time.
3.4 Implementation notes
- 1.
-
2.
In cold relativistic flows, where , the numerical accuracy is not sufficient to evolve the internal energy reliably. As a result, negative internal energy densities may be occasionally found. Whenever this happens, we perform the MHD inversion using the independently evolved value of entropy, , instead of . In the case of successful energy-based inversion, we update the value of entropy according to the new gas primitives and evolve it independently in the next time step.
-
3.
Because of the truncation error, the geometrical source terms involving Christoffel symbols (Eqs. 9 and 10) do not balance the corresponding spatial derivatives on the left hand side even for particularly simple situations such as constant gas or radiation pressure, and can lead to catastrophic secular errors. To solve this issue we modify the values of the Christoffel symbols suitably following Appendix A of McKinney et al. (2012).
-
4.
The vector of primitives includes spatial components of gas and radiation rest frame four-velocities and . Inside the BH ergosphere they do not determine corresponding values of uniquely (two time-like observers may have the same spatial components of four-velocity). Therefore, instead of the regular four-velocity, , we use velocity defined with respect to the normal (with four velocity ) observer. The conversions between the velocities read,
(49) (50) where , , , and is the Kronecker delta.
-
5.
To ensure stability of the code and to prevent unphysical runaway of mass from the polar region in disk-jet simulations we impose a number of constraints (’floors’ and ’ceilings’) on the primitive quantities. Firstly, we do not allow the internal energy density either to drop below of the rest mass density, , or to exceed it by a factor of . We impose a maximal Lorentz factor on gas and the radiation rest frame. If the magnetic pressure, , exceeds by a factor of or more, we introduce extra mass in the ZAMO frame and modify the internal energy density to keep the temperature fixed. If turns out to be negative, we average such a cell out using primitives from successfully evolved neighbors.
-
6.
Units — Radiative code requires proper coupling of radiation and gas physical constants. Besides setting , we choose to keep the kelvin as the unit of temperature. Table 1 gives code values of constants and the conversion factors between the code and cgs units.
Table 1: Physical constants and conversion factors between code and cgs units. stands for the BH mass in cgs units. constant code value Boltzmann constant Stefan-Boltzmann constant Proton mass quantity code to cgs units conversion factor length time velocity temperature mass density energy density energy flux opacity
4 Test problems
The original KORAL code was extensively tested in Sa̧dowski et al. (2013a). The set of test problems solved there verified the evolution of relativistic hydrodynamical fluids, optically thin radiation in curved spacetimes, and the interaction between gas and radiation. The GRRMHD version of KORAL introduced in this paper solves properly all these previous tests. In this Section we test the evolution of magnetic fields, which are a new feature in the code, and the coupling to gas and radiation. We start with a set of linear radiation-MHD wave problems followed by non-linear tests: magnetic shock tubes and the Orszag-Tang vortex test problem.
4.1 Radiation modified MHD linear waves
We begin with studying propagation of linear waves to test accuracy of the coupled evolution of gas and radiation, and the convergence rate of the code. We follow Jiang et al. (2012) but we recalculate the dispersion relation for a relativistic fluid by perturbing Eqs. (8)-(10)222 Mathematica notebook used to derive the dispersion relation and solve for the eigenmodes is available at http://cfa.harvard.edu/~asadowski/research/koral/rmhd.nb. We set a uniform background state on top of which we impose perturbations corresponding to a given eigenmode and evolve the system until the wave crosses the domain. We studied a set of 9 linear waves solved on a one dimensional grid. All three spatial components of velocity, magnetic field, and radiation flux were evolved. The wavelength was chosen to match the length of the domain spanning . The absorption opacity and the velocity of the background state were set to zero, the internal energy density corresponded to the speed of sound , and the magnetic field to the Alvfen velocity .
The parameters of the background state and the perturbations are given in Table 2. The top row corresponds to (left to right) sonic, fast-magnetosonic and slow-magnetosonic waves for a fluid decoupled from radiation. The second row gives the same modes but for optically thin gas (). The bottom row corresponds to optically thick medium (). For each of the waves, is the wave speed, and determines the rate of damping resulting from transfer of energy between gas and radiation (Mihalas & Mihalas, 1984). All the non-radiative waves (top row) are not dissipative ().
After time we calculate the L1 error,
| (51) |
where is the resolution, and and correspond to the numerical and analytical solutions, respectively. Fig. 1 presents the errors as a function of resolution. The top panel corresponds to pure HD and MHD waves. They all converge as second order, as expected. The middle panel shows the L1 error for optically thin waves. The rate of convergence is the same because the evolution is dominated by the advective operator and the radiative source term (which is applied implicitly) is insignificant. It is not the case for optically thick gas. The rate of convergence is expected to be only linear because of the source term which dominates the evolution. As the bottom panel shows, the radiation-modified sonic and fast-magnetosonic waves indeed show only linear convergence. The slow-magnetosonic wave converges at an intermediate rate.
| No. | , | , fast | , slow |
|---|---|---|---|
| No. | , | , , fast | , , slow |
| No. | , | , , fast | , , slow |

4.2 Magnetic shock tubes
We choose two one-dimensional shock tube problems (2a and 5a) from Ryu & Jones (1995) to verify the non-linear evolution of a magnetized fluid. We initialize the problem as left and right states separated with a membrane which is removed at . Table 3 lists gas parameters of both states. We have scaled the values from Ryu & Jones (1995) down to make the problem compatible with a relativistic code (the corresponding velocity scaling factor, , is given in the table). We solved the problem on a grid of 512 uniformly spaced points with .
| Test | Left state: | Right state: | ||||||||||
|---|---|---|---|---|---|---|---|---|---|---|---|---|
| No. | ||||||||||||
| 2a | 5/3 | 100 | 1.08 | 1 | ||||||||
| 5a | 5/3 | 100 | 1 | 0.125 | ||||||||
Figs. 2 and 3 show the solutions for problems 2a and 5a, respectively, at time . Profiles of (top to bottom) density, two components of velocity, -component of magnetic field, and -component of magnetic field (Fig. 2) or gas pressure (Fig. 3) are shown. All quantities have been scaled back to make the plots directly comparable with Figs. 6 and 7 from Gammie et al. (2003). Similar plots may be found, e.g., in Ryu & Jones (1995) and Stone et al. (2008). The agreement with these previous studies is very good.


4.3 Orszag-Tang vortex
The magnetic shock tubes tested one-dimensional evolution of magnetized fluid. In this Section we perform a two-dimensional test which in addition allows us to test the flux-constrained transport algorithm (the divergence is trivially conserved in one-dimensional tests). For this purpuse we use the standard Orszag-Tang vortex test problem (Orszag & Tang, 1979).
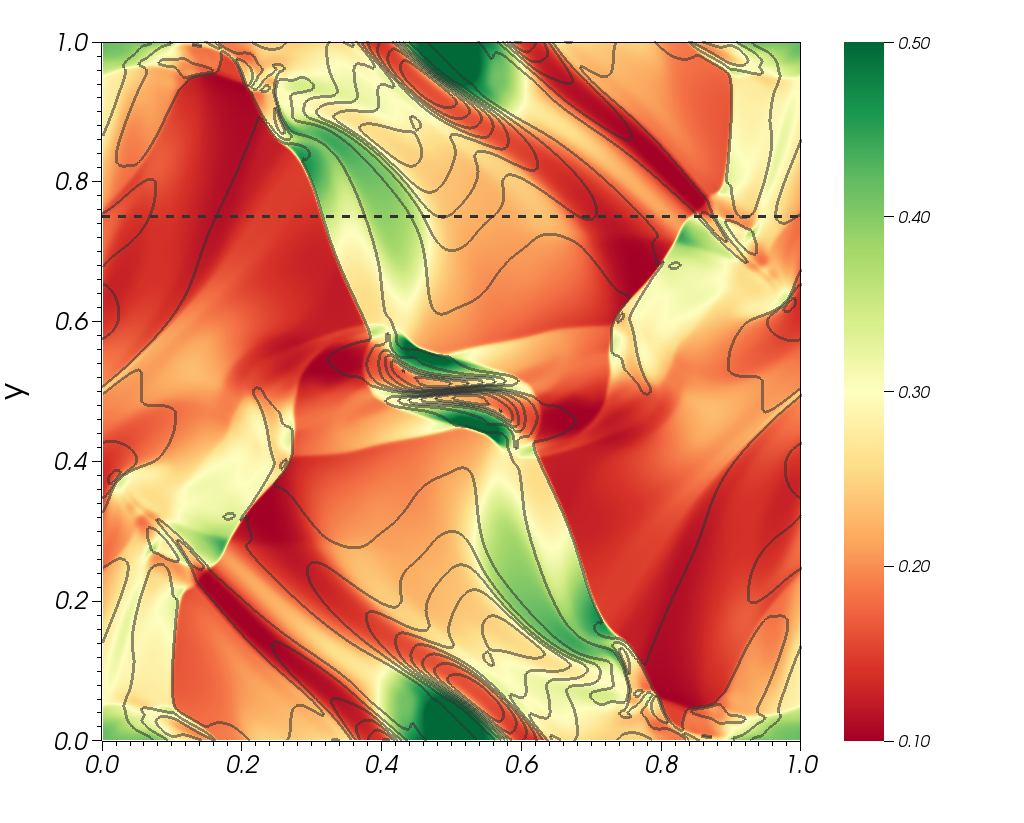
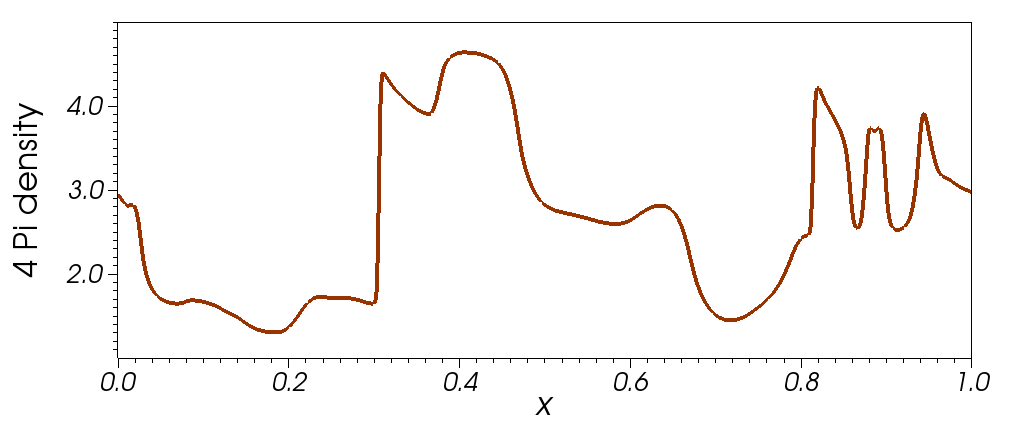
The initial state is set up following Stone et al. (2008) but rescaling all quantities by a velocity factor . The density and pressure are initially uniform and set to , and , respectively. The velocity field is . The magnetic field is set based on the vector potential with . The problem is integrated over the domain with periodic boundary conditions, and 640x640 cells.
The top panel of Fig. 4 shows the density (colors) and magnetic pressure (contours) at time . These can be directly compared to Fig. 22 from Stone et al. (2008) (although their solution was calculated on a coarser grid of 192x192 points). The bottom panel shows a slice in density along (denoted by the dashed horizontal line in the top panel) which can be compared with Fig. 9 of Gammie et al. (2003). Again the agreement is very good. We have also verified that (Eq. 15) throughout the evolution.
5 Super-critical accretion
As a test application of the code we have simulated super-critical, i.e., exceeding the Eddington limit, accretion on a non-rotating () and a spinning () BH.
5.1 Initial configuration
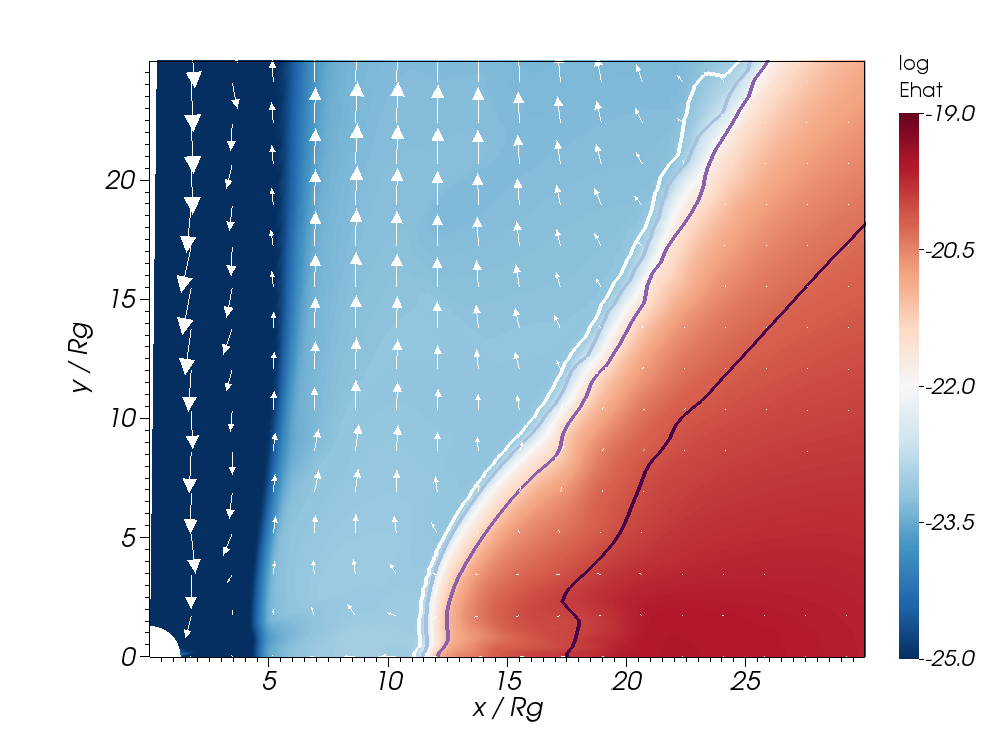
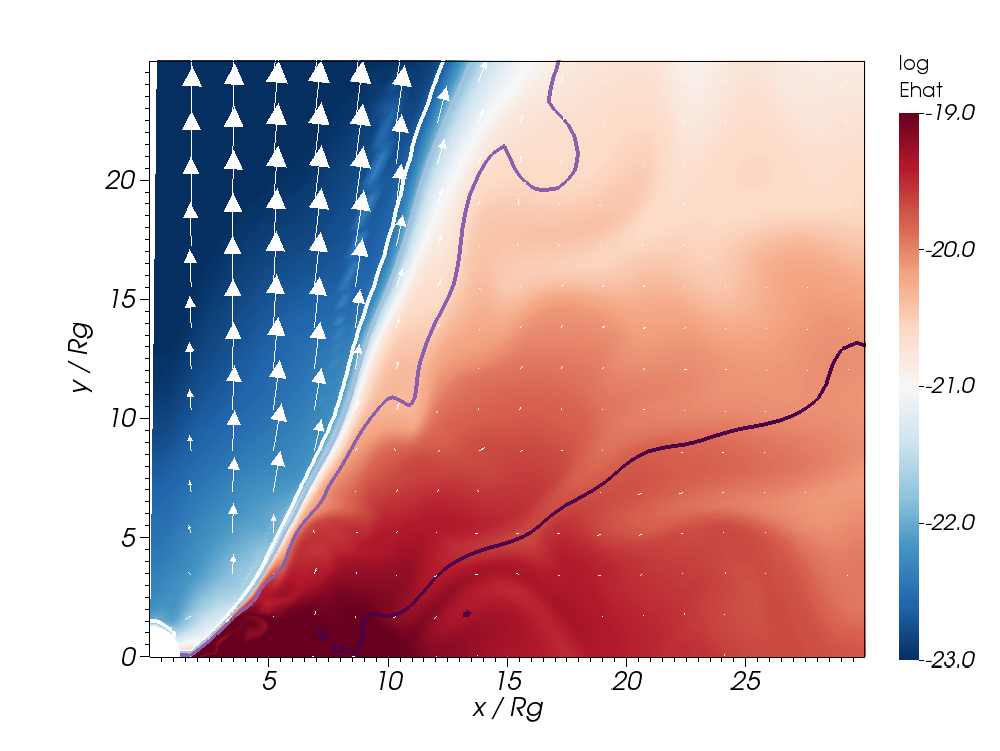
The left panel of Fig. 5 shows the initial state with the left half showing the comoving frame radiative energy density (), and the right half showing the gas density. The equlibrium torus was set up following Penna et al. (2013c) with the parameters listed in Table 4. The torus model provides the distribution of total pressure, , and gas density, , assuming (which is the correct value for a radiation pressure dominated disk). This pressure is then distributed between gas and radiation so as to satisfy local thermal equilibrium (LTE, ). This involves solving the following quartic equation for gas (and radiation) temperature,
| (52) |
Once the initial state has been set the polytropic index of the non-relativisitic gas is fixed at during the simulation. Because of the slight inconsistency in the value of , the torus is not in the perfect equilibrium at early times. However, it remains in a relatively steady state until the magnetorotational instability (MRI) grows, after which the initial state is irrelevant.
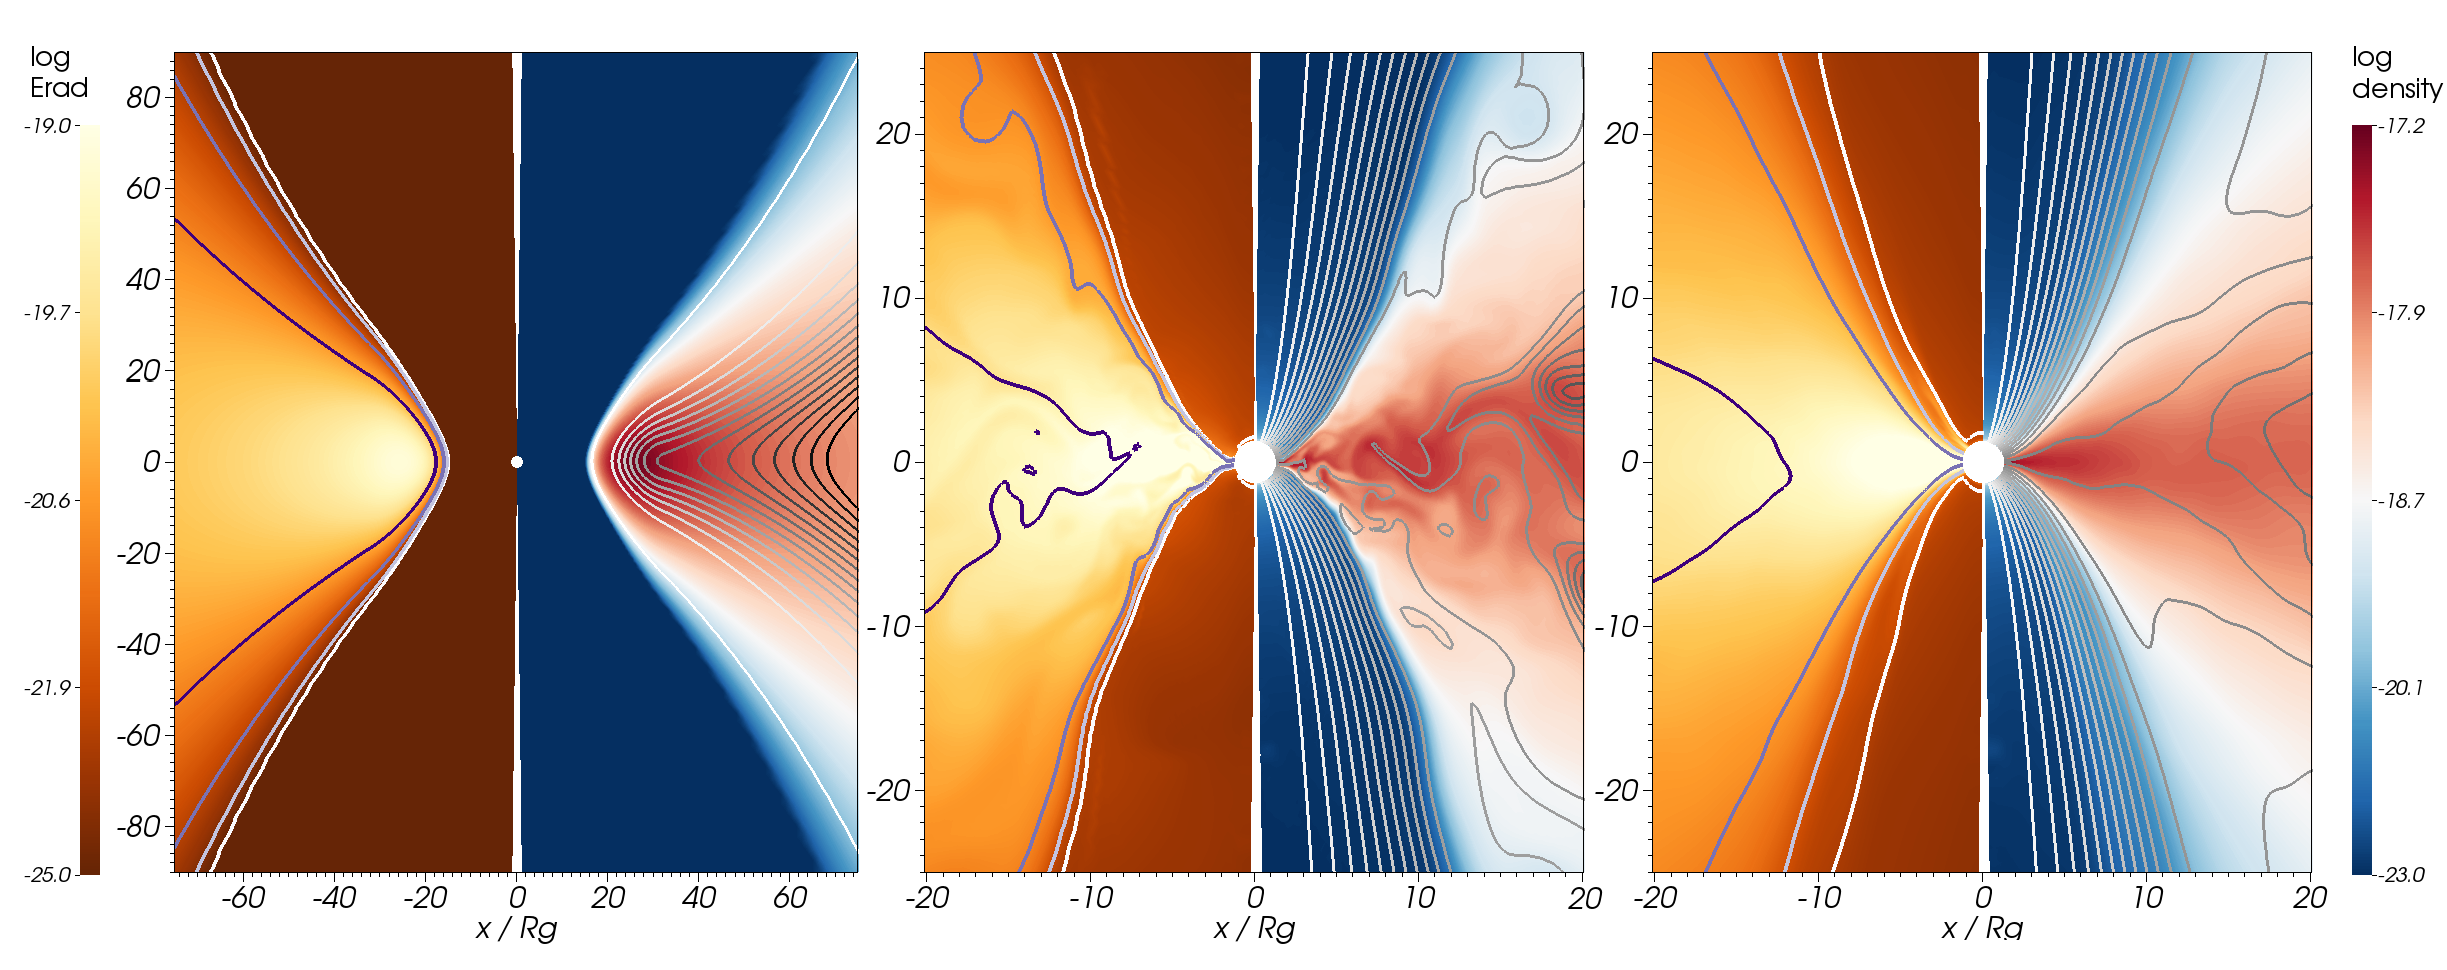
The torus is initially threaded by a single poloidal loop of magnetic field (left panel of Fig. 5) corresponding to a vector potential,
The magnetic field is then normalized so that the plasma parameter , where and stand for the total and magnetic pressure, respectively, does not drop below at the equatorial plane. The typical value of the initial near the torus pressure maximum () is .
The torus is surrounded by a low density and optically thin atmosphere. The velocities of both the gas and radiation rest frame in the atmosphere correspond to the normal observer (relative velocity ). The density and internal energy here are set following , and , respectively, with , and corresponding to temperature . The radiative energy density, , is set to a residual value of in the code units.
| 15 | 31.75 | 200 | 0.9 |
5.2 Numerical setup
We evolved the disks in two dimensions, assuming axisymmetry, on a uniform grid of 200 points in the polar angle (spanning ), and non-uniform, exponential grid of 300 points in radius. The internal () and Boyer-Lindquist () radial coordinates were related by,
and the range of uniform internal coordinates was chosen to correspond to and for and , respectively. Such a choice of the inner radius ensures that the innermost 6 cells are located inside the BH horizon. We solved the problem on the appropriately modified Kerr-Schild coordinates.
At the inner radial boundary we applied the outflow boundary condition by copying values of all the primitive quantities to the ghost cells. At the outer radial boundary we adopted a similar approach, except that we prevented the inflow of gas or radiation by resetting negative radial velocities to zero. Reflective boundary condition was adopted at the polar axis. To ensure stability in this region the gas velocity in the two closest cells to the polar axis was appropriately overwritten with the velocities from the third cell (McKinney et al., 2012). Radial and azimuthal components were copied, and the polar component was interpolated towards zero to satisfy the reflective boundary condition.
To verify that the adopted resolution is enough to resolve the fastest growing mode of the MRI we calculate the parameter (Hawley et al., 2011),
| (53) |
where is the grid cell size in . For the initial state of our simulations near the torus pressure maximum, which is adequate.
5.3 General properties
At the onset of the simulation, some radiation (which fills the entire initial torus) diffuses out through the torus surface and propagates into the optically thin atmosphere. This initial flux results from the flux providing pressure support inside the torus. Radiation propagates with the speed of light and initially fills the entire space around the torus. After a while, the angular component of the radiative flux, corresponding to the rotation of the optically thick gas in the torus, prevents radiation from reaching the polar axis and a temporary “radiation shock” forms close to the axis. This effect, resulting from improper handling of collimating beams by the M1 scheme, is discussed in more detail in Appendix A. Once the disk gets thicker and sub-Keplerian, radiation penetrates the entire polar region and the shock dissapears.
Rotational shear makes the initial magnetic field unstable against MRI. After a few orbital periods of the torus inner edge, the gas becomes turbulent, loses angular momentum, and accretion begins. The middle panel of Fig. 5 shows a snapshot of the simulation taken after which shows the turbulent structure of the flow. The left and right halves of the panel show comoving frame radiation and rest mass energy densities, respectively.
The contours in the left half show the total optical depth (integrated from the polar axis) and correspond to (white), , , and (deep blue). The disk is clearly very geometrically thick, as expected for a radiativelly inefficient accretion flow. For cylindrical radius , the photosphere, defined as the surface where total optical depth measured from the polar axis is equal to unity,
| (54) |
is located at angle . The Lorentz factor accounts for the fact that the opacity is given in the comoving frame, and we assume that the gas in the optically thin region moves radially, i.e., perpendicularly to path of integration (Rybicki & Lightman, 1979). In contrast to the standard thin disk, the accretion flow does not terminate at the innermost stable circular orbit (ISCO). This is consistent with models of thick accretion disks (e.g., Abramowicz et al., 2010).
The contours in the right half show the lines of the poloidal magnetic field. Initially, the field forms a single loop and is confined to the equilibrium torus. Once the accretion starts, magnetic field is dragged with the gas and deposited on the BH, as reflected in the region of laminar, dense magnetic field lines in the low-density funnel near the polar axis. The increased magnetic pressure in this region pushes on the disk from top and bottom and explains the decreased disk thickness in this region. Colors in the right half of the middle panel show the distribution of density. It is strictly correlated to the distribution of comoving radiation energy density. This is because inside the photosphere the scattering opacity is large and photons are trapped in the gas and radiation and gas move together.
The right panel of Fig. 5 shows the time averaged structure of the disk. All the turbulence has cancelled out and the density and radiative energy density distributions are smooth.
Because of the large scale structure of the initial magnetic field in the inner region of the torus, the magnetic flux on average keeps accumulating at the BH. The top panel of Fig. 6 shows the time evolution of the magnetic flux parameter defined as,
| (55) |
where represents the time-averaged accretion rate, ,
| (56) |
averaged over time (see below), and is the determinant of the metric. The green and orange lines correspond to and , respectively. The magnetic flux at the BH is initially zero and starts to increase when gas reaches the horizon. The initial increase around is rapid reflecting large magnetic pressure to gas density ratio near the inner torus boundary. The magnetic flux increases much more slowly, however steadily, later on. Around (for ) and ( crosses the typical value for magnetically arrested disks (MADs) (Tchekhovskoy & McKinney, 2012a). Such a state, when pressure of the accumulated magnetic field balances the inward gravitational force, cannot be maintained in two dimensions (in three dimensions gas can distribute non-uniformly in azimuth and ’sneak in’ between vertical magnetic field lines), and soon afterwards the accretion is stopped and enters violent, unphysical evolution when gas bounces back and forth from the magnetic wall at the horizon (Igumenshchev et al., 2003; McKinney et al., 2012). This is clearly seen in the bottom panel of Fig. 2 which shows the accretion rate history. Once the magnetic flux significantly exceeds the MAD limit, the accretion rate violently oscillates. Because of this limitation, we did not run the simulations longer and we limit the subsequent analysis to the time period when the disk is far from the MAD regime. We choose and for and runs, respectively. Such a relatively short duration of simulations is reflected in the fact that the extent of the inflow equilibrium region is limited to, as discussed in the following sections, to .
The accretion history plot shows the turbulent character of the accretion and suggests average accretion rate around for both runs. More detailed analysis is given below.


5.4 Fluxes
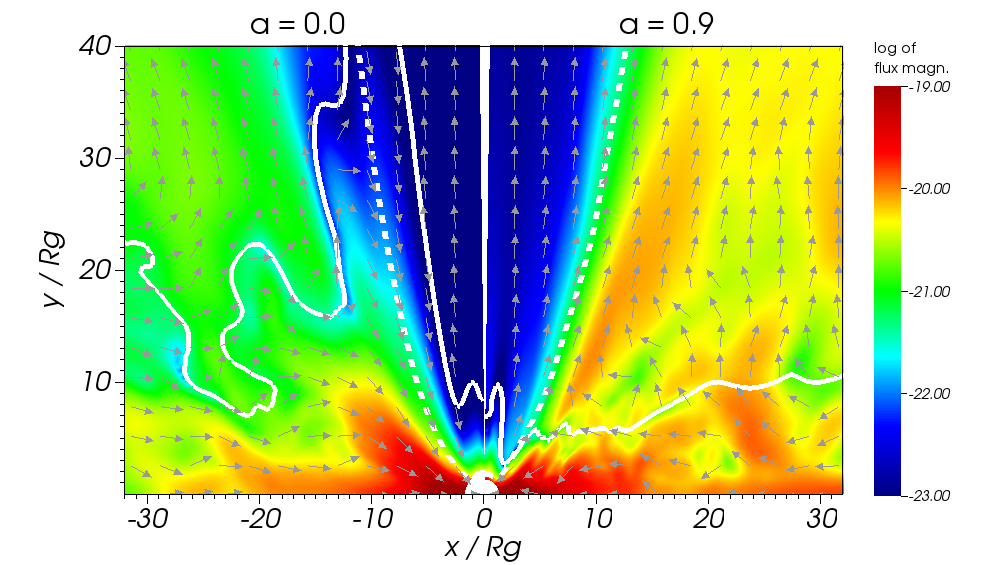
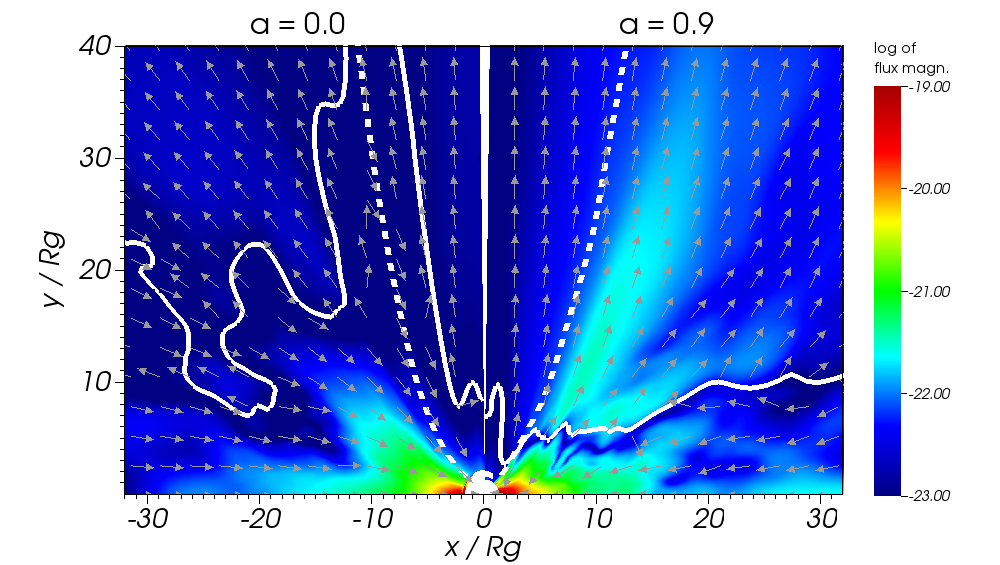
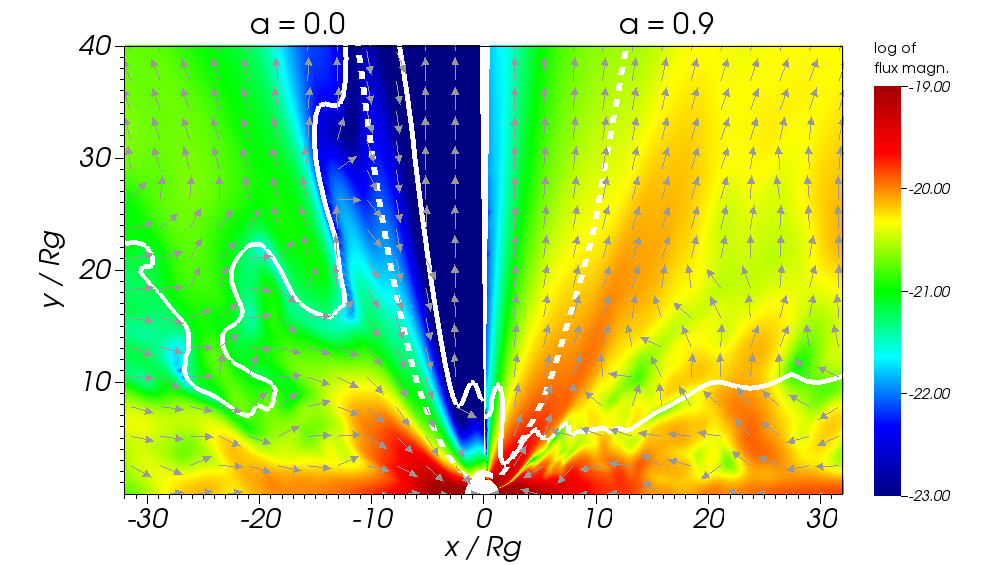
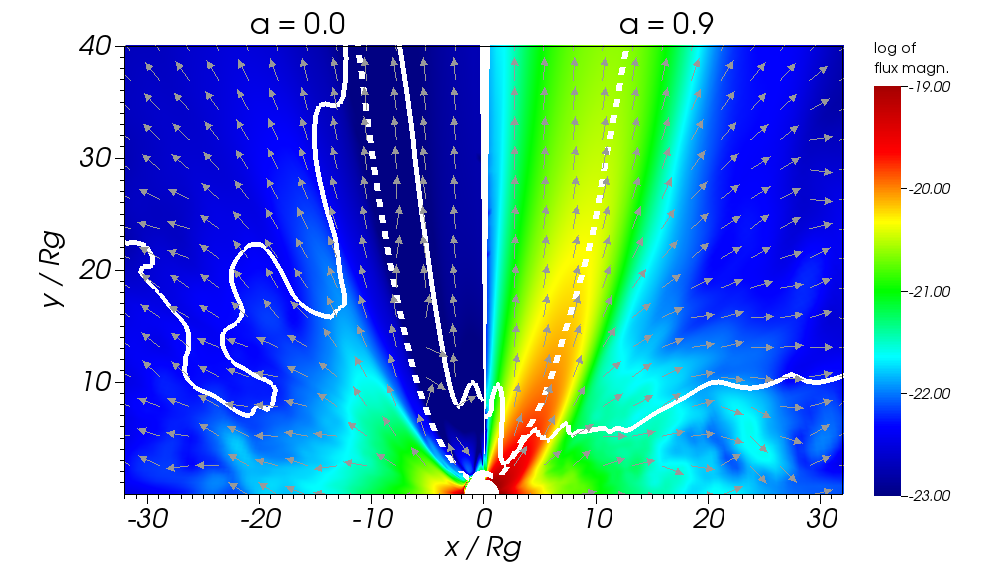
Looking at fluxes of rest mass and energy helps understand the structure of an accretion flow. Fig. 7 presents (from top to bottom) time-averaged radial fluxes of rest mass (), radiation energy (), magnetohydrodynamical energy (), and energy available at infinity (). Left and right halves of the panels correspond to and , respectively. Colors show the magnitude of a given flux, arrows show its direction on the poloidal plane. Solid white lines show the boundary between the inflow (near the equatorial plane) and outflow (above) regions, which are distinguished based on the sign of 333 We first average and only then apply the outflow condition. Yuan, Bu, & Wu (2012), on the contrary, classified gas as outflowing independently in each snapshot data. Discussion of these two methods is given in Yuan & Narayan (2014). . Dashed white lines denote the location of the photosphere ().
5.4.1 Rest mass flux
The topmost panel in Fig. 7 presents the flux of rest mass. Close to the equatorial plane mass flows (on average) laminarly towards the BH. In the case of a non-rotating BH the inflow region extends as far as the photosphere. Mass flows out in the polar region, above the disk surface. However, the magnitude of the flux there is negligible. The outflow region at intermediate polar angles at radii is too far from the BH to reach the proper inflow/outflow equilibrium and cannot be trusted.
The mass flow structure is qualitatively different for the rotating BH case. Gas closest to the equatorial plane on average falls on the BH, as before. However, some fraction of the gas starts inside the inflow region, then crosses the solid white line and flows out. The region of outflows starts at the polar axis and extends quite close to the equatorial plane covering roughly of the total solid angle, of which at is covered by the optically thin outflow in the polar funnel. Outflowing gas accumulates roughly along polar angle , just outside the optically thin polar region, forming an optically thick wind. This structure is specific only to rotating BH and may be identified with the ’disk jet’ found in numerical simulations of optically thin disks (McKinney et al., 2012; Tchekhovskoy & McKinney, 2012a; Tchekhovskoy et al., 2012b; Sa̧dowski et al., 2013b; Yuan & Narayan, 2014).
|
|
|
|
|
|
|
|
|
|
|
|
The magnitude of the outflow clearly is comparable with the inflow accretion rate. To quantify the mass flux we integrate it over the total surface of a sphere and obtain the average net flux, ,
| (57) |
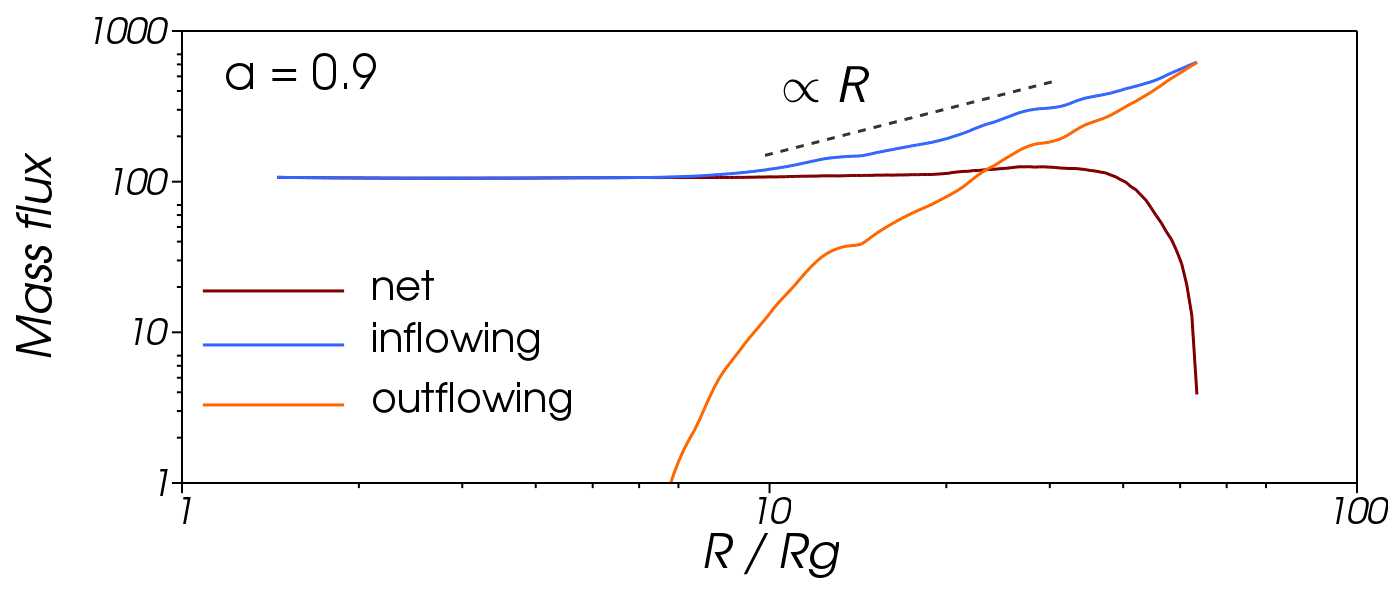
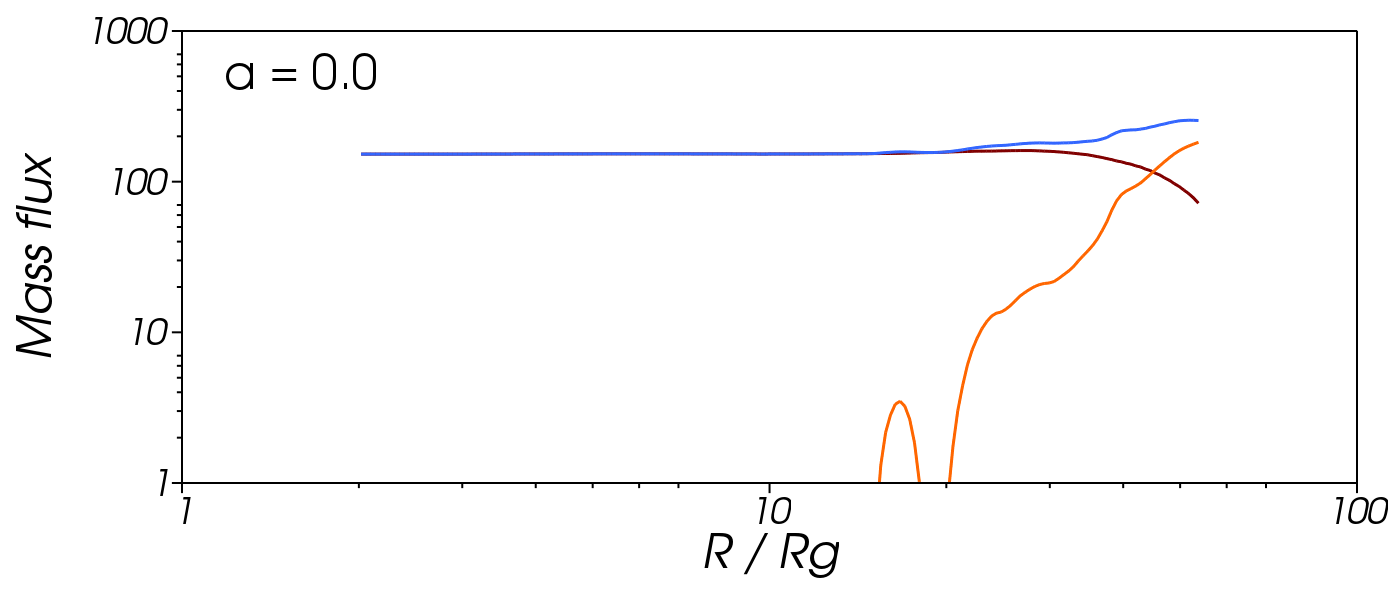
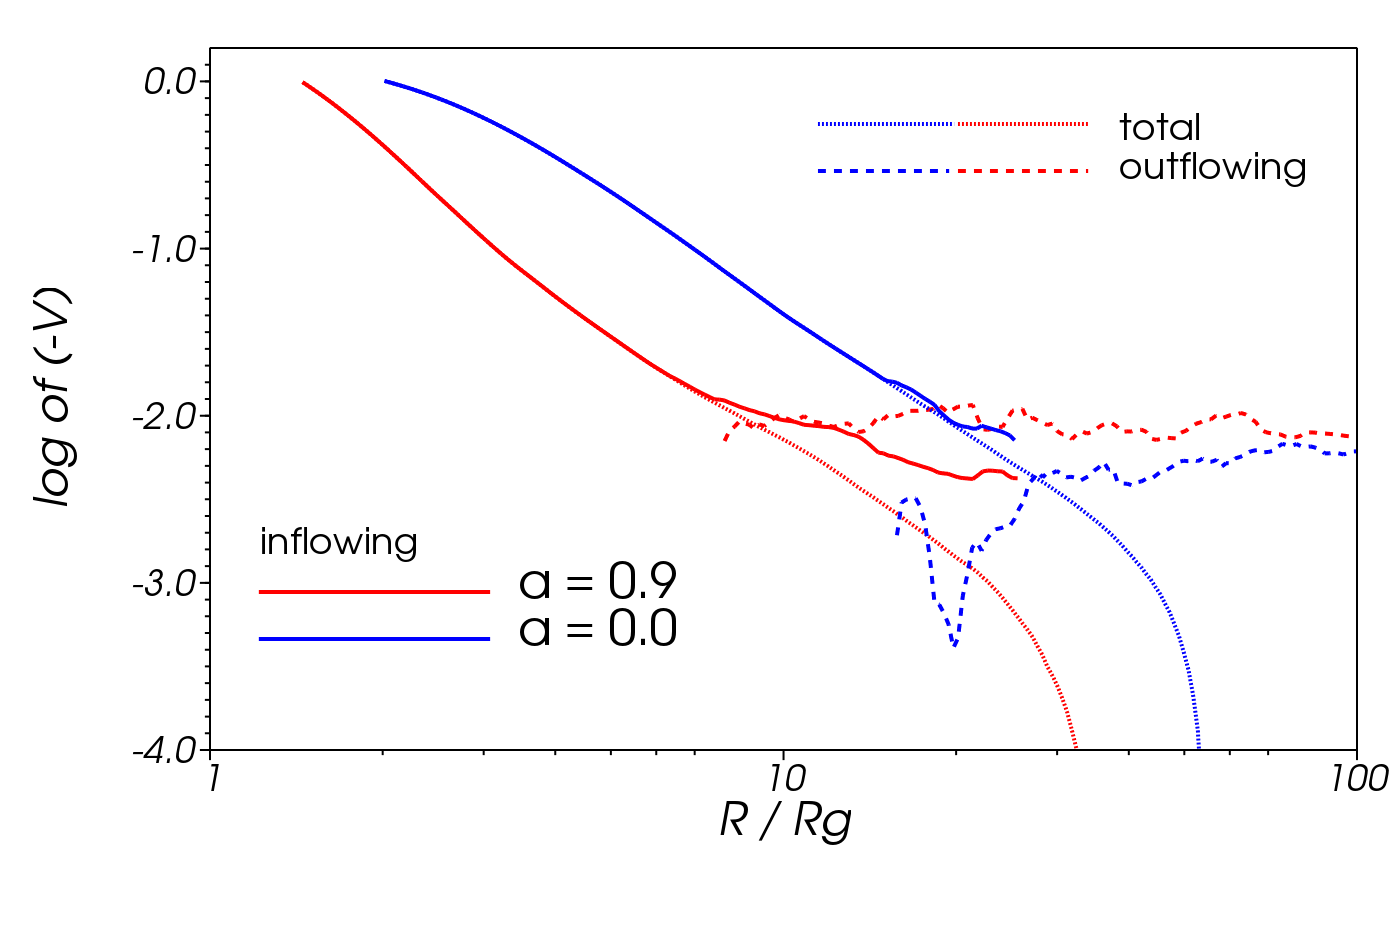
and correspondingly over the inflow and outflow regions to obtain the integrated inflowing and outflowing fluxes, respectively. Fig. 8 shows the radial profiles of integrated rest mass fluxes for (top) and (bottom panel). The fluxes have been rescaled, and their magnitudes are given in Eddington units ().
The red lines in Fig. 8 show the net flux. In steady state it is expected to be constant in radius. In our simulations it keeps a constant value with good accuracy up to which we consider the limit of inflow equilibrium in the bulk of the disk. The average mass flux (accretion rate) is and for and , respectively. The orange lines show the integrated flux of outflowing mass (the outflow accretion rate). The outflows are significant only for the rotating BH – in case of the BH with zero spin, the outflow emerges only around and outside the radius of inflow equilibrium, and therefore is not reliable. For , the outflow starts around and increases with radius following a power-law. Just outside radius the outflowing flux equals the net flux, i.e., two parts flow in, one part flows out. The blue line shows the inflowing accretion rate, i.e., the sum of the two. For our simulation with , the inflowing accretion rate decreases proportionally to the radius in the whole region where outflows are not negligible (). As a specific example, the inflow accretion rate at is . Out of this only reaches radius , and the remaining goes into an outflow. There is negligible outflow inside , so the accretion rate on the BH is .
5.4.2 Radiative flux
The second panel in Fig. 7 shows the energy flux carried by photons, . In the optically thick region it qualitatively follows the distribution of mass flux reflecting the fact that photons are trapped in gas when scattering opacity is large. For this reason, there is no outflow of radiative energy inside the photosphere in simulation. The other run () shows a region of outflowing radiative energy which exactly overlaps with the region of strong mass outflow (top panel). However, the amount of outflowing radiative energy is much smaller than the flux of energy flowing out in the form of rest-mass in the same region. This is because gas temperature, which determines the energy density of trapped photons through the LTE condition () is not relativistic.
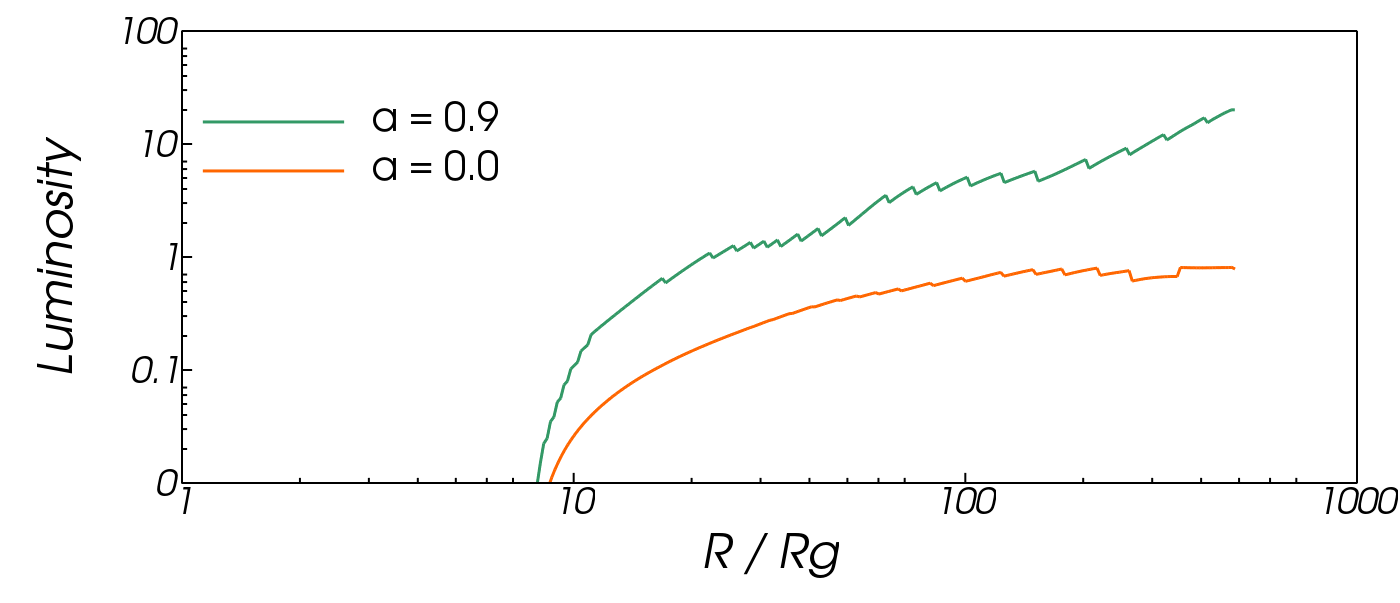
Fig. 9 presents radiative flux of energy integrated over the optically thin funnel, and normalized to the Eddington luminosity,
| (58) |
The green and orange lines correspond to BH spins and , respectively. The luminosity leaving the disk along the polar axis in the optically thin funnel increases with radius reflecting the fact that radiation diffuses into this region from surface layers of the optically thick region. The gas that releases this radiation is located just inside the photosphere, and, for the disk, flows out from the equilibrium region nearest to the BH with relatively high velocity . Therefore, the radiation field in the funnel is in the equilibrium. Near the outer boundary the luminosity carried away by photons in this region is and for and , respectively.
However, most of the radiative flux for flows out trapped in the gas in the optically thick region (see the second panel in Fig. 7). The total radiative luminosity of such trapped photon flux in the outflow region is already at and also increases with radius as a result of gas outflowing from larger radii. It is not clear what fraction of this luminosity can reach the observer. Radiative energy trapped in the gas may contribute to its thermal and kinetic energy before the gas expands enough to become optically thin and release the photons (Poutanen et al., 2007). Therefore, the luminosity in the optically thin region is only the lower limit for the total radiative luminosity of the disk.
5.4.3 Energy flux
The third panel from the top in Fig. 7 shows the flux of MHD energy which includes the rest mass, gravitational, kinetic, and magnetic energies. For the non-rotating BH (left half) no other form of energy is comparable with the rest-mass energy and the distribution of closely resembles that of . The same is true for the rotating BH but only far from the polar axis. In the polar region, on the contrary, the flux of magnetic energy exceeds significantly the rest mass flux. It results from the Poynting flux which fills the polar (jet) region presumably as a consequence of the Blandford & Znajek (1977) process.
Energy flows out as rest-mass, MHD and radiative energy. However, only MHD and radiative energies represent usable energy at infinity. Therefore, the quantity of interest from the point of view of the efficiency of BH feedback is the total energy minus rest-mass energy. We call this quantity “energy available at infinity”, and define its flux as (the plus sign in front of reflects negative signs of the other two components). The bottommost panel in Fig 7 shows the magnitude of this flux averaged over time.
The left half shows results from the non-rotating BH run. The energy is extracted inside the optically thick bulk of the disk. This positive (towards infinity) energy flux results from three factors. Firstly and most importantly, gas looses its angular momentum on the way towards the BH and transfers it outward effectively transporting kinetic energy out. Secondly, gas falling in strong gravitational potential heats up to conserve the total energy. If disk was optically thin, this extra internal energy would fall with the gas on the BH. For optically thick disks, however, gas can cool and the extra energy can be put in the radiation field and diffuse out. Thirdly, the accreting gas was initially slightly bound — the initial torus had a typical relativistic Bernoulli parameter (Narayan et al., 2012a) , and accretion of a bound (negative energy) gas effectively deposits positive energy at infinity. The initial value of the Bernoulli parameter determines the uncertainity of the energy flux estimates.
The structure of the flux of energy available at infinity for the rotating BH is qualitatively different. It is dominated by the flux of magnetic energy flowing out along the polar axis - the jet. The amount of energy transferred in this way exceeds significantly all the contributions discussed above which do not rely on BH rotation. The outflow originates at the BH and apparently extracts its rotational energy through the Blandford-Znajek mechanism.
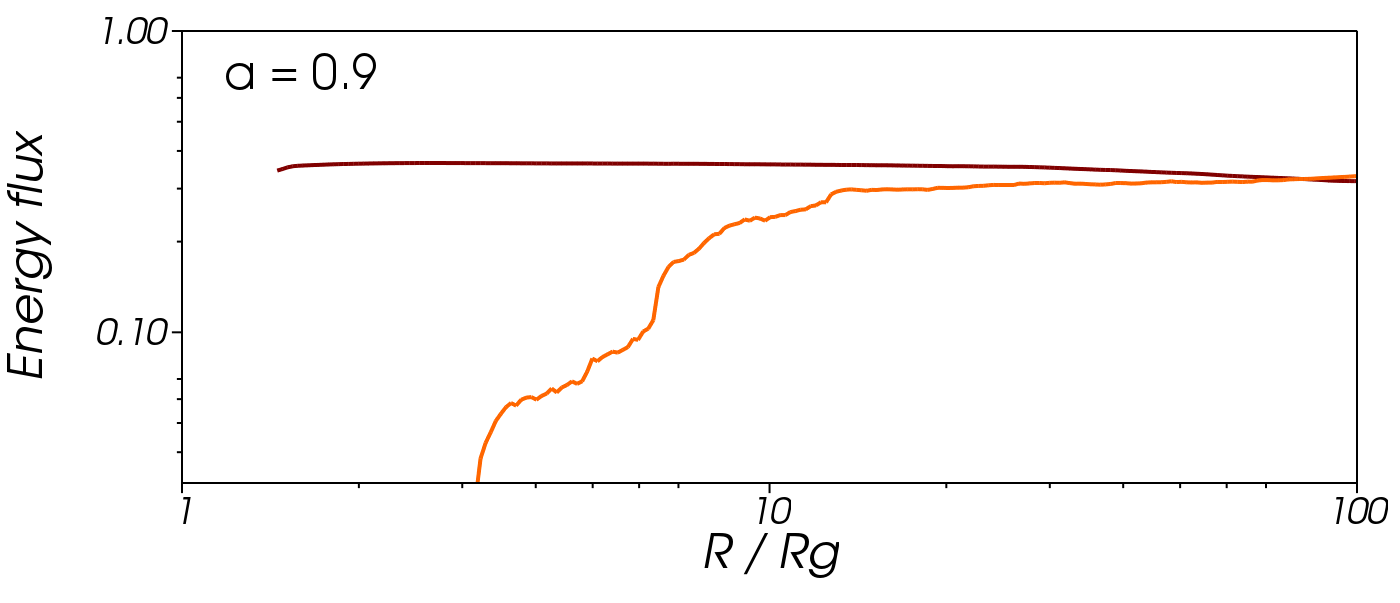
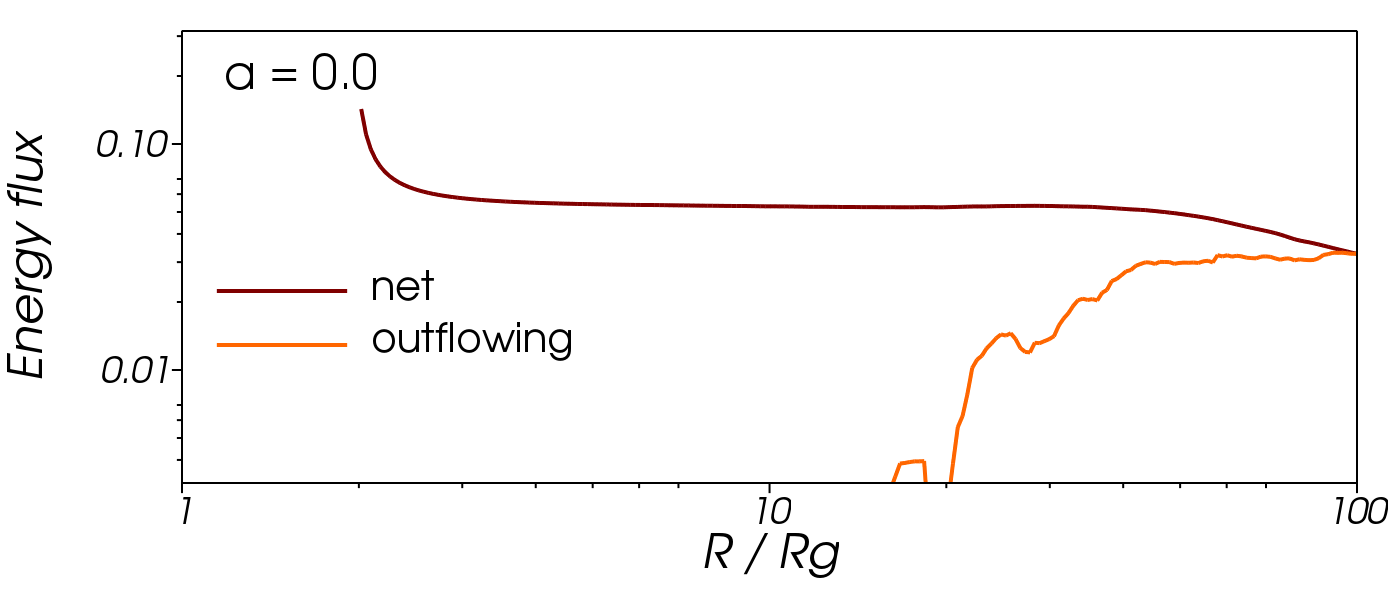
In Fig. 10 we plot fluxes of energy at infinity integrated over spherical surfaces and normalized by the average net rest-mass energy flux (), e.g.,
| (59) |
Red and orange lines correspond to fluxes integrated over the whole surface (net flux) and over the region of outflowing gas, respectively. The net flux is reasonably constant up to indicating the inflow/outflow equilibrium in this region. The departure from constant value near the horizon, most significant for the run, reflects the impact of artificial floors in density imposed there. The amount of energy available at infinity that flows out of the system is roughly and for and runs, respectively. The orange line, denoting the corresponding flux in the region of outflowing gas, is close to the total flux in the outflow region what reflects the fact that the energy carried in by the inflow is small when compared to the energy of the outflow.
Previous works (Tchekhovskoy et al., 2010a, b, 2011; Tchekhovskoy & McKinney, 2012a; Narayan et al., 2010; Penna et al., 2013b; Sa̧dowski et al., 2013b) have analyzed the power of jets produced by rotating BHs in the presence of geometrically thick, optically thin disks and showed that it was consistent with the Blandford-Znajek process which predicts the jet power proportional to the square of magnetic flux at BH horizon, , and increasing with BH spin. The average value of for the simulation within the time window we analyze, i.e., between is (Fig. 6). For such values of the magnetic flux and BH spin the empirical formulae from Sa̧dowski et al. (2013b) predict the total (jet plus wind) amount of energy available at infinity to be , which is close to the value we get in the current simulation. This fact indirectly proves that the jet power comes from the BH rotational energy extracted through the Blandford-Znajek process, and that the presence of radiation hardly modifies the jet properties when compared to optically thin disks.
5.5 1D profiles
In this Section we discuss vertically averaged physical quantities characterizing the flow. We start with the density-weighted angular momentum of gas (Fig. 11),
| (60) |
where stands for the surface density. The blue and red lines correspond to non-rotating and spinning BHs. The dashed lines show corresponding Keplerian angular momentum profiles. For both simulations the angular momentum is sub-Keplerian. In the region outside the ISCO, the angular momentum is on average below the Keplerian value. Close to the BH the angular momentum rapidly drops. It does not mean, however, that there is torque exerted on the gas at the horizon because is not a constant of motion for a magnetized fluid, especially, in the presence of radiation field.
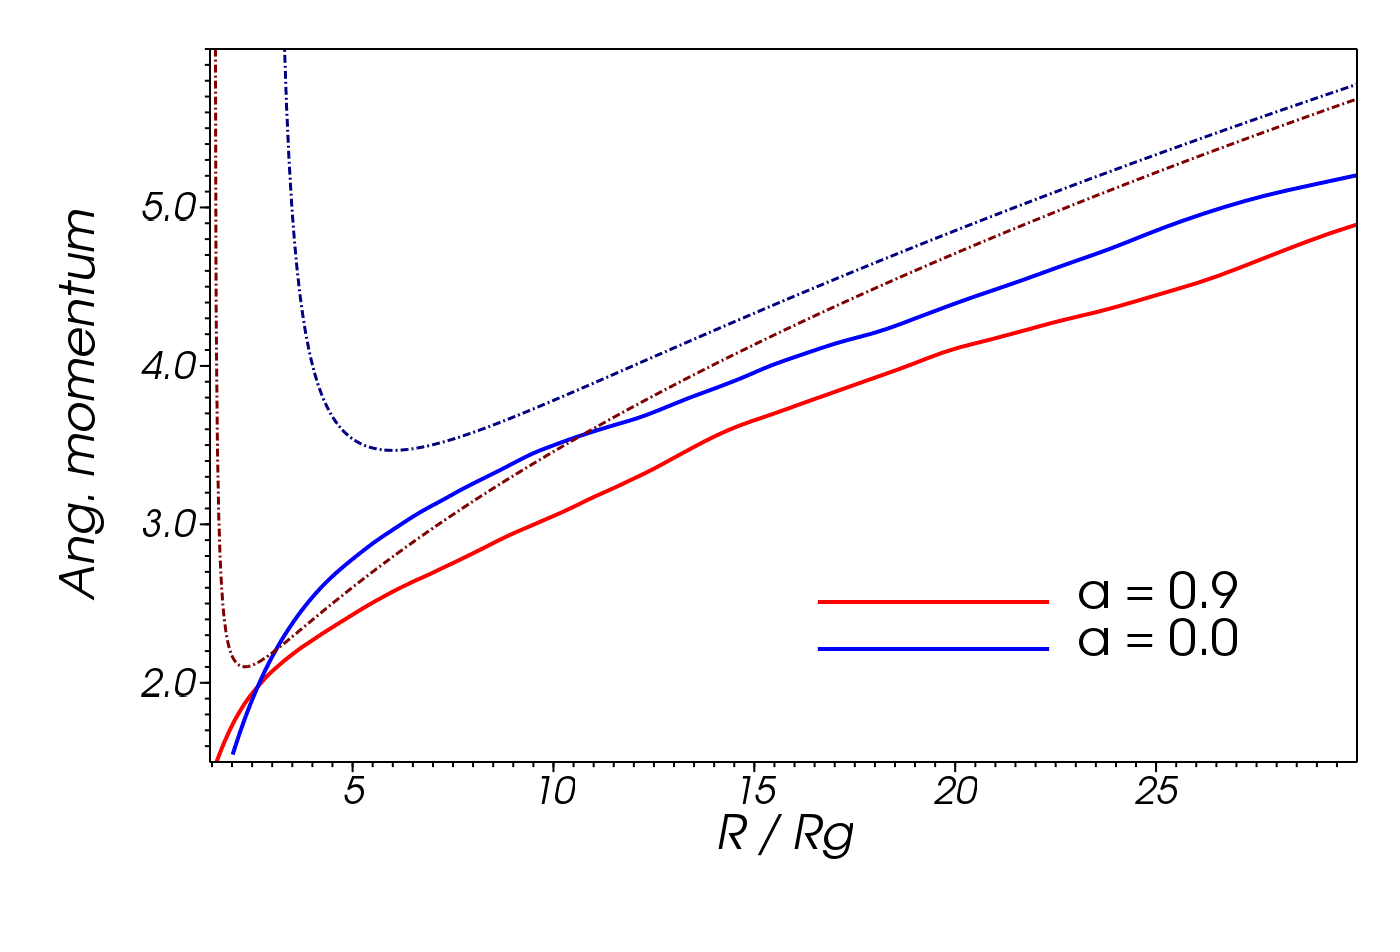
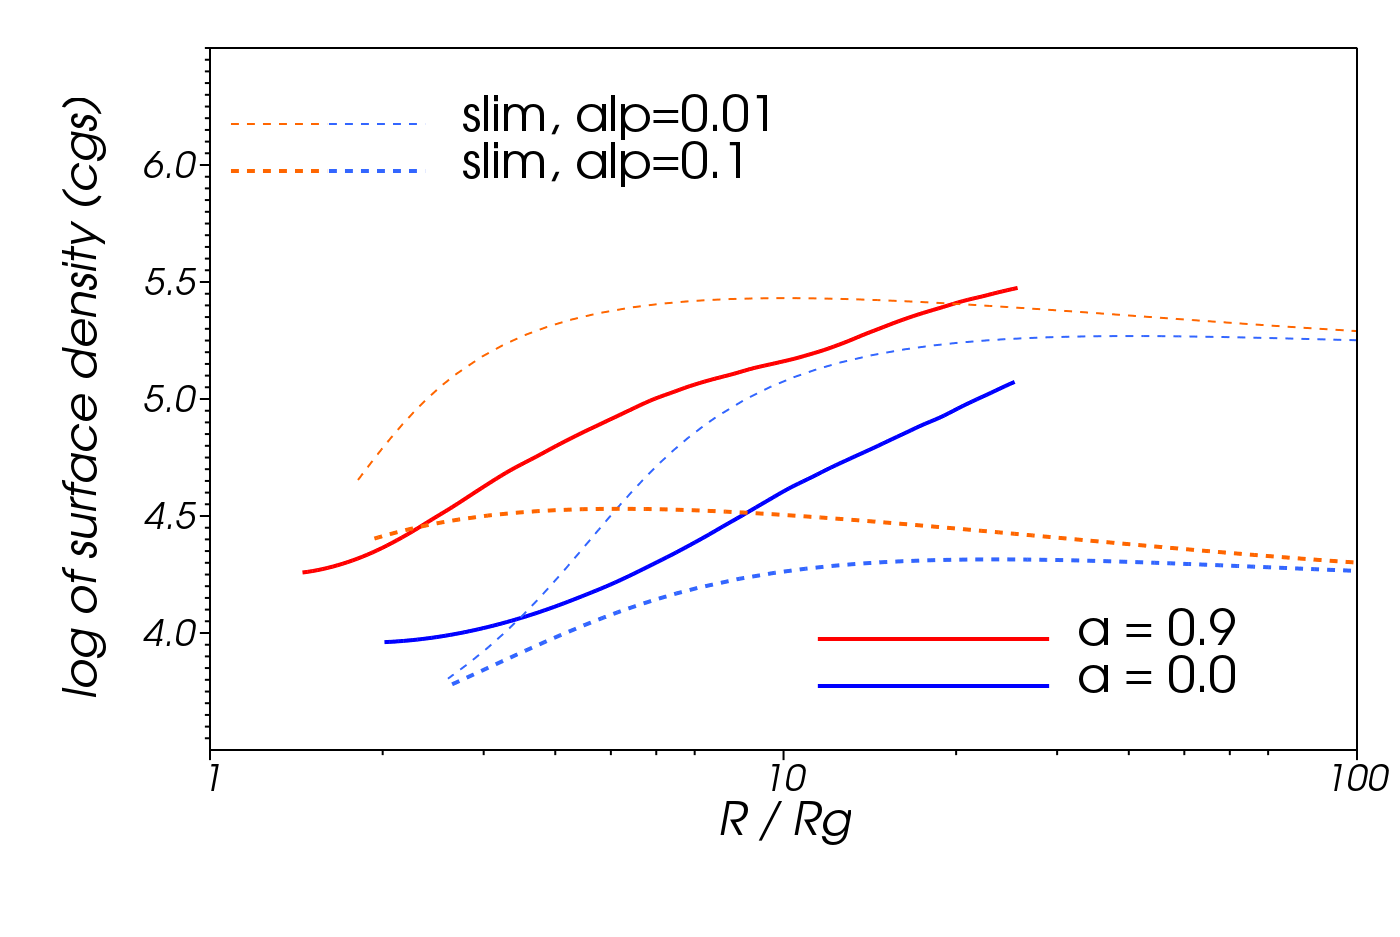
Fig. 12 shows the average surface density, (top), and the average radial velocity as measured by an observer corotating with the fluid (Abramowicz et al., 1995), (bottom panel), given by
| (61) |
where is the density-weighted radial component of contravariant velocity,
| (62) |
We choose to show because it equals at the horizon.
In the top panel we show surface density from the simulation data with thick lines and terminate them at radius corresponding to the extent of the inflow equilibrium in the disk. In addition, we plot surface density profiles from the relativistic slim disk model by Sa̧dowski (2011) for and two values of the viscosity parameter : (thin) and (thick dashed lines). The surface density in our simulations drops monotonically towards the BH reaching near the horizon. The slim disk profiles predict the same order of magnitude of surface density, however its shape is different from the numerical result. This reflects the fact that the slim disk model does not account for the magnetic pressure which is significant in the innermost region and which modifies disk structure and dynamics there.
The radial velocities of the simulated disks are shown in the bottom panel. This time the thick solid line corresponds to the radial velocity averaged over the inflow region (the disk bulk). The dashed and dotted thin lines show velocity profiles for the outflow region and the whole simulation, respectively. The latter roughly follows a single power-law, up to certain radii, and for and , respectively, where the velocity averaged over the whole domain becomes positive due to prevailing outflows emerging from inside this radius — these radii correspond to intersections of the ’net’ and ’outflowing’ curves in Fig. 8. The solid lines correspond to the velocity averaged over the inflow region (the disk bulk). Its profile flattens in the region of non-zero outflows (e.g., for ) and seems to approach slope once outflows are significant. The dashed lines show the average (positive) radial velocity in the outflow region. The outflowing gas is accelerated to relatively uniform radial velocity , similar in order of magnitude to the midly-relativistic winds observed in some AGN (Tombesi et al., 2010a; Tombesi et al., 2010b; Weng et al., 2013).
6 Summary and Discussion
In this paper we have presented a magnetohydrodynamic (MHD) generalization of the GR radiation hydrodynamic code KORAL described in a previous paper (Sa̧dowski et al., 2013a). The code evolves the ideal MHD equations of magnetized gas in a fixed relativistic metric, evolving radiation in parallel as a second fluid that is coupled to the gas via scattering and absorption processes. The radiation fluid is described by the radiative energy density and radiative flux, from which M1 closure enables us to calculate (approximately) all the second moments of the radiation intensity. We have carried out a number of tests and verified that the code correctly treats the dynamics of magnetized gas and handles the coupling between gas and radiation in both the optically thin and optically thick limits.
The M1 closure scheme employed here is approximate in the sense that KORAL does not include any frequency dependence, but instead evolves the frequency integrated radiative energy density and flux, with grey opacities. Nevertheless, this work constitutes a significant improvement over previous work since the version of KORAL described here is capable of evolving magnetized gas and radiation in a GR space-time. In addition, the M1 closure scheme is superior to both Eddington closure and flux-limited diffusion, two approaches generally favored in many previous (non-GR) radiation codes (e.g., Ohsuga et al., 2009; Ohsuga & Mineshige, 2011; Zanotti et al., 2011), though it is not as sophisticated as the (non-GR) variable Eddington tensor approach described in Jiang et al. (2012).
While the primary purpose of this paper is to describe the code and establish its performance, in §5 we present an initial application in the area of black hole accretion. We have performed two axisymmetric simulations of super-critical (i.e., super-Eddington: ) accretion, one corresponding to a non-rotating BH () and one to a rotating BH (). The accretion rates in the two simulations are highly super-Eddington, and , respectively. Both simulations are initialized with a torus of radiation-dominated orbiting gas with a weak poloidal magnetic field. The MRI develops promptly and gas settles quickly into a quasi-steady, geometrically and optically thick, sub-Keplerian, accretion disk. Twin funnels form spontaneously along the polar axis and serve as channels through which gas, magnetic field and radiation escape relativistically. Surrounding the funnel is a more wide-angle, less relativistic, outflow.
Our results for a non-rotating BH are in qualitative agreement with models A in Ohsuga et al. (2009) and Ohsuga & Mineshige (2011), which were simulated using a non-relativistic MHD code with flux-limited diffusion. Detailed comparison is difficult because the accretion rate in those models is (in our units) compared to in the model described here. In the case of our model, there is no previous comparable simulation. Relativity introduces qualitatively new effects for a spinning BH — frame-dragging, Penrose process, BZ effect — which only a GR code can properly explore. Many GRMHD simulations without radiation have been described in the literature (e.g., De Villiers et al., 2003; Gammie et al., 2003; Anninos et al., 2005; Del Zanna et al., 2007; Shafee et al., 2008; Penna et al., 2010; Tchekhovskoy et al., 2010a, b; Narayan et al., 2010; Noble et al., 2011; Tchekhovskoy et al., 2011; Tchekhovskoy & McKinney, 2012a; Narayan et al., 2012b; Sa̧dowski et al., 2013b), and we compare our results to some of that work below. However, there is no previous GRMHD simulation with radiation.
The first, perhaps trivial, result from the simulations reported here is that super-Eddington accretion on to a BH is permitted, and will occur whenever there is adequate mass supply on the outside. The two simulations in this paper were initialized with a large amount of mass in a torus relatively close to the BH with inner edge at . This initial state is probably not dissimilar to what is expected in tidal disruption events, where many models predict super-Eddington accretion with as high as early in the outburst (Krolik & Piran, 2012; Tchekhovskoy et al., 2013).
We find considerable mass loss in the run, as expected for a geometrically thick accretion disks (e.g., Narayan & Yi, 1994, 1995; Blandford & Begelman, 1999; Stone et al., 1999; Stone & Pringle, 2001; Yuan, 2001; Narayan et al., 2012a). On the contrary, the simulation has no significant outflow within the inflow equilibrium radius of . Crudely, it appears that the mass inflow rate in the simulation scales as for and for , with , though we are not confident of the exact value of this index. In any case, for mass injection at a radius of a few tens of gravitational radii, mass loss introduces at most a factor of a few difference between the amount of mass that is supplied and the amount that is accreted. Thus, for tidal disruption events, to a good approximation, most of the gas does end up on the BH.
For accretion from a much larger distance, e.g., a supermassive BH accreting at a highly super-Eddington rate from a surrounding interstellar medium (e.g., Siemiginowska et al., 2010; Netzer & Trakhtenbrot, 2013), or a stellar-mass BH like SS433 hyper-accreting from a companion star (Fabrika, 2004), there could be considerable mass loss via an outflow. From the above scaling, the mass that accretes on the BH is only , where is the mass supply rate at the outer radius . Nevertheless, provided there is a sufficiently large mass supply at the outer radius, which is perhaps not so unlikely early in the life of a gas-rich proto-galaxy at high redshift, super-Eddington accretion should readily occur.
The simulations show that super-critical accretion is radiatively inefficient. Although the accretion rate exceeds the Eddington rate by two orders of magnitude, the photospheric luminosity is only of order a few . At a radial distance of within the funnel, where we believe the results are fairly trustworthy, the radiative luminosity of the model is and that of the model is (Fig. 9). Some additional radiation is likely to be emitted at larger radii in the funnel, and we also expect of order of luminosity to escape from the outer photosphere of the accretion disk itself. But all in all, it appears that the total luminosity is limited to a . Writing the radiative luminosity, , as , this corresponds to , i.e., the flow is radiatively very inefficient. Since the simulations correspond to an advection-dominated regime of accretion, this result is expected.
Nevertheless, one interesting result is the unusually large radiative luminosity emitted through the narrow funnel. Out at , the funnel opening angle (measured out to the photosphere) is only rad, and at it is even smaller rad. Yet the luminosity emitted through the funnels is greater than Eddington and perhaps as much as . Expressed as a radiative flux, the simulated models are thus enormously super-Eddington in the funnels: . This result confirms ideas developed decades ago regarding super-Eddington luminosities in funnels (e.g., Sikora, 1981; Narayan et al., 1983). Relativistic beaming and relativistic gas motions are at least part of the explanation for these large radiative fluxes. In the context of the tidal disruption event Swift J1644+57 (Bloom et al., 2011; Levan et al., 2011; Zauderer et al., 2011; Berger et al., 2012), models usually require very large “isotropic equivalent luminosities” at early times. The present simulations indicate that, for an observer who is favorably placed with respect to the funnel, such luminosities are easily achieved.
The luminosity estimate given above refers only to the radiation in the topically thin region of the funnel. This is the radiation that we can be sure will escape. There is in addition a substantial volume of the optically thick outflow where there is a net outward flux of radiative energy. The corresponding luminosity is about a factor of 10 larger. However, this radiation is trapped in the gas and participates in the overall outflow and expansion of escaping gas. How much of this radiation will finally flow out of the photosphere and how much will be used to do work on the expanding gas is not easy to estimate. Hence we do not include this component of the radiation flux in our luminosity estimates.
We can, however, estimate the total energy loss rate from the system, viz., the quantity (Eq. 59), which measures the combined energy flux to infinity in the form of radiation, magnetic field, and gas thermal and kinetic energy. This energy loss includes energy outflow in both the optically thin and optically thick regions, and is quite substantial. In fact, we see no sign of any “inefficiency” in the overall energy loss rate from the system. The simulation has an energy loss rate equal to 5% of , while the simulation loses energy at 33% of . Surprisingly, these energy outflow efficiencies are quite similar to those estimated for hot non-radiative accretion flows (Tchekhovskoy et al., 2011; Sa̧dowski et al., 2013b). It appears that scalings derived for those systems may be applied also to super-Eddington accretion flows. This result may have large implications for BH feedback in early stages of galaxy formation in the universe.
If the above result is confirmed, it would imply that the jet efficiency is insensitive to whether accretion occurs via a geometrically thick non-radiative hot accretion flow or a geometrically thick radiation-trapped super-Eddington flow. What seems to matter is the BH spin and the magnetic flux around the BH, exactly as expected with the Blandford & Znajek (1977) model. The demonstration in this paper of a BZ-like mechanism is likely operating in the radiation-dominated accretion regime is a new result. In the case of hot accretion flow simulations, recent work has shown that the simulated jets follow the BZ model very well (Penna et al., 2013b) and that the simulations can be understood as a generalized Penrose process (Lasota et al., 2013). This explains how it is possible for jet efficiencies to exceed 100% in some cases (Tchekhovskoy et al., 2011). A similar demonstration in the case of radiation-dominated accretion flows would be very worthwhile.
In the context of hot accretion flows, the above work of Tchekhovskoy et al. (2011) has revived interest in the magnetically arrested disk (MAD) model, in which a very strong magnetic field accumulates around the BH and disrupts the accretion flow. MAD systems produce extremely powerful jets because of the very strong magnetic field around the BH. Both the simulations described in the present paper reach the MAD limit – at a time of for and for . Beyond this point, these axisymmetric simulations cannot be trusted since the MAD regime corresponds to intrinsically non-axisymmetric flows. Future 3D radiation GRMHD simulations can explore this regime. For now, what can be said is that the MAD regime appears to be as easy to achieve in super-Eddington flows as in low- hot accretion flows. This again has implications for jet power and AGN feedback.
7 Acknowledgements
We thank Juri Poutanen for useful discussions. RN and AS were supported in part by NASA grant NNX11AE16G. We acknowledge NSF support via XSEDE resources under grant numbers TG-AST080026N (RN and AS) and TG-AST100040 (AT), and NASA support via High-End Computing (HEC) Program through the NASA Advanced Supercomputing (NAS) Division at Ames Research Center (AS and RN). AT was supported by a Princeton Center for Theoretical Science Fellowship and by NASA through the Einstein Fellowship Program, grant PF3-140115.
References
- Abramowicz et al. (2010) Abramowicz, M. A., Jaroszyński, M., Kato, S., Lasota, J.-P., Różańska, A., & Sa̧dowski, A. 2010, Astronomy & Astrophysics, 521, A15
- Abramowicz et al. (1995) Abramowicz, M. A., Chen, X.-M., Kato, S., Lasota, J.-P., & Regev, O. 1995, Astrophysical Journal, 438, L37
- Abramowicz et al. (1988) Abramowicz, M. A., Czerny, B., Lasota, J. P., & Szuszkiewicz, E. 1988, Astrophysical Journal, 332, 646
- Anninos et al. (2005) Anninos, P., Fragile, P. C., & Salmonson, J. D. 2005, Cosmos++: Relativistic Magnetohydrodynamics on Unstructured Grids with Local Adaptive Refinement, Astrophysical Journal, 635, 723
- Begelman (1978) Begelman, M. C. 1978, Monthly Notices of the Royal Astronomical Society, 184, 53
- Berger et al. (2012) Berger, E., Zauderer, A., Pooley, G. G., Soderberg, A. M., Sari, R., Brunthaler, A., & Bietenholz, M. F. 2012, Astrophysical Journal, 748, 36
- Blandford & Begelman (1999) Blandford, R. D., & Begelman, M. C. 1999, Monthly Notices of the Royal Astronomical Society, 303, L1
- Blandford & Znajek (1977) Blandford, R. D., & Znajek, R. L. 1977, Monthly Notices of the Royal Astronomical Society, 179, 433
- Bloom et al. (2011) Bloom, J. S., Giannios, D., Metzger, B. D., Cenko, S. B., Perley, D. A., Butler, N. R., Tanvir, N. R., Levan, A. J., et al. 2011, Science, 333, 203
- Del Zanna et al. (2007) Del Zanna, L., Zanotti, O., Bucciantini, N., & Londrillo, P. 2007, Astronomy & Astrophysics, 473, 11
- De Villiers et al. (2003) De Villiers, J.-P., Hawley, J. F., & Krolik, J. H. 2003, Astrophysical Journal, 599, 1238
- Dexter & Fragile (2011) Dexter, J., & Fragile, P. C. 2011, Astrophysical Journal, 730, 36
- Fabrika (2004) Fabrika, S. 2004, Astrophysics and Space Physics Reviews, 12, 1
- Gammie et al. (2003) Gammie, C. F., McKinney, J. C., & Tóth, G. 2003, Astrophysical Journal, 589, 444
- Hawley et al. (2011) Hawley, J. F., Guan, X., & Krolik, J. H. 2011, Astrophysical Journal, 738, 84
- Igumenshchev et al. (2003) Igumenshchev, I. V., Narayan, R., & Abramowicz, M. A. 2003, Astrophysical Journal, 592, 1042
- Jiang et al. (2012) Jiang, Y.-F., Stone, J. M., & Davis, S. W. 2012, Astrophysical Journal Suppl. Ser., 199, 14
- Komissarov (1999) Komissarov, S. S. 1999, Monthly Notices of the Royal Astronomical Society, 303, 343
- Krolik & Piran (2012) Krolik, J. H., & Piran, T. 2012, Astrophysical Journal, 749, 92
- Lasota et al. (2013) Lasota, J.-P., Gourgoulhon, E., Abramowicz, M., Tchekhovskoy, A., & Narayan, R. 2013, arXiv:1310.7499
- Levan et al. (2011) Levan A. J., Tanvir N. R., Cenko S. B., Perley D. A., Wiersema K., Bloom J. S., Fruchter A. S., Postigo A. d. U., et al. 2011, Science, 333, 199
- Levermore (1984) Levermore, C. D. 1984, Journal of Quantitative Spectroscopy and Radiative Transfer, 31, 149
- McKinney et al. (2012) McKinney, J. C., Tchekhovskoy, A., & Blandford, R. D. 2012, Monthly Notices of the Royal Astronomical Society, 423, 3083
- McKinney et al. (2013) McKinney, J. C., Narayan, R., Sa̧dowski, A., & Tchekhovskoy, A. 2013, Monthly Notices of the Royal Astronomical Society, submitted
- Mihalas & Mihalas (1984) Mihalas, D., & Mihalas, B. W. 1984, New York, Oxford University Press, 1984, 731 p.,
- Narayan et al. (1983) Narayan, R., Nityananda, R., & Wiita, P. J. 1983, Monthly Notices of the Royal Astronomical Society, 205, 1103
- Narayan et al. (2012a) Narayan, R., SÄ dowski, A., Penna, R. F., & Kulkarni, A. K. 2012a, Monthly Notices of the Royal Astronomical Society, 426, 3241
- Narayan & McClintock (2008) Narayan, R., & McClintock, J. E. 2008, New Astronomy Reviews, 51, 733
- Narayan et al. (2012b) Narayan, R., Sa̧dowski, A., Penna, R. F., & Kulkarni, A. K. 2012b, Monthly Notices of the Royal Astronomical Society, 426, 3241
- Narayan et al. (2010) Narayan, R., Tchekhovskoy, A., & McKinney, J. 2010, Accretion and Ejection in AGN: a Global View, ASPC, 427, 127
- Narayan & Yi (1994) Narayan, R., & Yi, I. 1994, Astrophysical Journal Letters, 428, L13
- Narayan & Yi (1995) Narayan, R., & Yi, I. 1995, Astrophysical Journal, 452, 710
- Netzer & Trakhtenbrot (2013) Netzer, H., & Trakhtenbrot, B. 2013, MNRAS, accepted, arXiv:1311.4215
- Noble et al. (2006) Noble, S. C., Gammie, C. F., McKinney, J. C., & Del Zanna, L. 2006, Astrophysical Journal, 641, 626
- Noble et al. (2011) Noble, S. C., Krolik, J. H., Schnittman, J. D., & Hawley, J. F. 2011, Astrophysical Journal, 743, 115
- Novikov & Thorne (1973) Novikov, I. D., & Thorne, K. S. 1973, Black Holes (Les Astres Occlus), 343
- Ohsuga et al. (2009) Ohsuga, K., Mineshige, S., Mori, M., & Yoshiaki, K. 2009, Publications of the Astronomical Society of Japan, 61, L7
- Ohsuga & Mineshige (2011) Ohsuga, K., & Mineshige, S. 2011, Astrophysical Journal, 736, 2
- Orszag & Tang (1979) Orszag, S. A., & Tang, C.-M. 1979, Journal of Fluid Mechanics, 90, 129
- Penna et al. (2010) Penna, R. F., McKinney, J. C., Narayan, R., Tchekhovskoy, A., Shafee, R., and McClintock, J. E. 2010, Monthly Notices of the Royal Astronomical Society, 408, 752–782
- Penna et al. (2013c) Penna, R. F., Kulkarni, A., & Narayan, R. 2013c, arXiv:1309.3680
- Penna et al. (2013a) Penna, R. F., Sa̧dowski, A., Kulkarni, A. K., & Narayan, R. 2013a, Monthly Notices of the Royal Astronomical Society, 428, 2255
- Penna et al. (2013b) Penna, R. F., Narayan, R., & Sa̧dowski, A. 2013b, Monthly Notices of the Royal Astronomical Society, 2531
- Poutanen et al. (2007) Poutanen, J., Lipunova, G., Fabrika, S., Butkevich, A. G., & Abolmasov, P. 2007, Monthly Notices of the Royal Astronomical Society, 377, 1187
- Remillard & McClintock (2006) Remillard, R. A., & McClintock, J. E. 2006, ARAA, 44, 49
- Rybicki & Lightman (1979) Rybicki, G. B., & Lightman, A. P. 1979, New York, Wiley-Interscience, 1979. 393 p.,
- Ryu & Jones (1995) Ryu, D., & Jones, T. W. 1995, Astrophysical Journal, 442, 228
- Sa̧dowski (2011) Sa̧dowski, A. 2011, Ph.D. Thesis, Nicolaus Copernicus Astronomical Center, Polish Academy of Sciences, arXiv:1108.0396
- Sa̧dowski et al. (2013a) Sa̧dowski, A., Narayan, R., Tchekhovskoy, A., & Zhu, Y. 2013a, Monthly Notices of the Royal Astronomical Society, 429, 3533
- Sa̧dowski et al. (2013b) Sa̧dowski, A., Narayan, R., Penna, R., & Zhu, Y. 2013b, MNRAS, accepted, arXiv:1307.1143
- Shafee et al. (2008) Shafee, R., McKinney, J. C., Narayan, R., Tchekhovskoy, A., Gammie, C. F., and McClintock, J. E. 2008, ApjL, 687, L25–L28
- Shakura & Sunyaev (1973) Shakura, N. I., & Sunyaev, R. A. 1973, A&A, 24, 337
- Shcherbakov et al. (2010) Shcherbakov, R. V., Penna, R. F., & McKinney, J. C. 2010, arXiv:1007.4832
- Shibata & Sekiguchi (2012) Shibata, M., & Sekiguchi, Y. 2012, Progress of Theoretical Physics, 127, 535
- Siemiginowska et al. (2010) Siemiginowska, A., Burke, D. J., Aldcroft, T. L., et al. 2010, Astrophysical Journal, 722, 102
- Sikora (1981) Sikora, M. 1981, Monthly Notices of the Royal Astronomical Society, 196, 257
- Stone et al. (2008) Stone, J. M., Gardiner, T. A., Teuben, P., Hawley, J. F., & Simon, J. B. 2008, Astrophysical Journal Suppl. Ser., 178, 137
- Stone et al. (1999) Stone, J. M., Pringle, J. E., & Begelman, M. C. 1999, Monthly Notices of the Royal Astronomical Society, 310, 1002
- Stone & Pringle (2001) Stone, J. M., & Pringle, J. E. 2001, Monthly Notices of the Royal Astronomical Society, 322, 461
- Takahashi & Ohsuga (2013) Takahashi, H. R., & Ohsuga, K. 2013, Astrophysical Journal, 772, 127
- Tóth (2000) Tóth, G. 2000, Journal of Computational Physics, 161, 605
- Tchekhovskoy et al. (2010a) Tchekhovskoy, A., Narayan, R., and McKinney, J. C. 2010a, Astrophysical Journal, 711, 50–63
- Tchekhovskoy et al. (2010b) Tchekhovskoy, A., Narayan, R., and McKinney, J. C. 2010b, New Astron., 15, 749–754
- Tchekhovskoy et al. (2011) Tchekhovskoy, A., Narayan, R., and McKinney, J. C. 2011, Monthly Notices of the Royal Astronomical Society, 418, L79–L83
- Tchekhovskoy & McKinney (2012a) Tchekhovskoy, A., & McKinney, J. C. 2012a, Monthly Notices of the Royal Astronomical Society, 423, L55
- Tchekhovskoy et al. (2012b) Tchekhovskoy, A., McKinney, J. C., & Narayan, R. 2012b, Journal of Physics Conference Series, 372, 012040
- Tchekhovskoy et al. (2013) Tchekhovskoy, A., Metzger, B. D., Giannios, D., & Kelley, L. Z. 2013, arXiv:1301.1982
- Tombesi et al. (2010a) Tombesi, F., Cappi, M., Reeves, J. N., Palumbo, G. G. C., Yaqoob, T., Braito, V., & Dadina, M. 2010a, Astronomy & Astrophysics, 521, A57
- Tombesi et al. (2010b) Tombesi, F., Sambruna, R. M., Reeves, J. N., Braito, V., Ballo, L., Gofford, J., Cappi, M., & Mushotzky, R. F. 2010b, Astrophysical Journal, 719, 700
- Weng et al. (2013) Weng, S.-S., Zhang, S.-N., & Zhao, H.-H. 2013, ApJ, accepted, arXiv:1311.5030
- Yuan (2001) Yuan, F. 2001, Monthly Notices of the Royal Astronomical Society, 324, 119
- Yuan, Bu, & Wu (2012) Yuan, F., Bu, D., & Wu, M. 2012, Astrophysical Journal, 761, 130
- Yuan & Narayan (2014) Yuan, F. & Narayan, R. 2014, Annual Reviews, submitted
- Zanotti et al. (2011) Zanotti, O., Roedig, C., Rezzolla, L., & Del Zanna, L. 2011, Monthly Notices of the Royal Astronomical Society, 417, 2899
- Zauderer et al. (2011) Zauderer, B. A., Berger, E., Soderberg, A. M., Loeb, A., Narayan, R., Frail, D. A., Petitpas, G. R., Brunthaler, A., et al. 2011, Nature, 476, 425
Appendix A Radiative shock near the polar axis
At the onset of the simulations, the radiative flux supporting the torus against the effective gravity starts to escape through the photosphere and to fill the empty space outside it. This radiation has a non-zero angular component of the net flux coming from the torus rotation (radiation is emitted isotropically in the comoving frame of optically thick gas). It initially reaches the polar axis, and then starts to interact with radiation emitted from the other side of the torus. Effectively, the emitted radiation converge towards the axis. The M1 scheme assumes the specific intensity is symmetric with respect to the net flux. Therefore, it cannot mix colliding beams of light properly. In the case of torus radiation interacting near the polar axis, its horizontal component of flux vanishes as a result of superposition of oppositely oriented beams. The sub-dominant vertical component sums up, as well as the azimuthal component. The resulting specific intensity follows the net flux which is dominated by the azimuthal component. It turns out that it is so collimated along that the radiation does not reach the polar axis.
This effect is shown in the top panel of Fig. 13 which presents the radiative energy density in the comoving frame () at an early () stage of the simulation. Contours show the total optical depth (white contour corresponds to ), and the arrows denote the magnitude and direction of the radiation rest frame velocity on the poloidal plane (large velocities correspond to a highly collimated radiation in optically thin region). The red region is the optically thick torus and reflects high energy density of trapped radiation. The light blue region in the middle is the disk optically thin atmosphere filled with radiation emerging from the torus surface and propagating away from the midplane. The dark blue region nearest to the polar axis is not accessible for the torus radiation because of the effect described above. At the border, a strong discontinuity in forms, and the polar region is filled with residual radiation coming from near the outer edge.
This unphysical configuration takes place only in the initial stage. Once MRI develops and torus is turbulent, it adjusts to the equlibrium solution: it extends down to the BH, the photosphere moves closer to the polar axis, and the rotation becomes sub-Keplerian. As the bottom panel shows, such a configuration allows the radiation to reach the axis, and the discontinuity disappeares. Therefore, the artificial radiation shock is not affecting the results described in this paper (still, the radiation distribution in the atmosphere is only qualitatively right because of approximate nature of any closure scheme). However, accretion disks with lower accretion rates, which rotate faster and have photosphere further out from the polar axis, will likely produce such artificial discontinuities. We will tackle this problem in a forthcoming paper.
