High-Resolution Near Infrared Spectroscopy of HD 100546: II. Analysis of variable rovibrational CO emission lines
Abstract
We present observations of rovibrational CO in HD 100546 from four epochs spanning January 2003 through December 2010. We show that the equivalent widths of the CO lines vary during this time period with the v=1-0 CO lines brightening more than the UV fluoresced lines from the higher vibrational states. While the spectroastrometric signal of the hot band lines remains constant during this period, the spectroastrometric signal of the v=1–0 lines varies substantially. At all epochs, the spectroastrometric signals of the UV fluoresced lines are consistent with the signal one would expect from gas in an axisymmetric disk. In 2003, the spectroastrometric signal of the v=1-0 P26 line was symmetric and consistent with emission from an axisymmetric disk. However, in 2006, there was no spatial offset of the signal detected on the red side of the profile, and in 2010, the spectroastrometric offset was yet more strongly reduced toward zero velocity. A model is presented that can explain the evolution of the equivalent width of the v=1-0 P26 line and its spectroastrometric signal by adding to the system a compact source of CO emission that orbits the star near the inner edge of the disk. We hypothesize that such emission may arise from a circumplanetary disk orbiting a gas giant planet near the inner edge of the circumstellar disk. We discuss how this idea can be tested observationally and be distinguished from an alternative interpretation of random fluctuations in the disk emission.
Subject headings:
stars: circumstellar matter, individual (HD 100546), protoplanetary disks1. INTRODUCTION
High-resolution near-infrared spectroscopy of rovibrational CO emission provides unparalleled views of gas in the inner disk around young stars (e.g. Najita et al., 1996, 2000, 2003, 2007a; Carr et al., 2001; Blake & Boogert, 2004; Brittain et al., 2003, 2007; Goto et al., 2006; Pontoppidan et al., 2008, 2011; Salyk et al., 2009; Herczeg et al., 2011). Such observations serve as a surrogate for direct imaging of this spatially unresolved region by spectrally resolving the rotationally broadened emission lines. If the stellar mass and disk inclination are known, the spatial extent of the gas in Keplerian orbit can be inferred from the kinematic profile of the line. Additional information about the spatial extent of the gas can be inferred by modeling the excitation.
In optically thick disks, the emission lines are formed in the warm optically thin atmosphere of the disk. If the gas in the atmosphere has a density of nH 1012 cm-3 and temperature of order 1000 K, the population of v 1 vibrational levels excited by collisions can be significant and give rise to rovibrational emission lines. Such emission is commonly observed from the inner few AU of optically thick disks around classical T Tauri stars (e.g. Najita et al., 2003; Salyk et al., 2011, 2009) and Herbig Ae/Be stars (e.g. Blake & Boogert, 2004; Brittain et al., 2007). In addition to collisional excitation, a source with a strong ultraviolet continuum can fluoresce the gas (Brittain et al., 2007, 2009). In the case of CO, the strongest electronic transitions fall near 1500 Å. When CO is excited electronically, the molecule relaxes to the ground electronic state and populates excited vibrational levels. Molecules in these states give rise to hot band rovibrational emission lines (v=1 v) such that the vibrational temperature of the gas reflects the diluted color temperature of the ultraviolet radiation field (Krotkov et al., 1980). The oscillator strength of the rovibrational transitions are a few 105 weaker than the oscillator strengths of the electronic transitions. Thus the infrared rovibrational emission lines that arise from the electronic excitation of CO lines are optically thin.
Curiously, the line luminosity of sources dominated by collisional excitation is comparable to that of sources dominated by UV fluoresced gas (e.g. Brittain et al. 2003). Thus the CO emitting area of sources dominated by UV fluorescence must be much larger than that of sources dominated by emission from collisionally excited gas. Indeed, rovibrational CO emission arising from UV fluorescence is observed to extend to 100 AU (e.g. HD 141569, Goto et al. 2006, Brittain et al. 2007; HD 100546, van der Plas et al. 2009, Brittain et al. 2009; HD 97048, van der Plas et al. 2009; Oph IRS 48, Brown et al. 2012), whereas collisionally excited CO arises from a much smaller area (from radii within AU in T Tauri disks).
In addition to modeling the spectral line profile and excitation of the gas, information about the spatial distribution of the gas can be determined using spectroastrometry (Whelan & Garcia, 2008). Spectroastrometry is a relatively new technique that takes advantage of high-resolution spectrometers with excellent imaging quality (Bailey et al. 1998; Takami et al. 2001; Takami et al. 2003; Acke & van den Ancker 2006; Pontoppidan et al. 2008, 2011; Brittain et al. 2009; van der Plas et al. 2009). The projected velocity of gas in a rotating disk varies as a function of distance from the star and orbital phase. Regions of common projected velocity map out extended loop-like structures. Thus the centroid of the point spread function of each velocity channel of a resolved emission line formed in the disk is offset from the position of the star. By simultaneously fitting the kinematic line profile and spectroastrometric signature of the line, one can provide an independent constraint on the stellar mass and disk inclination (Pontoppidan et al. 2008) and identify non-Keplerian emission signatures (e.g. Pontoppidan et al., 2011).
HD 100546 (catalog ) - a nearby 10 Myr, 2.4 M☉, isolated Herbig Be star (HBe; B9Ve) - is a particularly exciting source to which to apply this new tool. HD 100546 has been well studied because of its proximity to our Solar System (d=103 pc; van den Ancker 1997). The mass of dust in the disk is assuming that the dust is 50K and optically thin (Henning et al. 1998). While the absolute mass of the gas in the disk is not known, it is a rich source of molecular emission lines (Panić et al. 2010; Sturm et al. 2010; Thi et al. 2011; Bruderer et al. 2012; Liskowsky et al. 2012). Indeed, Bruderer et al. (2012) model the rotational emission line spectrum of CO and find that the high-J lines (e.g. J=30-29) originate from 20-50 AU, while the mid-J lines (e.g. J=16-15) arise mainly from 40-90 AU. HD 100546 is also a transition object - a star whose disk is optically thin in the inner region and optically thick in the outer region. The optically thin inner region of the disk extends to 10 AU (Bouwman et al. 2003; Grady et al. 2005) and is devoid of CO and OH inward of this radius (van der Plas et al. 2009; Brittain et al. 2009; Liskowsky et al. 2012); however, there is evidence of residual atomic gas (O I) in the inner region (Acke & van den Ancker 2006) and ongoing stellar accretion (Guimarães et al. 2006).
As described in Brittain et al. (2009), measurement of the half width at zero intensity (HWZI) of the emission lines indicates that the rovibrational CO emission extends into 136 AU. The vibrational temperature (6000 K) is higher than the rotational temperature of the gas (1000 K), the tell tale signature of UV fluoresced gas. The 13CO lines and 12CO lines from v2 were shown to be populated by UV fluorescence while the 12CO v=1–0 lines were shown to be excited by a combination of UV fluorescence and collisional excitation. Both 12CO and 13CO lines are excited over a column that corresponds to in the UV transitions that induce the fluorescence. This translates into a physical column that is much larger for 13CO than 12CO due to its much lower abundance. The optically thin gas is warm and can populate v′=1 collisionally as well. However, the ratio of this contribution scales with the relative abundance of the two isotopologues such that the collisional contribution to the 12CO lines is nearly two orders of magnitude larger than the collisional contribution to the 13CO lines. The line profile and flux was reproduced by assuming the emitting gas extends from 13-100 AU (Brittain et al., 2009).
In this paper we present multi epoch high resolution rovibrational CO emission line spectra of HD 100546 (catalog ) and compare the spectra taken in four epochs. In a companion paper (Liskowsky et al. 2012; hereinafter Paper I), we considered the rovibrational OH emission and rovibrational CO hot band emission from HD100546. Here we complement Paper I by focusing on the interpretation of the CO v=1–0 emission. We show that the equivalent width, line profile, and spectro-astrometric signal of the CO emission lines vary over the nearly eight year span of our observations. We model the spectro-astrometric signature of the emission lines and discuss the possibilities for the origin of this variability.
2. Observations
We acquired high-resolution (R=50,000), near-infrared spectra of HD 100546 on January 14, 2006, December 21-22, 2008, and December 23, 2010 using PHOENIX at the Gemini South telescope (Hinkle et al., 2003, 2000, 1998). The 4 pixel slit (0″.34) was used for all observations. HD 100546 was acquired by first taking a -band image and centering the star near the nominal position of the center of the slit. Next an -band image was acquired with the slit in the beam. Then the slit was taken out and a series of short exposures were taken. The telescope was moved a few arcseconds and another series of images were taken. These images were differenced and the position of the star was determined. The telescope was then moved so that the star was centered on the slit. In addition to the data we have taken, the spectrum acquired on January 7, 2003 was taken from the archive. The data were also acquired with the 0.34 slit providing a resolution of R=50,000. The acquisition procedure is not recorded, but it is likely the standard procedure described above was followed.
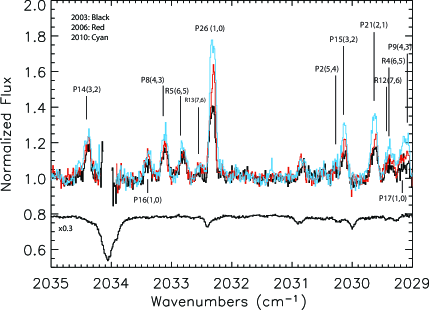
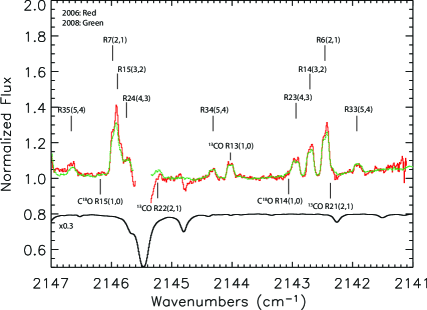
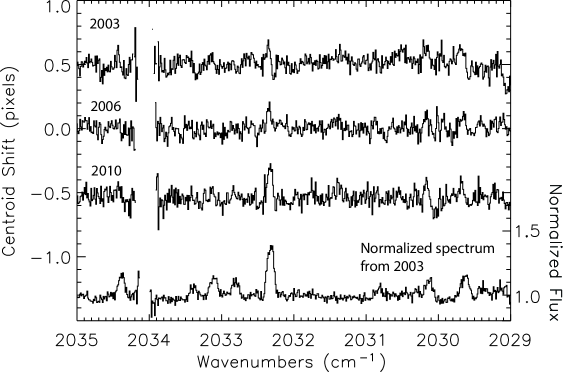
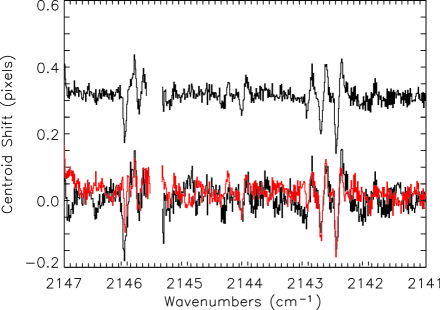
Observations centered near 2034 cm-1 were acquired in 2003, 2006, and 2010 to cover the v=1–0 P26 line (hereafter we will refer to this transition as P26) and numerous hot band lines. Observations centered near 2144 cm-1 were acquired in 2006 and 2008. The spectra overlap from 2029 cm-1 to 2035 cm-1 (Fig. 1) and from 2141 cm-1 and 2147 cm-1 (Fig. 2). The observations made in 2006 have been presented in Brittain et al. (2009). The other observations have not been reported previously.
The seeing in the -band during these epochs ranged from 0.4-0.8 and the airmass of the observations ranged from 1.3-1.6. A summary of observations is presented in Table 1. Most of the data were taken with the slit in its default position angle of 90 east of north (all position angles quoted in this paper are measured east of north unless otherwise noted) with the exception of the observations acquired in 2008. These observations were taken with the slit rotated to 37 and 127 - near the apparent semi-minor and semi-major axes respectively, i.e., along the semi-minor and semi-major axes as projected on the sky. An antiparallel observation near the apparent semi-major axis (PA=307°) was acquired as well.
Observations in the -band are dominated by a strong thermal background. Therefore, an ABBA nod pattern between two positions separated by is used to cancel the thermal continuum to first order. The extent of the CO emission is 0.7 in each direction (Brittain et al. 2009), thus there is no contamination between the beams. The scans are flat fielded, cleaned of hot and dead pixels, including cosmic ray hits, and then combined in the sequence (ABBA2)/2. Because the spectra are curved along the detector, they are first rectified by finding the centroid of the point spread function (PSF) in each column. A third degree polynomial was fit to the centroids and used to determine the shift of each column to a common row.
In principle, the spectra can also be tilted along the slit. To check this, we compared the sky emission spectrum at the bottom of the slit to the spectrum at the top of the slit. The offset was less than half of a pixel along the length of the slit. A sky emission spectrum generated by the Spectral Synthesis Program (Kunde & Maguire, 1974), which accesses the 2000HITRAN molecular database (Rothman et al., 2003) was used to measure the shift of each row. A first degree polynomial was fit to the central wavenumber of each row to measure the shift. Each row was then rectified in the spectral direction.
To capture all of the CO emission, a 2 window was extracted to generate the one-dimensional spectrum. The wavelength calibration was achieved by fitting an atmospheric transmittance model generated by the Spectral Synthesis Program. Each spectrum is then ratioed to a standard star observed at a similar airmass to remove telluric absorption lines. Areas where the transmittance is below 50% are omitted (Figs. 1 & 2).
3. Results
3.1. Spectral line comparison
The spectra observed in 2003, 2006, and 2010 overlap from 2029 cm-1 to 2035 cm-1 (Fig. 1) and the spectra observed in 2006 and 2008 overlap from 2141 cm-1 to 2147 cm-1 (Fig. 2). In each spectrum, 12CO emission lines arising from the upper vibrational levels v′=1,2,3, 4, 5, and 6 are detected. 13CO emission lines arising from the upper vibrational levels v′=1 & 2 are also detected. The radial velocity of the source we infer from the Doppler shift of the hot band emission lines is v☉=+161 km s-1 which we take to be the system velocity. This is consistent with the radial velocity of the gas giving rise to the rotational CO lines observed at millimeter wavelengths (Panić et al. 2010) and optical atomic lines (Acke et al. 2005).
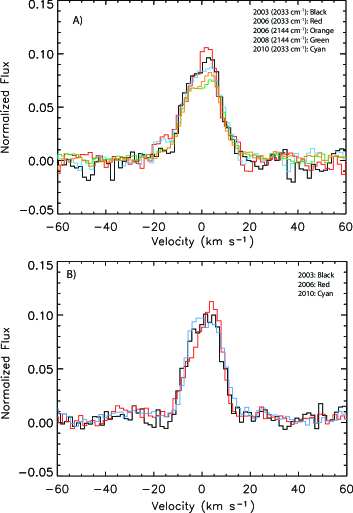
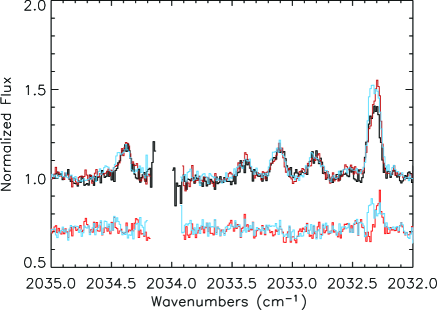
Line Asymmetry. To enhance the signal to noise of the weaker line profiles, we have averaged the unblended lines whose excitation is dominated by UV fluorescence in each order on each date (Table 2). Figure 3a shows the resulting average normalized profiles of lines in the orders centered on 2033 cm-1 and 2144 cm-1. We find that there is a persistent asymmetry in the lines. The profile of the stronger P26 line is also asymmetric, but in contrast to the hot band lines, the shape of the line varies considerably (Fig. 3b).
To quantify the asymmetry we compare the ratio of the red side of the line (from v=0 km s-1 to +5 km s-1) to the blue side of the line (from v=0 km s-1 to 5 km s-1). This “asymmetry ratio” for the UV fluoresced lines is 1.1, with the exception of the average line profile of the lines observed near 2033 cm-1 in 2006. The asymmetry ratio for these lines is 1.18 on this date (Fig. 3a). The asymmetry of the P26 line flips from 2003 to 2010. The asymmetry ratio of the line is 1.06, 1.37, and 0.97 in 2003, 2006, and 2010 respectively (Fig. 3b).
The red excess seen in the average of the hot-band emission lines is the opposite of what is observed for the rovibrational OH emission from this source. As shown in Paper I, the OH line shows a prominent blue excess that can be explained if the OH arises from an annular inner rim with an eccentricity of 0.18. In Paper I, we also show that we can fit the average profile of the UV fluoresced CO lines reasonably well if most of the CO comes from the outer circular disk rather than the eccentric inner rim.
The asymmetry of the hot band lines also varies with vibrational level. Close inspection of the spectrum centered near 2144 cm-1 reveals that the v=2–1 R6 line is more asymmetric than the v=3–2 R14 line (though there is a weak contribution on the red wing of the v=2–1 R6 line from the 13CO v=2–1 R21 line). The asymmetry of the v=3–2 R14 line is larger than that of the v=4–3 R23 line, and the v=4–3, v=5–4 and 13CO lines are symmetric. The origin of this trend is not entirely clear. One possibility is that the relative contribution of the eccentric inner rim to the emission lines is not uniform across the observed vibrational levels. In our modeling we found that we needed to add a collisional component to our model to fit the v=1–0 lines. It is possible that this collisional component also contributes some to the v=2–1 and v=3–2 lines. For CO in LTE at a temperature of 1400 K, the population of v′=2 and v′=3 relative to v′=1 is 10% and 1% respectively. To test this possibility, high signal to noise spectra of CO across a broad range of energy levels in a single epoch is necessary and is the subject of ongoing analysis.
Equivalent Width Variation. As shown in Figures 1 and 2, the equivalent width of the CO lines varied over the span of the observations. The average equivalent width of the hot band lines increased by a factor of 1.140.12 from 2003 to 2006, whereas the P26 line brightened by a factor of 1.440.06. From 2006 to 2008, the hot band lines dimmed by a factor of .930.03. From 2003 to 2010, the hot band lines brightened by a factor of 1.530.13 and the P26 line brightened by a factor of 2.180.07 (Table 3).
Generally, the equivalent width variation of emission lines can be due to a varying line luminosity or a varying continuum. The line luminosity of the rovibrational CO hot band lines resulting from UV fluorescence depends on the FUV luminosity of the source, the flaring of the disk, and velocity dispersion of the gas. In the far ultraviolet (FUV) spectrum of HD100546, acquired with the in 1993 and 1995 (Grady et al. 1997), the continuum varied by less than 5% over this timespan. Thus, the FUV continuum does not appear to be variable on time scales of two years and it is unlikely that disk flaring and velocity dispersion of the gas would vary globally by 50% over the span of our observations. We therefore conclude that it is unlikely that the flux of the UV fluoresced CO lines varies as dramatically as indicated by the variation in the equivalent width.
It seems more likely that the fluctuation of the equivalent width of the hot band CO lines is due to a varying -band continuum. This would imply that the -band flux has varied by 0.4 mag over a span of eight years. Morales-Calderón et al. (2011) find that about 5% of class II young stars in Orion showed variation in the band mag over a 40 day span. Similarly, Muzerolle et al. (2009) find that the transitional disk LRLL 31 varied by as much as 30% over time periods as short as a week. Espaillat et al. (2011) find similar results for a sample of 14 transitional and pre-transitional T Tauri stars.
We can assess the degree of the NIR variability of HD 100546 by comparing the relative magnitude of the acquisition images of HD 100546 and the telluric standards. We do not have -band acquisition images of our targets on all dates, but we can gain some insight into the degree of variability by comparing the images we do have.
In 2003 and 2010, we imaged HD 100546 and standards in a narrow-band filter in the -band. These images show that HD 100546 was 0.50.15 mag fainter in the -band in 2010 compared to 2003. In 2008, -band acquisition images of HD 100546 and HR 4798 allowing us to estimate that =3.82 mag. This is consistent with the reported -band magnitude reported in the literature (=3.80; Malfait et al. 1998). In 2010, we estimate the -band magnitude was 4.92. This is 50% fainter than the reported brightness between 1988 and 1992 (=4.08; Malfait et al. 1998).
In summary, HD 100546 was 0.5mag fainter in the -band in 2010 than in 2003, similar to the change in the -band required to explain the change in the equivalent width of the hot band CO lines between these two epochs. In addition, HD 100546 was 0.84mag fainter in the -band in 2010 than in 1990. While not conclusive, these measurements do suggest that known variations in the infrared continuum in HD 100546 are sufficient to explain the variation in the equivalent width of the hot band CO lines.
The origin of the variability is uncertain. Modeling of the SED indicates that the majority of the NIR flux arises from small grains in the inner 1 AU of the disk. These are possibly formed by the grinding of planetesimals in this inner region. (Bouwman et al. 2003). It is plausible that the variability is due to the variation of the abundance of small grains in this region.
3.2. Spectro-astrometric analysis
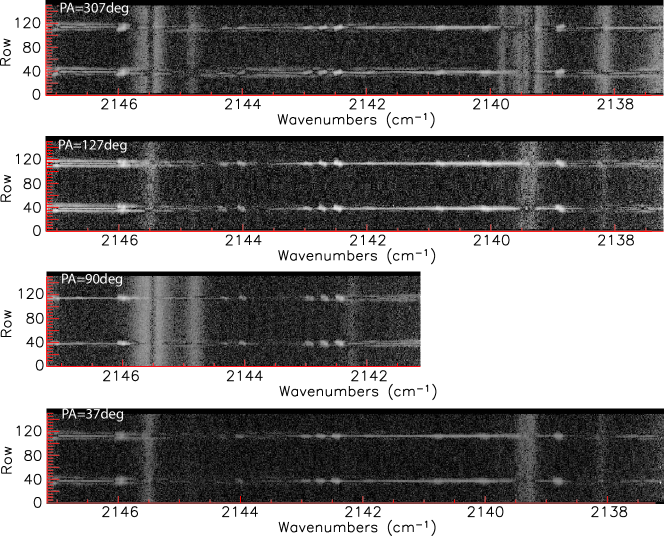
In addition to comparing the spectral profile and equivalent width of the lines, we can also compare the spatial distribution of the emission by making spectro-astrometric measurements of our data. The large angular extent of the rovibrational CO emission from HD 100546 (1.5; Brittain et al. 2009) is an asset in this regard. In a spectroastrometric measurement, when the slit of the spectrograph is aligned with the apparent semi-major axis of an inclined, intrinsically circular disk, the spatial centroid of the redshifted and blueshifted sides of the line will be spatially offset. When the slit is aligned with the apparent semi-minor axis of the disk, the center of the redshifted and blueshifted sides of the disk will be centered on the PSF. We present continuum subtracted images of our spectra centered near 2144 cm-1 for four slit PAs. These position velocity diagrams show the extension of the emission lines shift with the rotation of the slit (Fig 4).
To measure the spectro-astrometric signal of the CO emission lines, we follow the method outlined by Pontoppidan et al. (2008). The spatial center of light of the continuum is determined by averaging the columns of the spectrum that show no emission features or absorption lines whose transmittance is less than 50%. The centroid of this average continuum PSF is used as the fiducial center of light of the system along the slit, .
For each column of the spectrum, the centroid of the PSF is measured,
| (1) |
For a given column designated by , the vertical position of a pixel in a given row is designated and is its flux. is the correction factor for the fraction of the PSF excluded from the window over which the signal is calculated. For each column of the spectrum, we measure the centroid of the flux within the FWHM, so we multiply by a correction factor of 1.25 to account for the missing flux (Pontoppidan et al., 2008). The shift of the centroid is measured in pixels, and each pixel subtends 0.085.
The center of light of a particular velocity channel of the spectrum depends on both the spatial extent of the line emission and the fraction of light that is extended (in other words the line to continuum ratio). Since we are measuring the spatial displacement of the line + continuum, a large continuum flux will dilute the spatial displacement of the line emission. We account for this when we calculate the spectro-astrometric signals from our spectral synthesis code by including the continuum (see section 3.3 for further details). A summary of of our investigation of potential sources of artifacts is presented in the appendix.
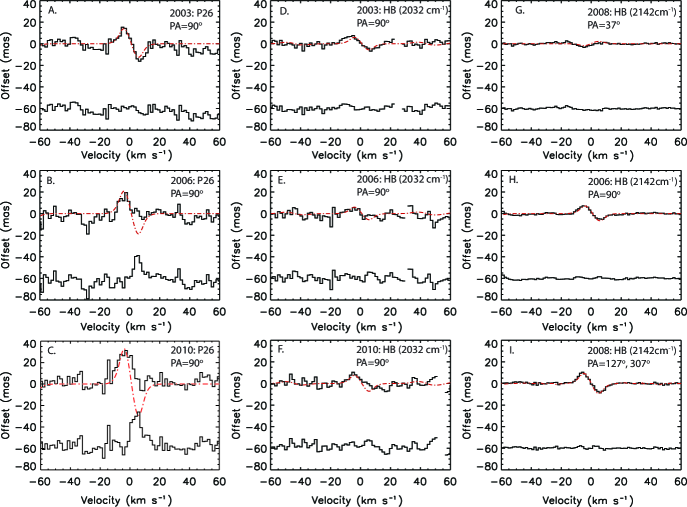
The data collected in 2003, 2006, and 2010 were not optimized for spectroastrometry, thus only the brightest line shows a significant signal in our data (Fig. 5). The star was observed in the default position angle of the instrument (PA=90°east of north) while the apparent position angle of the disk is 138°4°(Quanz et al. 2011). The data acquired in December 2008 were observed with the slit turned to 37, 127, and 307 . The standard deviation of our measurement of the centroid of the continuum ranges from 1.9-4.5 milliarcseconds in these epochs (Table 1).
In 2003, the center of light of the PSF of the columns containing the P26 line was offset relative to the centroid of columns only containing continuum by as much as 15 (Fig. 6a). The average shift of the columns containing hot band lines was also detected and was offset by as much as 7 (Fig. 6d). The relatively symmetric offset (in one spatial direction for the red side of the profile and the opposite spatial direction for the blue side of the profile) is expected for gas arising from an axisymmetric rotating disk (Pontoppidan et al. 2008).
In 2006, we detect the offset of the blue side of the P26 line (Fig. 6b), but we do not have the sensitivity to measure the offset of the hot band lines near 2034 cm-1 (Fig. 6e). We do however measure the spectro-astrometric offset of the hot band lines observed near 2144 cm-1 on the same night (Fig. 6h). The spectro-astrometric signal of the lines is consistent with gas in a axisymmetric Keplerian orbit, consistent with the interpretation given for these features in Paper I.
In 2008, we re-observed HD 100546 centered at 2144 cm-1, however, the slit was aligned near the apparent semi-major axis and apparent semi-minor axis rather than in the default position of 90 (Fig. 6g, i; Fig. 7). The average center of light of the hot band emission lines showed a very small offset (a maximum of 2.10.8 mas across the line) when the slit was nearly aligned with the apparent semi-minor axis (Fig. 6g) and a much larger offset (a maximum of 9.60.7 mas across the line) when the slit was aligned near the apparent semi-major axis (Fig. 6i).
Finally, a brief follow up observation of the P26 line was acquired in December 2010 with the slit in the default 90 position angle (Fig. 6c). As in 2006, the hot band lines revealed the tell tale offset of gas in a rotating axisymmetric disk while the P26 line only showed an offset on the blue side of the line. Curiously, the offset of the blue side of the line was only modestly larger than the offset observed in 2003 even though the line to continuum contrast had more than doubled. The minimal spatial extent of the red side of the P26 line in 2006 and 2010 is indicative of non-axisymmetric structure in the disk.
3.3. Calculation of spectro-astrometric signals from spectral synthesis
In order to facilitate the interpretation of the spectro-astrometric measurements of the CO emission lines, we calculate the spectro-astrometric signal of the lines generated by our modeling of the CO emission (Brittain et al. 2009). We model the excitation of CO in a flared, axisymmetric disk with a cleared inner region (within 13 AU) that is illuminated by the ultraviolet flux from the central star (M⋆=2.40.1M☉; van den Ancker et al. 1997). The disk is assumed to be in Keplerian rotation with an inclination of 47 and a position angle of 138, parameters that we adopt based on the recent Polarimetric Differential Imagery of HD 100546 (Quanz et al. 2011; see also Pantin et al. 2000; Augereau et al. 2001; Grady et al. 2001; Liu et al. 2003; Leinert et al. 2004; Ardila et al. 2007).
As in our 2009 paper, the temperature of the gas is described by the power-law , and the CO is excited by a combination of UV fluorescence and collisions with hydrogen. The UV flux enters the flared disk at a relatively shallow angle (5 in the inner region and increasing to 10 at 100 AU) that is calculated assuming the disk is in hydrostatic equilibrium, vertically isothermal, and the scale height of the gas is set by the temperature described by the power law above. The inner edge of the disk has a scale height of 3.5AU (Bouwman et al. 2003) and is normal to flux arriving from the star, thus a disproportionate amount of the flux arises from this inner rim (15%). The amount of CO emission arising beyond 100 AU is insignificant, consistent with the spatial extent of the emission we observe.
Previously, we found that the v=1–0 CO lines calculated by our model were too weak if we entirely ignored collisional excitation. By adding in collisions with hydrogen we found that we could reproduce the line profiles and line fluxes with this model by adopting a density distribution of . While the v=1–0 lines were weaker in the 2003 data than in the 2006 data set, we found that we still could not entirely ignore collisional excitation and found that we could reproduce the v=1–0 lines by adopting a hydrogen density described by a power-law with a slightly lower fiducial density, .
To obtain the spectro-astrometric signal from this model, we record the line luminosity, projected velocity, orbital phase, and projected distance from the star of every resolution element in the disk. The shift of the centroid of the PSF is then computed for the position angle of the observation. As shown by the model results, the spectroastrometric measurement of the P26 line observed in 2003 and the hot band lines in all epochs is consistent with gas in an axisymmetric disk (Fig 6a, d-i). The spectro-astrometric signals of the P26 line observed in 2006 and 2010 are not (Fig. 6b and c). The red side of the spectro-astrometric signals from the P26 line observed in 2006 and 2010 is not extended.
In principle, this could be caused by two effects. Either the redshifted disk emission at large radii has gone away or extra redshifted emission has arisen such that the center of light has shifted towards the center of the PSF. If the former had occurred, the low velocity emission on the red side of the emission line should have decreased in strength which is not observed. Rather, the equivalent width of the emission line has increased significantly relative to the increase of the fluoresced lines. If excess emission is instead the cause, the excess emission must be non-axisymmetric in order to decrease the extent of the red side of the spectro-astrometric signal. If we use a simple prescription to place the spectra on a flux scale, the excess emission can be attributed to a point source located near the star, as we show in the next section.
3.4. Modeling the variations of the spectro-astrometric signals
In section 3.1 we concluded that the most likely explanation for the changes in the equivalent widths of the UV fluoresced lines is the variation of the continuum. We therefore assume that the fluxes of the UV fluoresced lines are constant and scale the continuum subtracted spectra so that the UV fluoresced lines match. With this scaling, there is an increase in the flux of the P26 line in 2006 and 2010 relative to the 2003 spectrum. We also showed in section 3.3 that the spectro-astrometric signal from both the P26 line and the UV fluoresced lines in 2003 can be reproduced by emission from an axisymmetric disk (Fig. 6a). We therefore adopt the 2003 data as the fiducial spectrum of the disk emission.
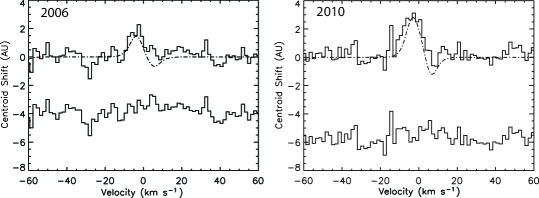
To examine whether the excess P26 line emission can account for the variation of spectro-astrometric signals observed in 2006 and 2010, we subtract the scaled 2003 spectrum from the scaled 2006 and 2010 spectra. The difference spectra shown in Figure 8 show the excess emission that results. The excess v=1–0 emission observed in 2006 is redshifted +6 1 km s-1 with respect to the system velocity and is singly peaked. The excess v=10 emission observed in 2010 is shifted 1 1 km s-1 with respect to the system velocity and is double peaked.
If we assume that the continuum in 2003 was erg/s/cm2/cm-1 (based on the M-band magnitude (Malfait et al. 1998), the flux of the P26 line was 6.810-14 erg s-1 cm-2 and the excess emission of the P26 line during the 2006 and 2010 observations was (a 22% increase) and (a 43% increase) respectively. These fluxes are comparable to the fluxes of the P26 lines observed in classical T Tauri stars in Taurus (Najita et al. 2003). The increase of the scaled equivalent width of the P26 line, the Doppler shift of the excess emission, and the FWHM of the excess emission are summarized in Table 4.
If the CO that produces the excess P26 line emission has a temperature of 1400 K, an intrinsic line width of 3 km s-1, and =1, its emitting area is 0.1AU2. The absolute flux calibration is uncertain, but this analysis provides a rough idea of the scale of the emitting area.
We model this extra source of emission as a point source, placing it near the inner edge of the disk (13 AU) and giving the emission lines a shape similar to the residual (approximated as a Gaussian in 2006 and double Gaussian in 2010; Fig. 8). The FWHM of the synthetic Gaussian line used to approximate the excess flux in 2006 is 6 km s-1, its Doppler shift is +6 km s-1, and its flux is . The synthetic double Gaussian line used to approximate the excess flux in 2010 has a FWHM of 12 km s-1, a Doppler shift of km s-1, and flux of .
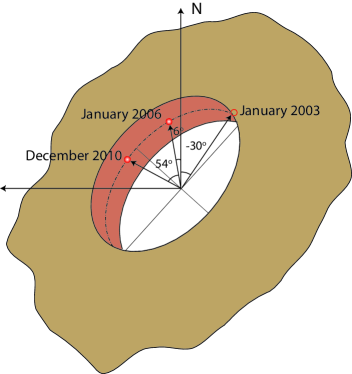
If the excess arises from a source in a circular Keplerian orbit around the star that is coplanar with the disk, then to obtain the observed velocity centroid, the source of the excess emission would be located 6 east of north in 2006. Five years later, December 2010, the position of the excess emission is 54 east of north (Fig. 9). We also find that the position angle of the source of the emission in 2003 would be east of north- just hidden from view by the large inner wall of the disk. Adding the excess flux to our model at these phases and velocities and recalculating the spectro-astrometric signal, we find that we reproduce the observed signal (Fig. 10).
4. Discussion
What physical entity could be responsible for this excess CO v=1–0 emission that varies in velocity centroid, velocity width, and emission strength? One possibility is that the excess CO emission we see, arises from random fluctuations in the disk. Fluctuations of this kind may arise from the magnetorotational instability (Balbus & Hawley 1991, 1998; Hawley & Balbus 1991). In driving turbulence (and angular momentum transport) in disks, the instability is believed to produce fluctuations in density (e.g., as shown in detailed MHD simulations such as Flock et al. 2011), as well as disk height and localized heating around current sheets (Hirose & Turner 2011). These effects may cause significant spatial inhomogeneities in the CO emission from the disk which would also vary with time. Detailed theoretical models are needed to explore this possibility.
If fluctuations of this kind are responsible for the time varying CO emission profile and spectro-astrometric signature that we observe in HD 100546, future CO observations of this source would not be expected to show coherent velocity structure, e.g., such as that arising from orbital motion. If they arise from the effects of disk turbulence, further observations of variations in the CO emission from disks may help to provide evidence for, or constrain the nature of, disk turbulence.
Another possibility is that the excess emission observed in 2006 and 2010 arises from substructure in the disk induced by the presence of an embedded companion. Clarke & Armitage (2003) have discussed the possibility that a gas giant planet forming in the disk around an FU Orionis object would result in non-axisymmetric circumstellar CO emission as material accreted onto the planet at a very high rate. Perhaps a similar result could arise from a forming gas giant planet in the transitional disk surrounding HD 100546.
Substructure in the HD 100546 disk has been reported by Quanz et al. (2011) based on polarimetric differential imaging in and at 0.1 resolution. Their data, acquired in April 2006 (about 3 months after our 2006 data were acquired) reveal a deficit (what they call a “hole”) in the polarized flux and fractional polarization in both bands at 0 east of north (see their figure 11), i.e., at the same position angle at which we posit an excess source of CO emission based on our 2006 data (Fig. 9). Quanz et al. (2011) locate their “hole” at a radius of 27 AU from the star, further away than the inner radius of the disk. While they note that it is difficult to determine whether their deficit is due to a lack of scatterers (dust grains) or a change in the scattering properties of grains at this position, they discuss how such a feature might be created as a shadow of a planet forming at smaller radii (Jang-Condell 2009), as one interpretation of their results.
There are a number of other lines of circumstantial evidence that suggest HD 100546 harbors a substellar companion. Firstly, transition disk SEDs such as the one associated with HD 100546 can be formed in response to dynamical sculpting by an embedded planet (e.g. Skrutskie et al. 1990; Marsh & Mahoney 1992; Bryden et al. 1999; Calvet et al. 2002; Rice et al. 2003; Quillen et al. 2004; D’Alessio et al. 2005; Calvet et al. 2005; Furlan et al. 2006). Indeed Kraus & Ireland (2012) have recently presented what may be the first images of a forming gas giant embedded in the transitional disk surrounding LkCa 15. Modeling of the SED led Bouwman et al. (2003) to suggest that the transitional nature of HD 100546 may indicate the presence of a companion with a mass 5.6 MJupiter.
Secondly, Grady et al. (2005) used long slit images acquired with the on the to map the inner edge of the disk. These authors found that the radius of the inner hole was 133 AU. They also noted that the star was offset from the center of the inner hole of the disk by 5 AU to the northeast. They concluded that such an offset was most readily explained by tidal interactions with an unseen massive companion. Similarly, in Paper I we measured rovibrational OH emission from the system and found that the observed asymmetry in the emission lines could be explained if the OH emission arose from a narrow annulus with at the inner edge of the disk. Such eccentricities are predicted to result from planet disk interactions (Papaloizou et al. 2001; Kley et al. 2006; Regály et al. 2010).
Thirdly, evidence for a massive companion comes from the radial distribution of gas in the inner disk. The molecular gas is truncated at the same radius as the dust (Brittain et al., 2009; van der Plas et al., 2009). The suppression of the flow of material from the outer disk to the inner disk is expected if the clearing of the inner disk is due to an embedded companion (e.g. Lubow & D’Angelo 2006). However, the companion is not massive enough to shut off accretion from the outer disk: the inner disk appears to be filled with O I (Acke & van den Ancker, 2006) and HD 100546 shows high velocity redshifted Balmer absorption lines indicative of ongoing stellar accretion (Guimarães et al., 2006). Finally, the generation of small dust grains in the innermost part of the disk may be indicative of dynamical stirring as may be expected with the presence of a massive companion (Benisty et al., 2010).
How might an embedded companion give rise to the observed CO emission variability? One possibility is that the emission arises from a circumplanetary disk. Models of gas giant formation indicate that during the gas accretion phase, a circumplanetary disk roughly a third the size of the Hill sphere forms (Quillen & Trilling 1998; Ayliffe & Bate 2009ab; Martin & Lubow 2011a). For a 5MJupiter planet forming 13 AU from a 2.4M☉ star, this corresponds to a disk radius of 0.4AU. CO emission from only a fraction of this area () is needed to account for the flux excess we observe (sec. 3.3). The narrow line profile of the excess CO line in 2006 (Figure 8, lower spectrum in red) is readily explained if the line originates in a relatively isothermal disk. In this case, the emission will be dominated by the outer disk which has an orbital velocity of 3 km s-1 at 0.3 AU. The excess in the CO line in 2010 (Fig 8, lower spectrum in cyan) is different from that in 2006: it is broader and double-peaked. If these excesses arise in a disk, the difference in the profiles suggests that there was a significant change in the disk radial structure between these two epochs.
Circumplanetary disks are indeed expected to undergo outbursts (e.g. Martin & Lubow 2011b; see also Zhu, Hartmann, & Gammie 2009 and Armitage, Livio, & Pringle 2001). Martin & Lubow (2011b) describe how circumplanetary disks may undergo accretion in a non-steady state fashion through gravo-magneto instabilities. In other words, as the circumplanetary disk fills by accretion from the circumstellar disk, the surface density may rise sufficiently that the gravitational instability is triggered and the disk accretes vigorously onto the planet. Eventually the surface density drops sufficiently that a magneto-rotational instability may drive accretion. It is conceivable that the change in the line profile is a consequence of the changing emitting area as the disk fills and empties. For example, an impulsive accretion event may heat the inner disk relative to the outer disk, producing a line profile that emphasizes smaller radii and larger rotational velocities. This would lead to a broader line profile and likely a larger line flux.
Variations in the accretion rate through the circumplanetary disk may also result from the eccentricity induced in the disk by a massive planet. In their study of the response of an accretion disk to a perturbing embedded planet, Kley & Dirksen (2006) found that above a minimum planetary mass of q=0.003 times smaller than the stellar mass, the disk in the vicinity of the planet makes a transition from a nearly circular state to an eccentric state. The eccentricity is approximately stationary in the inertial frame. In a companion paper (Liskowsky et al. 2012), we present evidence for such an eccentricity in the HD 100546 disk based on the line profile of the NIR OH emission.
Kley & Dirksen (2006) find that the eccentricity of the inner edge of the gap induced by the planet is such that when the planet is more massive than q=0.005, the disk is eccentric enough that the planet periodically passes through the gap edge. During these passages, the mass accretion rate onto the planet is strongly increased, allowing continued accretion onto the planet. The accretion rate toward the planet may be more strongly pulsed if the orbit of the planet also becomes eccentric (D’Angelo, Lubow, & Bate 2006).
As discussed by Kley & Dirksen (2006), the role of disk eccentricity in enhancing the planetary accretion rate may be important in allowing the growth of very high mass planets (q). At lower planetary masses where the disk is essentially circular, the width of the gap cleared by the planet grows as the planet grows in mass, eventually shutting off accretion onto the planet and star (e.g., Bryden et al. 1999; Lubow et al. 1999; Lubow & D’Angelo 2006), potentially making it difficult to form planets . Thus, it would be important to obtain evidence of eccentric disks with embedded planets and a varying circumplanetary accretion rate in order to confirm this picture.
Further observations of the HD 100546 system can test the hypothesis of an orbiting companion. If the variations in the CO emission strength and spectroastrometric signal are due to the presence of an orbiting massive planet located just within the optically thick region of the disk (i.e., at AU), we would expect to see the excess emission should shift blue-ward over the next 5-7 years before disappearing behind the near side of the disk for the next 15 years. The spectro-astrometric signal on the blue side of profile would be reduced in spatial extent by the presence of a compact line emission region with a similar (blueshifted velocity) that is located close to the source of the continuum emission. The asymmetric OH line profile reported in Liskowsky et al. (2012), if it arises from an eccentric inner disk rim induced by a massive orbiting companion, would remain approximately unchanged on this time scale since it would be approximately stationary in the inertial frame and is expected to precess at a rate of only 10 in 1000 orbits.
Regály et al. (2010) considered the dynamical impact of a forming giant planet on the disk in which it is embedded and predicted the line profile variability that would be observed in the CO emission produced by the disk. Their line profile predictions are less directly applicable to HD 100546, firstly because in their model the CO emits within, at, and beyond the orbit of the planet, whereas HD 100546 shows a clear inner hole to the CO emission at 13 AU. Whereas Regály et al. (2010) did not consider the possibility of CO emission from the orbiting object itself, our results also indicate the possibility that significant CO emission may be produced by a compact orbiting source, possibly the circumplanetary disk of a forming planet. Despite these differences, other aspects of the HD 100546 system do resonate more with the picture described by Regály et al. (2010). For example, they confirmed the finding of Kley & Dirksen (2006) that an embedded planet induces a significant eccentricity in the disk. As shown in Paper I, we can reproduce the OH line profile from HD 100546 if it arises mainly from the inner wall of such an eccentric disk.
5. Conclusions
We have explored the use of multi-epoch spectroastrometry and line profile asymmetries of CO fundamental emission as probes of disk substructure in HD 100546. For the higher vibrational CO lines controlled by UV fluorescence, the spectro-astrometric signal at each of the four epochs is consistent with emission from gas in an axisymmetric disk. The equivalent width of the UV fluoresced lines vary, which we argue is best explained by variations in the dust continuum emission. In contrast to the UV fluoresced lines, the v=1-0 CO lines show pronounced variations in the spectro-astrometric signal, in addition to changes in flux and spectral shape. The spectro-astrometric signal of the P26 lines has the signature of axisymmetric disk emission in 2003. However, in 2006 and in 2010, the spectro-astrometric signal is asymmetric, showing an offset only on the blueshifted side of the line. There is also an increase in the flux of the v=1-0 CO emission in 2006 and 2010 relative to 2003. The flux, central velocity, and velocity width of this excess emission differs in 2006 and 2010.
We constructed a model with a compact source of emission near the inner edge of the disk that can account for the variations in the v=1-0 P26 line and its spectro-astrometric signal. The emission strength, velocity width, and velocity offset of the compact source are fixed to that of the excess P26 emission. If we assume that the velocity offset is due to a source in orbit around the star at the inner disk edge, the observed velocity offset implies a spatial location for the excess emission. By adding this prescription for the excess emission to the axisymmetric disk emission model, the changes in the spectro-astrometric signal can be reproduced. Thus the properties of the excess CO emission are consistent with an orbiting body whose CO emission strength and width vary in time.
We suggest that the compact CO emission could arise from a circumplanetary disk orbiting a giant planet near the inner disk edge, with a variable accretion rate onto the circumplanetary disk. Some other recent results suggestive of an orbiting giant planet near the inner disk of HD100546 are relevant to this idea. Quanz et al. (2011) find a ”hole” near the inner disk edge in polarimetric differential images of the HD 100546 taken within 3 months of our 2006 spectrum. This substructure is at the same position angle as required by our model for the excess CO emission at that epoch. In Paper I, we showed that the asymmetric line profile of the OH rovibrational emission arising from the disk could be reproduced if the inner edge of the disk has an eccentricity of 0.18 as predicted by models of a disk interacting with a massive orbiting giant planet (Papaloizou et al. 2001; Kley & Dirksen 2006; Regály et al. 2010).
While our interpretation remains speculative, further observations can test this hypothesis. If the excess v=1-0 emission is due to a circumplanetary disk, then the excess emission should shift blue-ward over the next 5-7 years before disappearing behind the near side of the disk for the next 15 years. The spectro-astrometric signal on the blue side of the profile would be reduced in spatial extent by the presence of a compact line emission region with a similar (blueshifted velocity) that is located close to the source of the continuum emission.
High signal to noise spectroastrometric observations are thus timely. Confirmation of a circumplanetary disk will open new opportunities to study the final stages of gas giant planet formation.
If the variation we observed instead arises from random fluctuations in the disk, e.g., as a result of spatial inhomogeneities produced by the magnetorotational instability, we would not expect to observe systematic variations of this kind. If the variations we observe arise from the effects of disk turbulence, further observations of CO emission from disks may help to provide evidence for, or constrain the nature of, disk turbulence.
Appendix A Analysis of potential artifacts
One concern is the possibility that artifacts in spectroscopic data may mimic or modify a spectro-astrometric signal (Whelan & Garcia, 2008). To account for such artifacts, one can difference the measurement of parallel and anti-parallel slit positions. We checked for such artifacts in 2008 by collecting hot band data of particularly strong unblended lines near 2143 cm-1 (Fig. 7). Plotting the parallel and antiparallel signals, it is clear that the signals agree well though the combination of these measurements improves the sensitivity. The pixel-to-pixel variation along the continuum has a standard deviation of 1.9 for the individual spectra. The combined spectrum has a standard deviation along the continuum of 0.9 .
Because we do not have parallel and anti-parallel observations for most of the epochs presented in this work, we have carefully modeled several sources of artifacts: variable seeing, a distorted PSF, and the misalignment of the slit with the PSF. Here we briefly summarize the effect of each of these artifacts. If the seeing is variable and the disk is resolved, the ratio of the emission line to the continuum will vary as the portion of the disk excluded from the slit varies. This affects the strength of the spectro-astrometric signal, but it will not change the shape of that signal. The range of seeing conditions spanned by our observations () results in a variation of the line to continuum ratio of 10%.
We also checked the effect of an elongated PSF to simulate the effect of poor focusing. We found that in principle this could create an artificial spectro-astrometric signal, however, it would effect all the lines the same way, whereas we observe significant variation of the P26 line and no significant variation of the CO hot band lines. We convolved the acquisition image with our model of the disk to check the effect of the actual focus on the resultant signal and found that it is not significant at our level ().
Finally, we considered the effect of miscentering of the slit with the PSF of the source. This can lead to line asymmetries as one side of the disk is sampled more than the other. It also leads to an asymmetric spectro-astrometric signal. However, miscentering will cause the brighter side to have a larger offset than the fainter side, which is the opposite of what is observed in our data (Fig. 6bc). Additionally, the PSF would need to be offset by a full slit width to produce an observable effect. Miscentering the star on the slit by this amount is unlikely.
There is also some concern that telluric lines can introduce significant artifacts if the spectrum is not properly rectified. Inspection of the columns overlapping telluric lines (e.g. 2144.5 - 2145.5 cm-1 in figure 7), the standard deviation is slightly higher (2.1 and 2.2 for the parallel and anti-parallel slit positions respectively). The standard deviation of the combined spectra is 1.1 , thus the improvement in the sensitivity of our measurement of the centroid of the PSF is not necessarily more significant near the telluric features. Additionally, there are no apparent systematic artifacts that mimic the variation of the spectro-astrometric signal observed for the P26 line in 2003, 2006, and 2010 (Fig. 5). The spectro-astrometric signal of the hot band lines is consistent over all four epochs and the emission of the brightest emission lines can be seen to be spatially resolved (Fig. 4; see also Brittain et al. 2009). Thus we are confident that the spectro-astrometric signals we detect are not artifacts.
Facilities: Gemini:South (PHOENIX).
References
- Acke & van den Ancker (2006) Acke, B., & van den Ancker, M. E. 2006, A&A, 449, 267
- Acke et al. (2005) Acke, B., van den Ancker, M. E., & Dullemond, C. P. 2005, A&A, 436, 209
- Ardila et al. (2007) Ardila, D. R., Golimowski, D. A., Krist, J. E., et al. 2007, ApJ, 665, 512
- Armitage et al. (2001) Armitage, P. J., Livio, M., & Pringle, J. E. 2001, MNRAS, 324, 705
- Augereau et al. (2001) Augereau, J. C., Lagrange, A. M., Mouillet, D., & Ménard, F. 2001, A&A, 365, 78
- Ayliffe & Bate (2009a) Ayliffe, B. A., & Bate, M. R. 2009, MNRAS, 397, 657
- Ayliffe & Bate (2009b) Ayliffe, B. A., & Bate, M. R. 2009, MNRAS, 393, 49
- Abto (1990) Balbus & Hawley 1991: Balbus, S. A., & Hawley, J. F. 1991, ApJ, 376, 214
- Abtb (1990) Balbus & Hawley 1998: Balbus, S. A., & Hawley, J. F. 1998, Reviews of Modern Physics, 70, 1
- Bast et al. (2011) Bast, J. E., Brown, J. M., Herczeg, G. J., van Dishoeck, E. F., & Pontoppidan, K. M. 2011, A&A, 527, A119
- Bailey (1998) Bailey, J. 1998, MNRAS, 301, 161
- Benisty et al. (2010) Benisty, M., Tatulli, E., Ménard, F., & Swain, M. R. 2010, A&A, 511, A75
- Blake & Boogert (2004) Blake, G. A., & Boogert, A. C. A. 2004, ApJ, 606, L73
- Bouwman et al. (2003) Bouwman, J., de Koter, A., Dominik, C., & Waters, L. B. F. M. 2003, A&A, 401, 577
- Brittain et al. (2009) Brittain, S. D., Najita, J. R., & Carr, J. S. 2009, ApJ, 702, 85
- Brittain et al. (2007) Brittain, S. D., Simon, T., Najita, J. R., & Rettig, T. W. 2007, ApJ, 659, 685
- Brittain et al. (2003) Brittain, S. D., Rettig, T. W., Simon, T., et al. 2003, ApJ, 588, 535
- Brown et al. (2011) Brown, J. M., Herczeg, G. J., Pontoppidan, K. M., & van Dishoeck, E. F. 2012, ApJ, 744, 116
- Bruderer et al. (2012) Bruderer, S., van Dishoeck, E. F., Doty, S. D., & Herczeg, G. J. 2012, A&A, 541, A91
- Bryden et al. (1999) Bryden, G., Chen, X., Lin, D. N. C., Nelson, R. P., & Papaloizou, J. C. B. 1999, ApJ, 514, 344
- Calvet et al. (2002) Calvet, N., D’Alessio, P., Hartmann, L., Wilner, D., Walsh, A., & Sitko, M. 2002, ApJ, 568, 1008
- Calvet et al. (2005) Calvet, N., et al. 2005, ApJ, 630, L185
- Carr et al. (2001) Carr, J. S., Mathieu, R. D., & Najita, J. R. 2001, ApJ, 551, 454
- Abt (1990) Clarke & Armitage 2003: Clarke, C. J., & Armitage, P. J. 2003, MNRAS, 345, 691
- D’Alessio et al. (2005) D’Alessio, P., et al. 2005, ApJ, 621, 461
- Abt (1991) D’Angelo et al. 2006: D’Angelo, G., Lubow, S. H., & Bate, M. R. 2006, ApJ, 652, 1698
- Dominik et al. (2003) Dominik, C., Dullemond, C. P., Waters, L. B. F. M., & Walch, S. 2003, A&A, 398, 607
- Espaillat et al. (2011) Espaillat, C., Furlan, E., D’Alessio, P., et al. 2011, ApJ, 728, 49
- Abt (1991) Flock et al. 2011: Flock, M., Dzyurkevich, N., Klahr, H., Turner, N. J., & Henning, T. 2011, ApJ, 735, 122
- Furlan et al. (2006) Furlan, E., et al. 2006, ApJS, 165, 568
- Goto et al. (2006) Goto, M., Usuda, T., Dullemond, C. P., et al. 2006, ApJ, 652, 758
- Grady et al. (2005) Grady, C. A, Woodgate, B., Heap, S. R., Bowers, C., Nuth, J. A., Herczeg, G. J., Hill, H. G. M., 2005, ApJ, 620, 470
- Grady et al. (2001) Grady, C. A., et al. 2001, AJ, 122, 3396
- Abt (1992) Grady et al. 1997: Grady, C. A., Sitko, M. L., Bjorkman, K. S., et al. 1997, ApJ, 483, 449
- Guimarães et al. (2006) Guimarães, M. M., Alencar, S. H. P., Corradi, W. J. B., & Vieira, S. L. A. 2006, A&A, 457, 581
- Abt (1993) Hawley & Balbus 1991: Hawley, J. F., & Balbus, S. A. 1991, ApJ, 376, 223
- Henning et al. (1998) Henning, T., Burkert, A., Launhardt, R., Leinert, C., & Stecklum, B. 1998, A&A, 336, 565
- Herczeg et al. (2011) Herczeg, G. J., Brown, J. M., van Dishoeck, E. F., & Pontoppidan, K. M. 2011, A&A, 533, A112
- Hinkle et al. (2003) Hinkle, K. H., et al. 2003, Proc. SPIE, 4834, 353
- Hinkle et al. (2000) Hinkle, K. H., Joyce, R. R., Sharp, N., & Valenti, J. A. 2000, Proc. SPIE, 4008, 720
- Hinkle et al. (1998) Hinkle, K. H., Cuberly, R. W., Gaughan, N. A., Heynssens, J. B., Joyce, R. R., Ridgway, S. T., Schmitt, P., & Simmons, J. E. 1998, Proc. SPIE, 3354, 810
- Hirose & Turner (2011) Hirose, S., & Turner, N. J. 2011, ApJ, 732, L30
- Abt (1994) Jang-Condell 2009:Jang-Condell, H. 2009, ApJ, 700, 820
- Kley & Dirksen (2006) Kley, W., & Dirksen, G. 2006, A&A, 447, 396
- Kraus & Ireland (2011) Kraus, A. L., & Ireland, M. J. 2012, ApJ, 745, 5
- Krotkov et al. (1980) Krotkov, R., Wang, D., & Scoville, N. Z. 1980, ApJ, 240, 940
- Kunde & Maguire (1974) Kunde, V. R., & Maguire, W. C. 1974, Journal of Quantitative Spectroscopy and Radiative Transfer, 14, 803
- Leinert et al. (2004) Leinert, C., et al. 2004, A&A, 423, 537
- Liu et al. (2003) Liu, W. M., Hinz, P. M., Meyer, M. R., Mamajek, E. E., Hoffmann, W. F., & Hora, J. L. 2003, ApJ, 598, L111
- Liskowsky et al. (2012) Liskowsky, J. P., Brittain, S. D., Najita, J. R., et al. 2012, ApJ, 760, 153
- Lubow et al. (1999) Lubow, S. H., Seibert, M., & Artymowicz, P. 1999, ApJ, 526, 1001
- Lubow & D’Angelo (2006) Lubow, S. H., & D’Angelo, G. 2006, ApJ, 641, 526
- Malfait et al. (1998a) Malfait, K., Bogaert, E., & Waelkens, C. 1998, A&A, 331, 211
- Marsh & Mahoney (1992) Marsh, K. A., & Mahoney, M. J. 1992, ApJ, 395, L115
- Martin & Lubow (2011a) Martin, R. G., & Lubow, S. H. 2011b, MNRAS, 413, 1447
- Martin & Lubow (2011b) Martin, R. G., & Lubow, S. H. 2011a, ApJ, 740, L6
- Morales-Calderón et al. (2011) Morales-Calderón, M., Stauffer, J. R., Hillenbrand, L. A., et al. 2011, ApJ, 733, 50
- Muzerolle et al. (2009) Muzerolle, J., Flaherty, K., Balog, Z., et al. 2009, ApJ, 704, L15
- Najita et al. (2007a) Najita, J. R., Carr, J. S., Glassgold, A. E., & Valenti, J. A. 2007a, Protostars and Planets V, 507
- Najita et al. (2007b) Najita, J. R., Strom, S. E., & Muzerolle, J. 2007b, MNRAS, 378, 369
- Najita et al. (2003) Najita, J., Carr, J. S., & Mathieu, R. D. 2003, ApJ, 589, 931
- Najita et al. (2000) Najita, J. R., Edwards, S., Basri, G., & Carr, J. 2000, Protostars and Planets IV, 457
- Najita et al. (1996) Najita, J., Carr, J. S., Glassgold, A. E., Shu, F. H., & Tokunaga, A. T. 1996, ApJ, 462, 919
- Panić et al. (2010) Panić, O., van Dishoeck, E. F., Hogerheijde, M. R., et al. 2010, A&A, 519, A110
- Pantin et al. (2000) Pantin, E., Waelkens, C., & Lagage, P. O. 2000, A&A, 361, L9
- Papaloizou et al. (2001) Papaloizou, J. C. B., Nelson, R. P., & Masset, F. 2001, A&A, 366, 263
- Pontoppidan et al. (2011) Pontoppidan, K. M., Blake, G. A., & Smette, A. 2011, ApJ, 733, 84
- Pontoppidan et al. (2008) Pontoppidan, K. M., Blake, G. A., van Dishoeck, E. F., Smette, A., Ireland, M. J., & Brown, J. 2008, ApJ, 684, 1323
- Quanz et al. (2011) Quanz, S. P., Schmid, H. M., Geissler, K., et al. 2011, ApJ, 738, 23
- Quillen & Trilling (1998) Quillen, A. C., & Trilling, D. E. 1998, ApJ, 508, 707
- Abt (1995) Quillen et al. 2004: Quillen, A. C., Blackman, E. G., Frank, A., & Varnière, P. 2004, ApJ, 612, L137
- Abt (1996) Rice et al. 2003: Rice, W. K. M., Wood, K., Armitage, P. J., Whitney, B. A., & Bjorkman, J. E. 2003, MNRAS, 342, 79
- Regály et al. (2010) Regály, Z., Sándor, Z., Dullemond, C. P., & van Boekel, R. 2010, A&A, 523, A69
- Rothman et al. (2003) Rothman, L. S., et al. 2003, Journal of Quantitative Spectroscopy and Radiative Transfer, 82, 5
- Salyk et al. (2009) Salyk, C., Blake, G. A., Boogert, A. C. A., & Brown, J. M. 2009, ApJ, 699, 330
- Salyk et al. (2011) Salyk, C., Blake, G. A., Boogert, A. C. A., & Brown, J. M. 2011, ApJ, 743, 112
- Skrutskie et al. (1990) Skrutskie, M. F., Dutkevitch, D., Strom, S. E., Edwards, S., Strom, K. M., & Shure, M. A. 1990, AJ, 99, 1187
- Smak (1981) Smak, J. 1981, Acta A, 31, 395
- Sturm et al. (2010) Sturm, B., Bouwman, J., Henning, T., et al. 2010, A&A, 518, L129
- Takami et al. (2003) Takami, M., Bailey, J., & Chrysostomou, A. 2003, A&A, 397, 675
- Takami et al. (2001) Takami, M., Bailey, J., Gledhill, T. M., Chrysostomou, A., & Hough, J. H. 2001, MNRAS, 323, 177
- Thi et al. (2011) Thi, W.-F., Ménard, F., Meeus, G., et al. 2011, A&A, 530, L2
- van den Ancker et al. (1997) van den Ancker, M. E., et al. 1997, A&A, 324, L33
- van der Plas et al. (2009) van der Plas, G., van den Ancker, M. E., Acke, B., Carmona, A., Dominik, C., Fedele, D., & Waters, L. B. F. M. 2009, A&A, 500, 1137
- Whelan & Garcia (2008) Whelan, E., & Garcia, P. 2008, Jets from Young Stars II, 742, 123
- Zhu et al. (2009) Zhu, Z., Hartmann, L., & Gammie, C. 2009, ApJ, 694, 1045
| Date | Integration | Spectral Grasp | Slit PA | S/N | Seeing | Centroid rms | Airmass |
|---|---|---|---|---|---|---|---|
| minutes | cm-1 | deg E of N | arcsec | milliarcseconds | sec(z) | ||
| 2003 January 7 | 20 | 2029 - 2040 | 90 | 62 | 0.8 | 3.3 | 1.5 |
| 2006 January 14 | 12 | 2027 - 2038 | 90 | 43 | 0.6 | 4.3 | 1.4 |
| 20 | 2141 - 2152 | 90 | 102 | 0.4 | 3.1 | 1.3 | |
| 2008 December 21 | 12 | 2136 - 2147 | 37 | 113 | 0.4 | 2.1 | 1.6 |
| 2008 December 22 | 12 | 2136 - 2147 | 127 | 127 | 0.4 | 1.9 | 1.4 |
| 12 | 2136 - 2147 | 307 | 122 | 0.4 | 1.9 | 1.6 | |
| 2010 December 23 | 20 | 2027 - 2038 | 90 | 79 | 0.8 | 4.5 | 1.4 |
| Line | Wavenumber |
|---|---|
| cm-1 | |
| v=3-2 P15 | 2030.16 |
| v=6-5 R5 | 2032.83 |
| v=4-3 P8 | 2033.14 |
| 13CO v=1-0 P16 | 2033.42 |
| v=3-2 P14 | 2034.41 |
| v=2-1 R6 | 2142.47 |
| v=3-2 R14 | 2142.72 |
| v=4-3 R23 | 2142.95 |
| 13CO v=1-0 R13 | 2144.01 |
| Date | Line | Equivalent Width |
|---|---|---|
| 10-2 cm-1 | ||
| 2003 January 7 | P26 | 4.500.14 |
| HB (2032) | 1.630.12 | |
| 2006 January 14 | P26 | 6.460.15 |
| HB (2032) | 1.850.13 | |
| HB (2143) | 2.120.05 | |
| 2008 December 21-22 | HB (2143) | 1.98.010 |
| 2010 December 23 | P26 | 9.800.13 |
| HB (2032) | 2.500.12 |
| Date | Scaled Equivalent Width1 | Excess Equivalent Width | Doppler Shift of Excess | FWHM of Excess |
|---|---|---|---|---|
| 10-2 cm-1 | 10-2 cm-1 | km s-1 | km s-1 | |
| 2003 January 7 | 4.500.14 | |||
| 2006 January 14 | 5.690.59 | 1.190.61 | +61 | 6 |
| 2010 December 23 | 6.390.57 | 1.890.58 | -11 | 12 |