11email: romane.legal@obs.ujf-grenoble.fr;pierre.hily-blant@obs.ujf-grenoble.fr;
alexandre.faure@obs.ujf-grenoble.fr
2 Institut Universitaire de France
3 Université de Paris Sud/CNRS, IAS (UMR 8617), Orsay, France
4 LERMA / CNRS (UMR 8112) / Observatoire de Paris, France
Interstellar chemistry of nitrogen hydrides in dark clouds
Nitrogen, amongst the most abundant metals in the interstellar medium, has a peculiar chemistry which differs from those of carbon and oxygen. Recent observations of several nitrogen-bearing species in the interstellar medium suggest abundances in sharp disagreement with current chemical models. Although some of these observations show that some gas-grains processes are at work, gas-phase chemistry needs first to be revisited. Strong constraints are provided by recent Herschel observations of nitrogen hydrides in cold gas. The aim of the present work is to perform a comprehensive analysis of the interstellar chemistry of nitrogen, focussing on the gas-phase formation of the smallest polyatomic species and in particular nitrogen hydrides. We present a new chemical network in which the kinetic rates of critical reactions have been updated based on recent experimental and theoretical studies, including nuclear spin branching ratios. Our network thus treats the different spin symmetries of the nitrogen hydrides self-consistently together with the ortho and para forms of molecular hydrogen. This new network is used to model the time evolution of the chemical abundances in dark cloud conditions. The steady-state results are analysed, with special emphasis on the influence of the overall amounts of carbon, oxygen, and sulphur. Our calculations are also compared with Herschel/HIFI observations of NH, , and detected towards the external envelope of the protostar IRAS 16293-2422. The observed abundances and abundance ratios are reproduced for a C/O gas-phase elemental abundance ratio of , provided that the sulphur abundance is depleted by a factor larger than 2. The ortho-to-para ratio of in these models is . Our models also provide predictions for the ortho-to-para ratios of and of and respectively. We conclude that the abundances of nitrogen hydrides in dark cloud conditions are consistent with the gas-phase synthesis predicted with our new chemical network.
Key Words.:
Astrochemistry – ISM:abundances – ISM:molecules – Individual objects: IRAS 16293-2422, W49N, G10.6-0.41 Introduction
Nitrogen-bearing species are commonly observed in the interstellar medium (ISM), since the discovery of ammonia, the first polyatomic interstellar species, by Cheung et al. (1968). Nitrogenated species are useful probes of the physics and chemistry of the ISM over a broad range of conditions. Inversion lines of ammonia serve as temperature probes in molecular clouds (Ho & Townes, 1983; Maret et al., 2009), and rotational lines of diazenylium () and its deuterated isotopologue, , may be used at much higher densities (, Pagani et al., 2007; Crapsi et al., 2007). In the diffuse ISM, CN absorption lines allowed the first estimate of the CMB temperature (Thaddeus, 1972). Due to its sensitivity to Zeeman splitting and to its hyperfine structure, CN is also a powerful tool to measure the line-of-sight magnetic field intensity in dense regions (Crutcher, 2012).
The reservoir of nitrogen in molecular clouds is still controversial, but is expected to be gaseous, either in atomic or molecular forms. Atomic nitrogen in the diffuse ISM is observed through absorption lines in the UV (Nieva & Przybilla, 2012). Searches for the molecule in interstellar space had been unfruitful until its first detection in the far-ultraviolet by Knauth et al. (2004), in absorption against the background star HD 124314. The derived column density of , 4.6, is several orders of magnitude lower than that of atomic nitrogen (2.0), indicating that nitrogen is mainly atomic. The total visual extinction is 1.5 magnitude or (assuming standard grain properties), leading to abundances, with respect to hydrogen nuclei, of 7.2 and 1.6 for atomic and molecular nitrogen respectively. The column density of is also about one order of magnitude higher than the predictions of Li et al. (2013) for translucent clouds which take into account the photodissociation of . The strong discrepancy between observations and model predictions suggests that our understanding of nitrogen chemistry in such diffuse to translucent environments remains poor. In dense molecular clouds, where hydrogen is molecular, the situation is even worse, because NI and are not observable directly. Constraints on their abundances are thus only indirect. In dense molecular clouds, , a direct chemical product of , was observed by Womack et al. (1992) and Maret et al. (2006) who concluded that atomic N is likely the dominant reservoir of nitrogen. In addition, in prestellar cores with gas densities , Hily-Blant et al. (2010b) derived an upper limit on the gas-phase abundance of atomic nitrogen which suggested that nitrogen may be predominantly hidden in ices coating dust grains. More recently, Daranlot et al. (2012) found that gaseous nitrogen is mostly atomic in dense clouds, but that the dominant reservoir of nitrogen is indeed in the form of ammonia ices at the surface of dust grains. Yet, as stressed by these authors, the predicted amount of icy ammonia is larger than what is observed in dark clouds and much larger than what is observed in comets. From the above, one can safely consider that the question of the reservoir of gaseous (and solid) nitrogen in dark clouds still remains an open issue.
In recent years, additional observations have challenged our understanding of the first steps of the chemistry of nitrogen (e.g. Hily-Blant et al., 2010b; Persson et al., 2012). By first steps we here refer to the synthesis of the smallest N-bearing molecules. One such discrepancy between observations and models is evidenced by the CN:HCN abundance ratio towards several starless dark clouds, the value of which is underpredicted in the models of Hily-Blant et al. (2010b). Another fundamental issue concerns the HCN:HNC abundance ratio. These two isomers are the products of the dissociative recombination (hereafter noted DR) of , with equal measured branching ratio (Mendes et al., 2012). The predicted abundance ratio HCN:HNC is so expected close to unity (Herbst et al., 2000). Observed ratios however show a large scatter around unity (Hirota et al., 1998) which may reflect different chemical routes to these molecules. Another fundamental question is the formation of ammonia in dense clouds. Le Bourlot (1991) suggested that the gas-phase synthesis through the reaction, followed by hydrogen abstractions and DR reactions, was efficient enough to reproduce the observed amounts. Yet, very recently, Dislaire et al. (2012) revisited the experimental data available for the reaction. The new rate is significantly smaller and falls below the critical value inferred by Herbst et al. (1987) to explain the observed abundances of ammonia. The efficiency of gas-phase synthesis of ammonia versus hydrogenation of atomic nitrogen at the surfaces of dust grains remains an open issue (e.g. Tielens & Hagen, 1982; D’Hendecourt et al., 1985; Charnley & Rodgers, 2002; Hidaka et al., 2011). Observational constraints on the amount of ammonia locked into ices coating dust grains are rare, because the N-H vibrational feature at 2.95 is heavily obscured by the deep 3 water ice bands. However, observations of ices in young star formation regions indicate that an abundance of 5% relative to water seems to be a reasonable value (Bottinelli et al., 2010). Up to now, N2 ices have not been detected in dense regions (Sandford et al., 2001). Perhaps related to the ammonia issue is a new constraint based on the abundance ratios of nitrogen hydrides NH:: towards the Class 0 protostar IRAS 16293-2422, obtained with the HIFI (Heterodyne Instrument for the Far-Infrared) instrument onboard the Herschel satellite in the framework of the CHESS key program (Ceccarelli et al., 2010). The absorption lines arising from the low-lying rotational levels of these hydrides lead to abundance ratios NH:: = 5:1:300. These abundance ratios could not be reproduced by model calculations in dark gas at a temperature of 10 K and a gas density of (Hily-Blant et al., 2010a). Last, in diffuse to translucent environments, Herschel/HIFI observations of the ortho and para forms of ammonia indicate an ortho-to-para ratio of which could not be explained with the standard nitrogen chemistry (Persson et al., 2012).
The present paper is devoted to the chemistry of nitrogen in dense regions of the ISM which are efficiently shielded from ultraviolet photons by the dust and molecular hydrogen. One major difficulty to make progress on the issue of nitrogen chemistry in the dense ISM is that both N and are not observable. The determination of their abundances thus relies on observations of trace nitrogen-containing molecules. Chemical models are then essential. Such carriers usually include , CN, HCN, HNC, , together with , D, and isotopologues, and to a lesser extent NO. The typical abundances – with respect to the total H nuclei – for the major isotopologues are –, except for NO whose abundance may be as high as (Suzuki et al., 1992; Gerin et al., 1992; Akyilmaz et al., 2007; Hily-Blant et al., 2010b; Padovani et al., 2011). Chemical models allow to make predictions for the abundances of chemical species under specified physical conditions (for a review, see Wakelam et al., 2010). Time-dependent models follow the abundances with time, until the steady-state is eventually reached. In the interstellar medium, however, the steady-state does not coincide with the thermodynamical equilibrium, and models should thus solve the time-dependent chemical and physical equations in a self-consistent fashion (e.g. Tassis et al., 2012). However, a full coupling, e.g. including also the impact of the chemical abundances on the thermodynamical state of the gas through radiative transfer, remains beyond the current numerical capabilities. Simplifications must be made, such as adopting analytical prescriptions for the time evolution of the gas physical conditions (Bergin & Langer, 1997; Flower et al., 2005). Regarding the chemical processes, the cornerstone of any chemical model is really the network of chemical reactions that describe the formation and destruction of the chemical species. The determination, either theoretically or experimentally, of the kinetic rates of these reactions at the low temperatures prevailing in the diffuse, translucent, and dense ISM ( K) is extremely time-demanding. This task is simply out of reach for the few thousands reactions involved in current chemical networks. It is thus crucial to identify the key reactions whose rates have a major effect on the chemistry (Wakelam et al., 2010, 2012).
In recent years, motivated by the above challenges, rate constants for several key reactions involved in the chemistry of interstellar nitrogen have been computed (e.g. Jorfi et al., 2009; Jorfi & Honvault, 2009) and measured (e.g. Bergeat et al., 2009; Daranlot et al., 2011, 2012) down to 10 and 50 K, respectively. These challenges also triggered theoretical investigations. Separate collisional rates were computed for HCN and HNC with by Sarrasin et al. (2010). They show in particular very different rates for the (1-0) rotational transition. Using those new rates, Padovani et al. (2011) derived an abundance ratio HCN:HNC in three starless cores, in agreement with model predictions, suggesting that the current chemical route to HCN and HNC is consistent with observations. Further observations are however needed to put this result on a firmer basis. A theoretical investigation of the ortho-para chemistry of ammonia in the cold interstellar medium was done by Rist et al. (2013). They calculated separate branching ratios for the hydrogen abstractions and DR reactions leading to the ortho and para forms of nitrogen hydrides, taking into account nuclear spin selection rules. With these new rates and the new chemical network fully described in this paper, Faure et al. (2013) showed that the ortho-to-para ratio of for ammonia, observed by Persson et al. (2012), is in fact consistent with gas-phase chemistry in a para-enriched gas. In this model the anomalous values of the ortho-to-para ratios of nitrogen hydrides are a consequence of the low ortho-to-para ratio of , and result from the conservation of nuclear spin in chemical reactions. In a similar fashion, Dislaire et al. (2012) showed that the NH: abundance ratio in the envelope of IRAS 16923-2422 can be reproduced only for an ortho-to-para ratio of H2 .
These recent experimental and theoretical results motivated the present work aimed at presenting a new network of the nitrogen chemistry in dense clouds, thus superseding the classical networks of Herbst & Klemperer (1973) and Pineau des Forêts et al. (1990). This work puts special emphasis on nitrogen hydrides for which the ortho and para forms are treated self-consistently together with the ortho and para forms of . The outline of the paper is as follows. In Section 2, we present our new nitrogen network. Section 3 describes our model calculations, with in particular a discussion on initial abundances. Results and comparisons with Herschel observations of nitrogen hydrides are the subject of Section 4. Section 5 summarises our new findings and suggests further lines of investigation.
2 Chemical network
2.1 General considerations
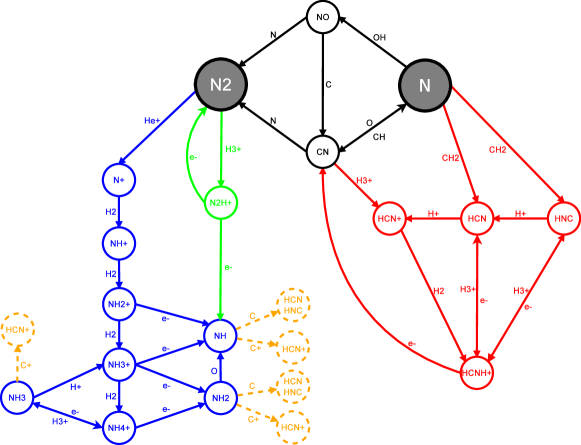
The formation of nitrogen hydrides (NH, , and ) is similar to that of carbon and oxygen hydrides, but has a different origin. First, on the contrary to carbon, is not available directly because the ionization potential of N (14.53 eV) is larger than that of H. In addition, the reaction – whose analogue is responsible for the production of and in dark gas – is endothermic because the proton affinity of N (3.55 eV) is lower than that of (4.38 eV). The alternative exothermic pathway, , shows a high activation energy (Herbst et al., 1987). Thereby in the current understanding of nitrogen chemistry, the production of results from molecular nitrogen reacting with . This reaction is found to be more efficient than the direct cosmic-ray ionization of atomic nitrogen. Once is formed, rapid hydrogen-abstraction reactions initiated with
| (1) |
lead to the , , , and ions which, by dissociative recombinations, generate the formation of neutral nitrogen hydrides (see Fig. 1). In addition, and because molecular nitrogen has a proton affinity of 5.12 eV, the reaction of with yielding is exothermic, and proceeds at a significant rate. The DR of then leads to NH. Hence, the formation of nitrogen hydrides has its origin in . On the other hand, nitriles (such as HCN) derive from atomic nitrogen, through ion-neutral reactions with and . Therefore, if nitrogen hydrides are rather late-time species, nitriles are anticipated to form at earlier times. This has important consequences on the 15N fractionation processes as discussed recently in Hily-Blant et al. (2013a).
The formation of nitrogen hydrides is therefore a relatively slow process compared to carbon and oxygen hydrides, precisely because the first step involves the synthesis of molecular nitrogen which is thought to proceed through neutral-neutral reactions (Pineau des Forêts et al., 1990; Hily-Blant et al., 2010b):
| (2) |
| (3) |
and
| (4) |
| (5) |
| (6) |
We anticipate that in those instances where the C/O gas-phase elemental abundance ratio is lower than unity, reaction (5) is expected to dominate the formation of CN over reaction (4).
Reaction (1) consequently appears to be a key reaction for the synthesis of nitrogen hydrides. In fact, it was studied in detail by Le Bourlot (1991) who derived separate rates for the reaction with ortho and para ( and respectively in the remainder of the text). The reaction with was assumed to occur with a 170 K activation energy, while being barrierless with . The rate of reaction (1) strongly depends on the ortho-to-para ratio of (noted () hereafter). More recently, Dislaire et al. (2012) revised those rates (see Table LABEL:tab:newin) using available experimental data (Marquette et al., 1988; Gerlich, 1993) for , normal- (i.e. ()=3:1) and containing admixtures of , leading to a rate at 10 K typically two orders of magnitude lower than in Le Bourlot (1991). In particular, for () , the new rate is below the critical value of required to account for the observed amounts of gas-phase ammonia (Herbst et al., 1987). Nevertheless, Dislaire et al. (2012) could reproduced the abundance of ammonia observed towards IRAS 16293-2422, provided the total C/O gas-phase abundance ratio was lower than 0.4. Recent measurements by Zymak et al. (2013) have confirmed the rate used by Dislaire et al. (2012), although issues related to the fine structure relaxation of N+ deserve further experimental and theoretical studies. Dislaire et al. (2012) also showed that a branching ratio for the channel of leading to NH is sufficient to reproduce the observed amount of NH. The abundance of NH is thus independent of the (), contrary to and which proceed from reaction (1). One consequence is that the NH: abundance ratio depends on the (). Using the NH: abundance ratio, Dislaire et al. (2012) could finally determine an () of . However, these authors did not treat explicitly the formation of and .
In the following, we discuss the new reaction rates that have been implemented to model self-consistently the formation of nitrogen hydrides, of and . This new network is an updated version of the gas-phase network of Flower et al. (2006a), as detailed below.
2.2 The ortho-to-para ratio of
The () plays a significant role in the chemistry of nitrogen hydrides, and it is therefore important to understand the processes that may affect its value, in order to self-consistently model the chemistry. As is not directly observable in the cold gas, its () ratio derives from indirect measurements (e.g. Troscompt et al., 2009, and references therein). An upper limit of 0.01 was proposed by Pagani et al. (2009) to explain the large deuteration fraction of in cold cores. Values consistent with this upper limit were predicted by the models of Flower et al. (2006b), with (). Molecular hydrogen is assumed to form on dust grain surfaces (Hollenbach & Salpeter, 1971), in a strongly exothermic reaction ( eV) such that the outcoming and should be in the ratio 3:1, imposed by their nuclear spin statistical weights. This corresponds to the maximum value permitted under thermal equilibrium. At temperatures lower than 100 K, only the first rotational levels of and (lying 170.5 K above ) are populated significantly, and the equilibrium value of () is given by the usual low-temperature approximation
| (7) |
In the interstellar medium, the characteristic timescale for radiative spontaneous spin flip from of to of is yr (Raich & Good, 1964; Pachucki & Komasa, 2008), much longer than the lifetime of molecular clouds. As a consequence, the ortho and para forms may be viewed as two different chemical species, and gas-phase conversion from one form to the other is expected to take place only through ion-neutral reactions between and protonated ions (Dalgarno et al., 1973; Crabtree et al., 2011). In a general fashion, these reactions can be written
| (8) |
| (9) |
where stands primarily for , , and . If both exchange reactions proceed much more rapidly than the formation of on grains, the () is expected to tend to a value imposed by the detailed balance relation between the rates of reactions (8)-(9) which is the thermal value of Eq. (7). On the contrary, if the formation rate on dust grains is much faster than any of the two exchange reactions, the () value will stay equal to 3:1. As said previously, there are some evidences that the of significantly deviates from both 3:1 and the thermodynamical value of at 10 K. This indicates that certain conversion processes do take place on timescales comparable or even shorter than the formation process on dust grains.
The gas-phase conversion between and has received particular attention in the last few years. We have therefore adopted the most recent theoretical results summarised in Table LABEL:tab:newin. In particular, the conversion through reaction with protons has been computed by Honvault et al. (2011, 2012) using state-to-state quantum time-independent calculations. Exchange reactions with were studied using a state-to-state micro-canonical statistical method by Hugo et al. (2009). The H + H2 reaction was also studied experimentally below 100 K by Grussie et al. (2012), confirming the micro-canonical model. The rates of Hugo et al. (2009) are available for temperatures below 50 K, restricting the validity of our network to this low-temperature range.
In addition to the formation of H2 on grains and to the ortho-to-para exchange reactions between and protonated ions, the formation and destruction of the H ion also play an important role in the (). We have therefore updated the rate coefficients and branching ratios for the reaction and the dissociative recombination . To this aim, we have combined the most recent theoretical and experimental values for the overall rate coefficients with the Oka’s formalism (Oka, 2004) to derive the nuclear spin branching ratios. Briefly, this formalism accounts for the selection rules which result from the conservation of the nuclear spin of identical nuclei. The approach of Oka (2004) is based on angular momentum algebra applied to the total nuclear spins of the reactants. For each allowed nuclear spin of the intermediate complex, the distribution of product states is deduced from the nuclear-spin conservation for the reverse reaction. Full details can be found in Oka (2004). It should be noted that these pure nuclear spin branching ratios are applicable for processes in which many rotational states of the products are populated, in particular exothermic reactions. In this work, these branching ratios were used for strongly exothermic ion-molecule and DR reactions where the products are expected to form rotationally hot, along with full proton scrambling. The corresponding new rate coefficients are listed in Tables LABEL:tab:newin and LABEL:tab:newdr. We note that most measurements have no temperature dependence since they were performed at room temperature only.
Very recently, Faure et al. (2013) showed that these new rates do not significantly change the () at steady-state with respect to the results of Flower et al. (2006b). A constant () of 10-3 was thus found below 15 K. Above this temperature, the () was shown to converge towards the thermal value, as expected from the competition between the H2 formation on grains and the exchange reactions with protonated ions. This point will be further discussed elsewhere.
2.3 Atomic to molecular nitrogen conversion
As we previously mentioned in section 2.1, the atomic to molecular conversion is the first step towards the synthesis of nitrogen hydrides in dark clouds. The rates of reactions (2)–(6) have been uncertain at low temperatures, and in particular the existence of low activation energy ( K) was suggested by the CN:NO abundance ratio (Akyilmaz et al., 2007). The rates for the and reactions have been revisited experimentally by Daranlot et al. (2011, 2012) using the CRESU technique down to temperatures of K, and further extrapolated down to 10 K. The new rates implemented in our network are summarised in Table 5. We note that these rates present positive and negative temperature dependences through values (see Table 5) and that they all lie between 4cm3s-1 and 2cm3s-1 at 10 K. These radical-neutral reactions are therefore moderately fast but they provide the main routes in converting N to N2. The typical chemical timescales of nitrogen chemistry are discussed below.
2.4 Nitrogen hydrides synthesis
As previously emphasized, the () has a strong effect on the chemistry of nitrogen hydrides. In order to take into account the () self-consistently, some care must be taken in the dissociative recombinations of ionic nitrogen hydrides, NH, since these reactions produce and , in amounts that depend on the nuclear spin branching ratios. The associated hydrogen abstractions NH + H2 are also crucial in driving the nuclear spin distributions. The corresponding branching ratios were determined by Rist et al. (2013) using the Oka’s formalism discussed above and assuming full scrambling. These branching ratios were found to be significantly different from those derived by Flower et al. (2006a). In this pioneering study, where the conservation of the total nuclear spin angular momentum was included, the branching ratios were indeed derived from simple statistical considerations without recourse to the angular momentum rules of Oka (2004) (see also Sipilä et al. (2013) for a recent similar work). The new branching ratios derived by Rist et al. (2013) were employed very recently by Faure et al. (2013) in their work on the of ammonia in the cold interstellar gas.
It should be noted that interconversion processes between the nuclear states of ionic hydrides, of the form (), are ignored in this work. Indeed, these proton scrambling reactions were studied experimentally using deuterated analogues and H-D exchanges were not observed, with small upper limits for the rate coefficients (see the discussion in Faure et al. (2013)). In addition, Faure et al. (2013) explicitly studied the thermalization reaction and showed that this reaction must be negligible in order to explain the observed non-thermal of ().
Crucial too is the branching ratio of the DR of N2H+. As emphasized by Dislaire et al. (2012), the channel leading to NH was pivotal to explain the observed NH: ratio higher than one. These authors showed that a branching ratio lower than 10% is sufficient, and recent storage ring measurements by Vigren et al. (2012) confirmed this value, with a branching ratio of 7%. Branching ratios for the DR of the NH ( = 2-4) ions are taken from Mitchell (1990), Thomas et al. (2005), Jensen et al. (2000), and Öjekull et al. (2004) (see Table LABEL:tab:newdr), following Hily-Blant et al. (2010a).
We summarise, in Tables LABEL:tab:newin, LABEL:tab:newdr, and 5, all the updates and improvements from the Flower et al. network, including the ortho- and para-forms of hydrogen and nitrogen species111The full chemical network is available on request to pierre.hily-blant@obs.ujf-grenoble.fr..
3 Modelling
3.1 General description
| H | He | C | CH | O | OH | CO | |||||||
|---|---|---|---|---|---|---|---|---|---|---|---|---|---|
| N | NH | ||||||||||||
| (p) | (o) | CN | HCN | HNC | NO | S | SH | CS | SO | OCS | |||
| Mg | Fe | ||||||||||||
-
† (o), (p), and (m) stand for ortho, para, and meta modifications respectively.
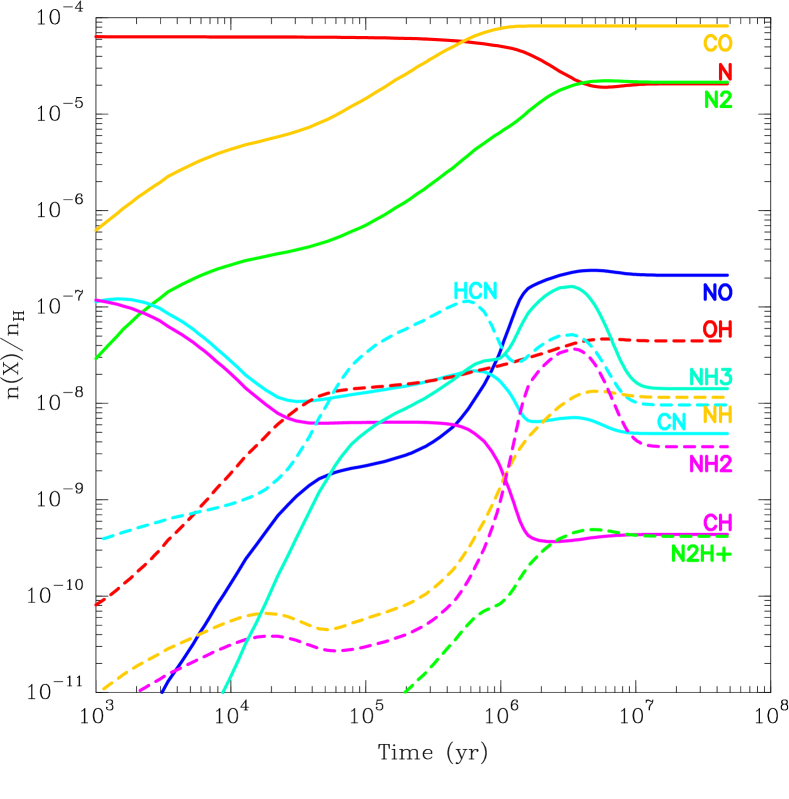
The complete network contains 104 species (see Table 1) and 917 reactions. The physical conditions, which are fixed, are typical of dark clouds: the gas has a constant number density of hydrogen nuclei of , shielded from the UV photons by 10 magnitudes of visual extinction, and the kinetic temperature is kept constant at 10 K. Ionization is driven by cosmic rays, with secondary photons included, and the ionization rate of hydrogen is , the standard value usually attributed to dense regions (Prasad & Huntress, 1980; Caselli et al., 1998; Wakelam et al., 2005). The processes involving dust grains are charge exchange, DR reactions, and the formation of . We adopt a single dust grain radius of 0.1, following Walmsley et al. (2004), satisfying a dust:gas mass ratio of 1%. The abundances of all species are followed with time, until a steady-state is reached. A typical illustrative result is shown in Fig. 2.
Even though we compute the time evolution of all the abundances, we focus our analysis on the steady state, which is reached after typically 1 Myr for carbon and oxygen species, Myr for NO, , and NH, and after 10 Myr for nitrogen bearing species (see Fig. 2). We note that these timescales are likely upper limits as they correspond to initial conditions where all elements (except hydrogen) are in atomic form. As mentioned earlier, nitrogen hydrides are late-time species, a consequence of the slow neutral-neutral reactions needed to build . The longer timescale of 10 Myr is larger than the gravitational free-fall timescale of Myr but comparable to the ambipolar diffusion timescale of Myr at a density of (Tassis & Mouschovias, 2004; Bergin & Tafalla, 2007). Indeed, in their chemical models of collapsing cores, Tassis et al. (2012) also considered delay times (before collapse starts) up to 10 Myr. Another assumption of our model is that freeze-out, which occurs on a typical timescale yr (Bergin & Tafalla, 2007), is not considered during the time evolution of the gas, although observations show depletion of several species in pre-stellar cores (e.g. Tafalla et al., 2004). However, observations also show that an important fraction of molecular species remains in the gas phase, such that desorption mechanisms are required (Hasegawa & Herbst, 1993). Those are highly uncertain, and depend critically on binding energies of the adsorbed species. Nevertheless, molecular mantles are observed in the core of dense dark clouds (Whittet et al., 1983; Boogert et al., 2011), indicating that molecular condensation on grains occurs efficiently. This effect is crudely accounted for in our model by adopting initially depleted elemental abundances in the gas-phase. We also note that although steady-state is rather unlikely, both steady-state and time-dependent modelling carry their own limitations. Time-dependent calculations depend critically on the assumed initial abundances, which are poorly known, whilst steady-state models do not. In addition, focussing on the steady-state does not prevent from identifying key reactions and general trends, while avoiding the uncertainties described above.
3.2 Elemental abundances
The choice of the gas-phase elemental abundances is not a trivial task, nonetheless, and the abundances of the elements strongly influence the chemical state of the gas. One example is the relative amount of carbon and oxygen, which is known to strongly affect the chemistry (van Dishoeck & Blake, 1998; Le Bourlot et al., 1995). For most of the elements, including nitrogen, we follow Flower et al. (2005), who have estimated gas-phase elemental abundances by combining observational constraints from the diffuse ISM and infrared signatures of ices (Gibb et al., 2000), and assuming the composition for the refractory core of dust grains. The abundances of carbon, oxygen, and sulphur, deserve special attention.
The elemental gas-phase abundance of sulphur, noted , is very poorly constrained. It can vary by almost three orders of magnitude if we consider the range delimited by the so-called low metal abundance and high metal abundance cases defined originally by Graedel et al. (1982). The first category is suggested by the low electron abundance in dense clouds and may be more representative of the chemistry in such environments, whilst the second category reflects the standard Oph sightline. Further studies of dense dark clouds have corroborated the low metal sulphur gas-phase abundance, even where elemental carbon, oxygen and nitrogen are depleted by only factors of a few (Ruffle et al., 1999). In the well studied TMC-1 and L183 dark clouds, Tieftrunk et al. (1994) found that the sum of all detected S-bearing molecules represents only 0.1% of the elemental sulphur solar abundance (Przybilla et al., 2008; Asplund et al., 2009). In the following, we have applied depletion factors from the gas-phase of 200, 20, and 2, or abundances with respect to H nuclei of 8.0, 8.0, and 8.0, respectively.
The reference cosmic abundance for oxygen is 575 ppm (Przybilla et al., 2008). Based on 56 diffuse sightlines, Cartledge et al. (2004) evidenced a decreasing gas-phase abundance of oxygen with increasing sightline mean density, reflecting the uptake of oxygen in silicate and oxydes into grain cores. They found an average gas-phase atomic oxygen abundance of 280 ppm for densities greater than 1.5, suggesting that up to 300 ppm of oxygen have been removed from the gas phase. This idea was further developped by Whittet (2010) who performed a comprehensive oxygen budget up to densities , and showed that ppm and ppm are locked into ices and silicates or oxydes, respectively. Taking into account that 50 ppm is in gaseous CO, it must be recognized that up to 300 ppm of oxygen are in unknown carriers. The depletion of oxygen not accounted for by known carriers is also demonstrated by Nieva & Przybilla (2012) who compared the abundances derived by Cartledge et al. with their Cosmic Abundance Standard based on B-stars.
Depletion of carbon is surprisingly not well constrained (see e.g. Figure 5 of Jenkins, 2009), essentially for observational limitations. In addition, the column densities derived so far in the litterature may overestimate the amount of gas-phase carbon, because of an underestimated oscillator strength for the CII transition at 2325 (Sofia et al., 2011). The error could be up to a factor of two.
To reflect the large uncertainties in the gas-phase elemental abundances of carbon and oxygen, we decided to vary the carbon-to-oxygen gas-phase elemental abundance ratio, /, simply noted C/O hereafter. To do so, we have assumed a constant elemental abundance of carbon, , and varied that of oxygen from 50 ppm to 280 ppm. The lower limit is imposed by gaseous CO, and the upper limit is taken from Cartledge et al. (2004). The corresponding range in C/O is 0.3 to 1.5. The upper value of 280 ppm implicitely requires that 230 ppm of oxygen has been taken from the various reservoirs (solid, ices, unknown carriers) and released in the gas phase, by some unspecified processes. Our strategy is therefore analogous in some respects to that adopted by Terzieva & Herbst (1998) and Tassis et al. (2012) who considered a similar range of elemental C/O ratios. However, the main difference with our model is that we do not consider gas-grain processes apart from charge exchange with grains and formation, such that the total amount of gas-phase carbon and oxygen remain constant during the time evolution. For each value of C/O, three models, corresponding to the three sulphur abundances discussed above, were performed. The intial gas-phase elemental abundances are summarized in Table 2.
| Element | This work | Flower et al 2005 |
|---|---|---|
| He | 0.10 | 0.10 |
| C§ | 8.3(-5) | 8.3(-5) |
| N§ | 6.4(-5) | 6.4(-5) |
| O | 5.5(-5) to 2.8(-4) | 1.2(-4) |
| S‡ | 8.0(-8) to 8.0(-6) | 6.0(-7) |
| Fe§ | 1.5(-9) | 1.5(-9) |
-
† Fractional abundances relative to total H nuclei. Numbers in parentheses are powers of 10.
-
‡ The lower value of the total gas-phase elemental abundance of S is taken from the “low metal” case of Graedel et al. (1982).
-
§ The elemental abundances of gas-phase nitrogen, carbon, and iron, are taken from Flower et al. (2005).
4 Results
4.1 Influence of the C/O ratio
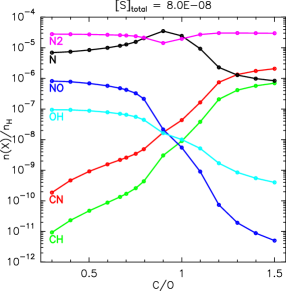
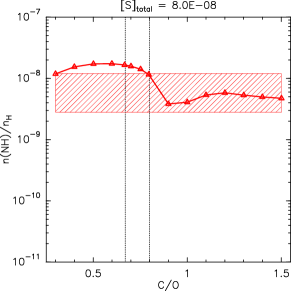
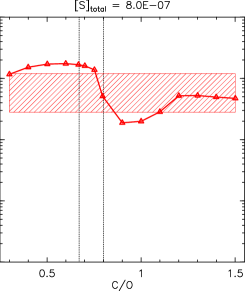
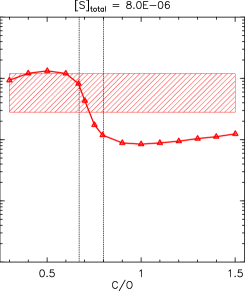
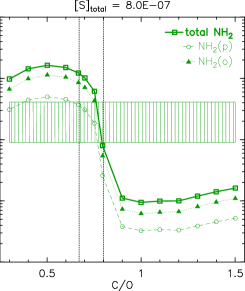
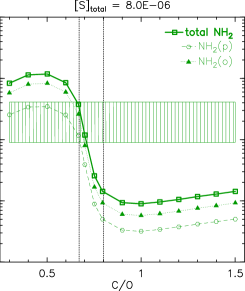
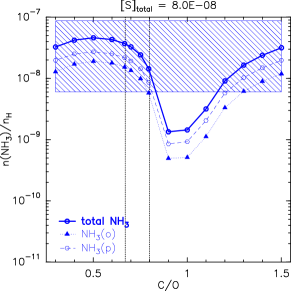
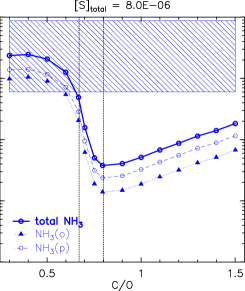
The steady-state abundances of several nitrogenated species, together with chemically related species, are shown in Fig. 3, as a function of the elemental C/O gas-phase abundance ratio, for three sulphur abundances. We first focus on the low metal sulphur abundance (left panel). For all values of C/O, atomic and molecular nitrogen are the most abundant species, except at high C/O, where CN becomes more abundant than N. Our model predicts that, at low and high C/O, molecular nitrogen is the dominant carrier of nitrogen. Oxygen-bearing species such as NO and OH see their abundance decreasing with increasing C/O, by 2 to 5 orders of magnitude. This is a consequence of the decreasing total amount of oxygen available in the gas-phase. On the contrary, the abundances of CN and CH increase by the same amount. Yet, for the latter species, this is not due to an increase in the total amount of carbon, but to an increase of the amount of carbon available in the gas phase, since less carbon is locked into the very stable CO molecule. The turning point between the low- and high-C/O regimes occurs around 0.9. In this intermediate regime (), molecular nitrogen is no longer the main reservoir of nitrogen because OH and CH, which ensure the conversion from N to , are two orders of magnitude less abundant. The above reasoning remains true for a total gas-phase sulphur abundance of 8.0, although the mid-C/O regime now extends up to 1.1. At even higher total gas-phase abundance of sulphur, the high-C/O regime in which N: is not recovered.
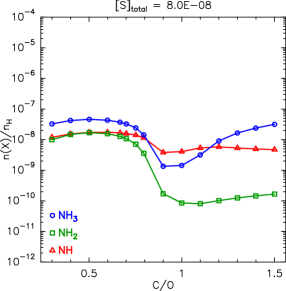
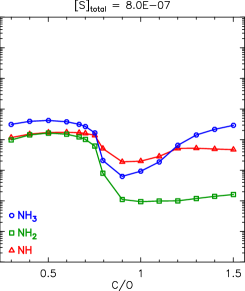
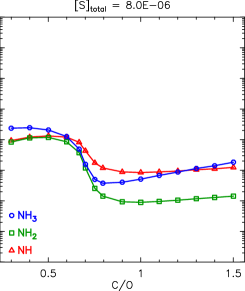
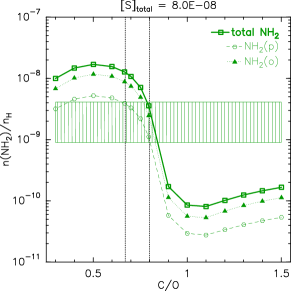
Concerning nitrogen hydrides their evolution with C/O is not uniform. For sulphur abundances up to 8.0, the NH abundance varies by less than an order of magnitude over the whole range of C/O ratio, in sharp contrast with whose abundance decreases from in the low-C/O regime, to in the high-C/O regime. The abundance of ammonia is a few in both the low- and high-C/O regimes, but drops to in the mid-C/O regime. When , the behaviour of is similar to that of , and drops by more than an order of magnitude from the low- to high-C/O regimes. For ammonia, the same trend holds, but unlike or , manages to increase with C/O, although not recovering its value of the low-C/O regime.
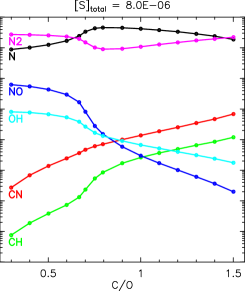
We here provide explanations for the observed abundance behaviours, focussing on the low metal sulphur abundance case. The balance evolution between N and with C/O is explained by the fact that as C/O increases, more oxygen and less carbon – relative to the total – are locked into CO. Therefore, there is less oxygen available in the gas phase, and the abundances of NO and OH drop. The contrary holds true for carbon: there is more CH and CN. Since the N-to- conversion proceeds through NO and/or CN, this explains the peak of N: ratio for C/O 1. As a consequence, the modelled abundances of all nitrogen hydrides which strongly depend on the conversion of N into , decrease at C/O1. However, the fact that ammonia recovers its low-C/O abundance at high C/O when NH and do not, stems from the fact that these two radicals are primarily destroyed by reactions with atomic carbon, while ammonia is not. Reaction of NH with neutral carbon forms CN, and produces HCN and HNC. On the other hand, is not destroyed by neutral carbon but by (whose abundance does not strongly depend on C/O), , and . As a consequence, in the high-C/O regime, the large amount of carbon not locked into CO enhances mostly the destruction of NH and . At the same time, the N-to- conversion restarts through CN, and the formation of ammonia increases.
4.2 Influence of the sulphur abundance
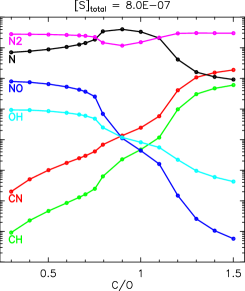
We now further analyse the influence of the total sulphur abundance on the steady-state abundances of nitrogen hydrides. The top panels of Fig. 3 do not show striking differences. Indeed, models with and 8.0 are very similar, and the only change is the broadening of the mid-C/O regime mentioned above. For , CN and CH abundances drop by more than an order of magnitude at high C/O, whereas those of NO and OH increase.
The broadening of the mid-C/O regime as increases results from a combination of several chemical effects. As already mentioned, in this regime, characterized by N:, the conversion from N to is weak, because of the low abundances of CH and OH. Comparing models with and 8.0, drops by about two orders of magnitude at high C/O while is only marginally affected. Although increases by more than a factor 10, it remains 100 times less abundant than CN and does not compensate for the drop of . The net effect is a global decrease of the conversion partners. Hence N remains more abundant than up to . Thus, the effect of must be traced back to CH, through the reaction
| (10) |
which removes CH. A similar reaction holds for OH, but its abundance only slightly decreases. To understand this behaviour, we notice that OH is formed through the DR of , the abundance of which decreases with . Indeed the ionization potential of S (10.36 eV) is lower than that of H and increasing drives up the ionization fraction. The resulting enhanced DR destruction of thus compensates for the destruction of OH by . In the mid-C/O regime at low to intermediate sulphur abundances, there is such a combination of effects that both OH and CH remain too rare to ensure an efficient conversion of N into , leading to a well-defined C/O range in which N:. In this parameter space, the enhanced destruction of CH by dominates over the increase of atomic carbon in the gas phase, and the increase of does not compensate for the destruction of OH by .
Regarding nitrogen hydrides, a variation from low to intermediate sulphur abundance does not change dramatically the abundances. This is not true when going from intermediate to high . At high C/O, drops by a factor of 5, while is unaffected and remains at a very low abundance. The most dramatic change is that of which drops by a factor of 20. This is due to the combination of the two reactions and which get greatly enhanced at high . Their net effect is to transfer nitrogen from ammonia to NH. Nevertherless, the latter sees its amount divided by a factor 5 because the destruction path becomes important in the N: regime.
4.3 Comparison with observations
| Observations b | Models | ||||
| () | Dislaire et al. (2012) c | This workd | Flower et al. (2006a)e | ||
| NH | 2.2(14) | 7.3(-9) | 4.3(-10) | 1.2(-8) | 1.3(-9) |
| 5.0(13) | 1.7(-9) | – | 2.5(-9) | 2.0(-9) | |
| – | – | – | 1.1(-9) | 2.0(-9) | |
| 7.5(13) | 2.5(-9) | 8.2(-11) | 3.6(-9) | 4.0(-9) | |
| – | – | – | 5.8(-9) | 2.5(-9) | |
| – | – | – | 8.6(-9) | 7.3(-9) | |
| 1.4(15) | 4.7(-8) | 7.5(-10) | 1.4(-8) | 9.8(-9) | |
| :NH | 0.34 | 0.2 | 0.3 | 3.1 | |
| :NH | 6.4 | 1.7 | 1.2 | 7.5 | |
| NH:: | 3:1:19 | 5:1:9 | 3:1:3 | 0.3:1:2.5 | |
-
a Constant physical conditions were adopted: =10 K, =, . Numbers in parentheses are powers of ten.
-
c Updated version of the osu.09.2008 network used in Dislaire et al. (2012), who adopted and .
-
d Our network with the parameters of our best model: C/O=0.8 (or [O]tot=1.04) and =8.
-
e Network from Flower et al. (2006a) adopting the parameters of our best model.
Before the launch of the Herschel space telescope, the only astronomical source where the three hydrides NH, and were detected was Sgr B2, with the ratios NH:: 1:10:100 (Goicoechea et al., 2004). However, this line of sight encompasses a variety of physical conditions (e.g. shocks), and the NH:: ratios measured in Sgr B2 may therefore not be representative of cold dense clouds. Recent Herschel/HIFI observations towards the solar-type protostar IRAS 16293-2422, however, allowed to put strong constraints on the nitrogen hydride chemistry in dark gas (Hily-Blant et al., 2010a; Bacmann et al., 2010).
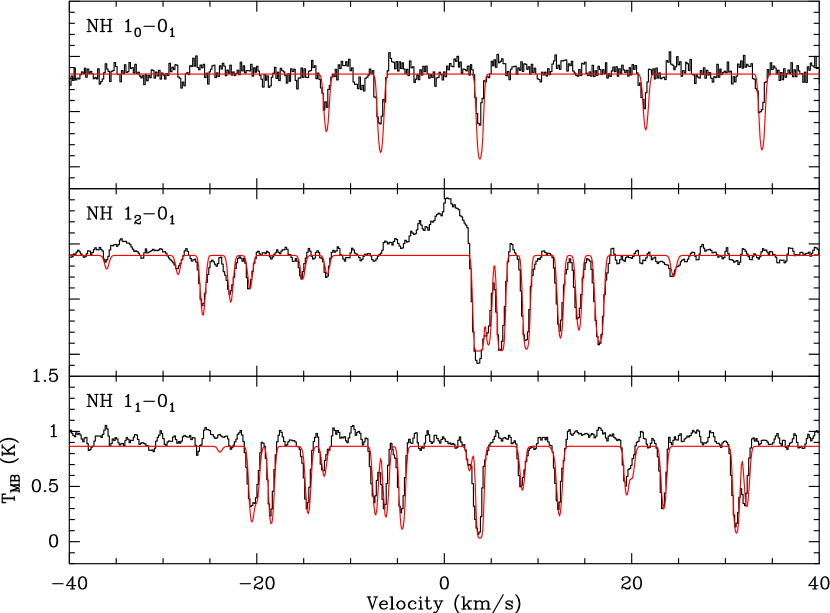
IRAS 16293-2422 is situated deep within a high column density core in a filament of the Oph cloud complex. From the results of extensive interferometric and single dish-mapping at centimetre, millimetre and far-infrared wavelengths, detailed models of the physical structure of the source have been constructed (e.g. Crimier et al., 2010, and references therein). The region can be divided into four components: the ambient molecular cloud, the circumbinary envelope, the three protostellar sources A1, A2 and B, and the outflow components (see Loinard et al., 2013, and references therein). The total column density of towards IRAS 16293-2422 is (van Dishoeck et al., 1995). In the most external part of the source where nitrogen hydrides are seen in absorption, the column density is necessarily much lower. Radiative transfer computations where we have coupled non local thermodynamic equilibrium (non-LTE) calculations with a simple physical model of the source (see Appendix A) have shown that the absorbing region must have a H2 density (i.e. ), which does not correspond to the circumbinary envelope but to the ambient cloud (although the distinction is artificial since the density profile is continuous). For this component, the H2 column density is rather uncertain but we adopted the value derived from C18O observations by van Dishoeck et al. (1995), . We note that Hily-Blant et al. (2010a) employed a different value, , based on an extrapolation of the Crimier et al. profile. The column density derived by Hily-Blant et al. (2010a) was highly uncertain because, in contrast to NH and , the hyperfine structure was not resolved. Guessed excitation temperatures of 8-10 K were therefore employed whithin a LTE treatment. In the present work, non-LTE radiative transfer calculations for NH and were performed, as described in the Appendix A. The best agreement with the observations (see Fig. 6) is obtained for a total ammonia column density of 1.4. The associated gas temperature is 11 K, fully consistent with standard dark cloud conditions. The spectrum of NH is also well reproduced (see Fig. 7). The column density of has also been revised, since it had been estimated by Hily-Blant et al. (2010a) based on the ortho- only and assuming that the para- abundance was negligible. However, our models, as well as Faure et al. (2013), show that this should not be the case, and that the ratio of is more likely . We have therefore increased the total column density of from 5.0 to 7.5. Finally, the column densities of NH, , and used in this work are , , and , respectively, or abundance ratios NH:::1:19. The corresponding abundances relative to the total H nuclei are then obtained using .
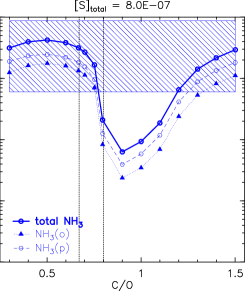
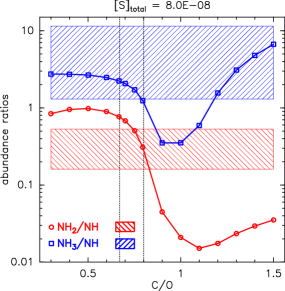
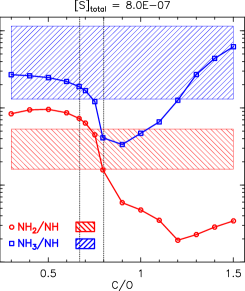
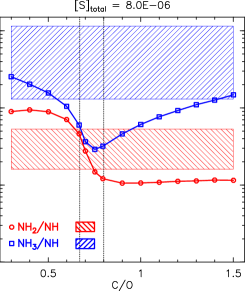
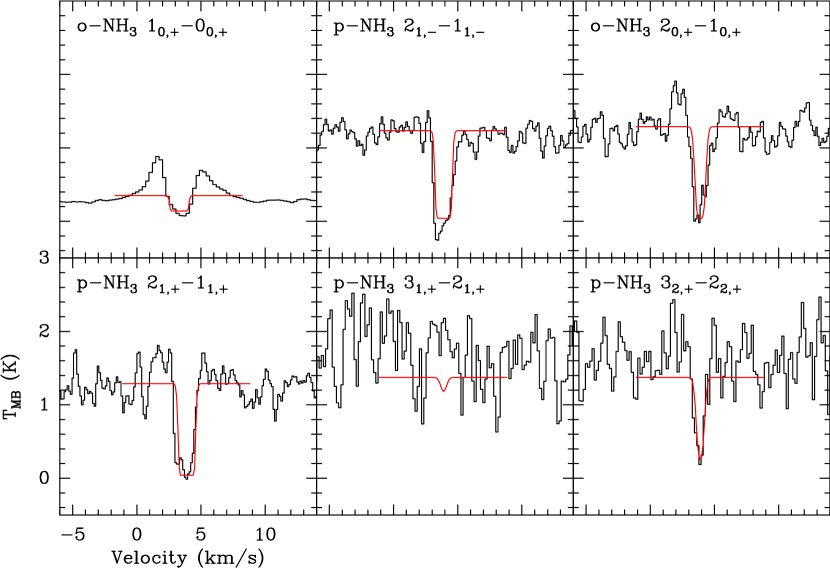
The abundances of NH, , and towards IRAS 16293-2422 are compared in Fig. 4 to the set of models described previously. Overall, the predicted abundances match the observations only within a small range of C/O ratios, which is found to be . However, as discussed above, the uncertainties on the abundances are rather large due to the difficulty to estimate the H2 column density in the absorbing layers. In contrast, abundances (or column density) ratios circumvent this caveat, and are thus more robust. The ratios :NH and :NH are plotted in Fig.5. At low and intermediate sulphur abundance, the :NH ratio delineates a narrow range of C/O values of consistent with the above constraints. At intermediate sulphur abundance the :NH ratio further constrains the C/O ratio to 0.75. For a high sulphur abundance, however, there is no C/O which allows to reproduce simultaneously both abundance ratios. From Fig. 2, which shows the evolution with time of the abundances, we note that the observed abundance ratios NH:: are also well reproduced at very early times yr. However, at such early times, the fractional abundances of the N-hydrides are more than an order of magnitude smaller than observed. Although there was no minimization attempt, the best agreement with the observations is found for the set of parameters and , which will be referred to as our best model.
We conclude that the steady-state abundances predicted by our gas-phase chemical model are consistent with the observational constraints on the abundances and abundance ratios of NH, , and , provided that the C/O ratio is . The elemental abundance of sulphur is less constrained, but must be depleted by more than a factor of 2.
4.4 Impact of the new rates
To evidence the influence of the new rates adopted in our network, we have performed a calculation using the Flower network combined with our best model parameters. The abundances of and are similar to those found with our updated network, with differences less than 30%. However, this is not true for NH abundance, which is one order of magnitude lower with the old network. This large increase in our model is due to the dissociative recombination channel of forming NH, as already noted in Dislaire et al. (2012). When looking into more details, the relatively small change of the abundances of and in fact results from a combination of three effects. First, the updated rate of the reaction lowers by more than a factor of 10 the abundances of and . For ammonia, this effect is partially compensated by the updated branching ratios of the dissociative recombinations. The abundance of and that of ammonia are finally recovered when updating the rate and branching ratios of the . This reaction produces more and , thus enhancing the amount of OH and therefore the N to conversion. This demonstrates that updating all those reaction rates is essential to reproduce the abundances of nitrogen hydrides. We note that the Dislaire et al. (2012) model, based on the osu.09.2008 chemical network 222www.physics.ohio-state.edu/ eric/research.html, predicts too small abundances of all three species, which may result from the large sulphur abundance assumed by these authors, although the comparison is not direct because the two chemical networks may contain different rate coefficients for non-negligible reactions.
The impact of the new rates is further evidenced by the of and predicted by our models which are 2.3 and 0.7, respectively (see Table 3). These values are significantly larger than those obtained with the Flower et al. (2006a) network (1 and 0.3 respectively, see Table 3). It should be noted that both ratios are below the statistical values of 3 and 1, respectively, which are lower limits under thermal equilibrium. In addition, these ratios were found to depend only very weakly on the C/O value, as expected since the of nitrogen hydrides are driven by the ratio of (see section 2.4 and Fig. 4).
5 Discussion and conclusions
We have presented a new gas-phase, ortho/para, chemical network devoted to the interstellar chemistry of nitrogen under typical dark cloud physical conditions. More specifically, this work focusses on nitrogen hydrides because these species, which are linked by a small number of chemical reactions, have been observed with high accuracy with the Herschel/HIFI instrument. The absorption lines of NH, , and trace the cold, UV-shielded, and moderately dense, envelope of the IRAS 16293-2422 protostar, and therefore provide direct observational tests of the chemistry of nitrogen in such environments. Although the comparison deals with a single object, the present work aims at understanding general processes of nitrogen chemistry in dark cloud conditions.
Our network is based on the gas-phase network of Flower et al. (2006a) where the following major improvements have been implemented: i) the nitrogen chemistry was revised using the most recent experimental results, in particular for the conversion of N to N2 through radical-radical reactions, and for the dissociative recombinations of the NH(=2-4) ions; ii) we adopted recent theoretical results for the ortho-to-para conversion of H2 by H+ and H; iii) we employed the formalism of Oka (2004), as detailed in Rist et al. (2013) and Faure et al. (2013), to derive the nuclear spin branching ratios for all primary reactions involved in the formation and destruction of , , NH, , , and .
Our findings may be summarized as follows. First, we found that the abundances of the nitrogen hydrides strongly depend on the gas-phase elemental C/O ratio adopted in the model. A similar result was noted in earlier works (e.g. Terzieva & Herbst, 1998; Tassis et al., 2012), although we here provide a detailed analysis of the influence of the C/O ratio, by focussing on a smaller set of species. To summarize, the influence of the C/O ratio stems from the fact that nitrogen hydrides derive from N2 which is formed either via or . Two regimes corresponding to and are clearly identified where the N2/N ratio is larger than 1 and the abundance of ammonia is a few 10-8. In contrast, the abundances of NH and are much lower at high C/O because these radicals are efficiently destroyed by atomic carbon. Second, we have shown that increasing the elemental gas-phase abundance of sulphur significantly reduces the efficiency of the N to N2 conversion. Thus a high abundance of sulphur (i.e. 8.0) was found to reduce the abundance of several N-bearing species by up to two orders of magnitude.
The steady-state abundances predicted by our model were compared to the Herschel/HIFI observations of NH, , and , towards the low-mass protostar IRAS 16293-2422. Our chemical model reproduces well both the observed abundances and abundance ratios of the three hydrides. A key point is that our network produces more NH than , as observed. Our best model, which leads to NH:: abundance ratios of 3:1:3 (see Table 3), is obtained for a C/O ratio of 0.8 and a low sulphur abundance =8.0. Although it is consistent with the 3:1:19 observed ratios, the predicted abundance of ammonia is at the lower end of the allowed range. Higher values for are also possible but a high abundance of 8.0 is clearly excluded by our models, as well as C/O ratios outside the range . We note that at earlier times (-5 Myr), the observations can be reproduced with a similar (i.e. ) and slightly higher C/O ratios, in the range 0.9 to 1.1.
Our model calculations thus show that chemical reactive processes on dust grains are not needed to explain the gas-phase abundances of nitrogen hydrides in typical dark cloud conditions. This of course does not preclude the possibility that a fraction of atomic nitrogen can also form ammonia ices by hydrogenation on the grain mantles. This process is in fact certainly necessary to account for the high abundance of ammonia () detected in e.g. shock regions, where grain mantles are released in the gas-phase (Umemoto et al., 1999). We note that our best model corresponds to a regime where N/N. The exact amount of gaseous N2 however depends on the competition between its formation in the gas and the depletion of atomic nitrogen onto grains, which was neglected in the present work. Several nitrogenated species were shown observationally to resist depletion in cold prestellar cores, in contrast to CO and many other species. This is the case for and N2H+, CN (Tafalla et al., 2004; Crapsi et al., 2007; Hily-Blant et al., 2008), and also for HCN (and HNC), although for the latter there seems to exist some variability amongst sources (Hily-Blant et al., 2010b; Padovani et al., 2011; Pagani et al., 2012). This observational result indicates that enough atomic N is always available in the gas phase which is also slowly converted into N2. However, in similar objects, Akyilmaz et al. (2007) observed that NO disappears from the gas-phase at high densities where CN does not, which was interpreted as freeze-out onto grains. The different behaviours among N-bearing species with respect to depletion could result from a combination of several factors, such as different molecular properties (e.g. the binding energy), and/or the timescales of the gas-phase chemical reactions. Further attempts to reproduce, in a comprehensive fashion, the behaviours of the observed species, may need to consider all these aspects taking into account the time-dependent competition between gas-phase and gas-grain processes.
Gas-phase synthesis of N-hydrides is further supported by the ortho-to-para ratios of and predicted by our model. Persson et al. (2012) measured the ortho- and para-ammonia column densities in diffuse molecular clouds along the sight-lines towards the high-mass star-forming regions W49N and G10.6-0.4, and found 0.5 – 0.7. This ratio is in excellent agreement with our prediction. For , preliminary Herschel measurements indicate ortho-to-para values in the range 1.5 – 3.5 in diffuse gas along the line of sight towards G10.6-0.4 (Persson et al., private comm.), again in very good agreement with our prediction. The NH, , and abundances (relative to total hydrogen) derived by Persson et al. (2010) are 5.6, 3.0, and 3.2, respectively, or abundance ratios NH::=2:1:1. The NH and abundances are thus similar to those in the envelope surrounding IRAS 16293-2422 (see Table 3), although that of ammonia is one order of magnitude lower. Their abundance ratios are in fact similar to the prediction of our best model (see Table 3). However, our calculations unlikely apply to a warmer and more tenuous diffuse gas which requires dedicated models (gas density of and temperature of 30 K). In particular, the C/O ratio and abundance may take different values in the diffuse ISM. Photodissociation of ammonia may also play a role, as discussed by Persson et al. (2010), although we do not expect the UV to alter significantly the of and which are driven by proton exchange reactions.
The present work gives rise to several questions. First, additional observations of NH, , and in various objects are needed to confirm the gas-phase chemical processes mentioned above. The determination of the ortho-to-para ratio towards others Class 0 protostars would also be extremely useful. Another critical issue is related to the abundances of other N-bearing species such as N2H+, CN, and nitriles (e.g. HCN) in dark clouds. Observations in dark clouds are already available for these species, but were not discussed in this paper. The reason is that we believe that such a comprehensive comparison with all the observations requires first to assess the completeness of the current chemical network with respect to all those simple nitrogen-bearing species. Here, we have focussed on nitrogen hydrides, and this allowed us to understand several effects and explain various observational facts. Of course, chemistry is highly non-linear (e.g. Le Bourlot et al., 1995), and we can not exclude that in some peculiar range of parameters, new rates, e.g. in the formation of HCN, could affect the above results. However, by exploring such a broad range of initial abundances, we have been able to emphasize robust trends and processes. Our approach is really complementary to other strategies which quantify the sensitivity of chemical networks to rate uncertainties (e.g. Wakelam et al., 2010). Time-dependent aspects must also be explored, taking into account gas-grain processes, and/or including the effect of gas dynamics (e.g. Brown & Charnley, 1990; Flower et al., 2006a; Tassis et al., 2012). Concerning future improvements of our network, we are currently implementing new reaction rates and nuclear spin branching ratios for the deuterated isotopologues of several nitrogen-bearing species. Deuterated as well as 15N isotopologues were not considered in the present work. However, both are detected in the cold ISM with significant abundances. The molecular D/H and 15N/14N ratios are sensitive probes of the chemistry and future works will explore gas-phase fractionation processes and the possible link with the D and 15N-enrichments observed in Solar System objects (see e.g. Wirström et al., 2012; Hily-Blant et al., 2013a, and references therein). We note in this context the recent detection of C15N and D+ in cold prestellar cores by Hily-Blant et al. (2013b) and Cernicharo et al. (2013) respectively.
Acknowledgements.
We thank our anonymous referee for a careful reading and useful comments that improved the manuscript. This work has been supported by “Région Rhône-Alpes” (CIBLE program), the Agence Nationale de la Recherche (ANR-HYDRIDES), contract ANR-12-BS05-0011-01, and by the CNRS national program “Physico-Chimie du Milieu Interstellaire”.References
- Akyilmaz et al. (2007) Akyilmaz, M., Flower, D. R., Hily-Blant, P., Pineau des Forêts, G., & Walmsley, C. M. 2007, A&A, 462, 221
- Anicich & Huntress (1986) Anicich, V. G. & Huntress, Jr., W. T. 1986, Ap. J. Supp., 62, 553
- Asplund et al. (2009) Asplund, M., Grevesse, N., Sauval, A. J., & Scott, P. 2009, Annu. Rev. Astron. Astrophys., 47, 481
- Bacmann et al. (2010) Bacmann, A., Caux, E., Hily-Blant, P., et al. 2010, A&A, 521, L42
- Bergeat (1999) Bergeat, A. 1999, Chemical Physics Letters, 308, 7
- Bergeat et al. (2009) Bergeat, A., Hickson, K. M., Daugey, N., Caubet, P., & Costes, M. 2009, Physical Chemistry Chemical Physics, 11, 8149
- Bergin & Langer (1997) Bergin, E. A. & Langer, W. D. 1997, ApJ, 486, 316
- Bergin & Tafalla (2007) Bergin, E. A. & Tafalla, M. 2007, Annu. Rev. Astron. Astrophys., 45, 339
- Boogert et al. (2011) Boogert, A. C. A., Huard, T. L., Cook, A. M., et al. 2011, ApJ, 729, 92
- Bottinelli et al. (2010) Bottinelli, S., Boogert, A. C. A., Bouwman, J., et al. 2010, ApJ, 718, 1100
- Brinch & Hogerheijde (2010) Brinch, C. & Hogerheijde, M. R. 2010, A&A, 523, A25
- Brown & Charnley (1990) Brown, P. D. & Charnley, S. B. 1990, MNRAS, 244, 432
- Cartledge et al. (2004) Cartledge, S. I. B., Lauroesch, J. T., Meyer, D. M., & Sofia, U. J. 2004, ApJ, 613, 1037
- Caselli et al. (1998) Caselli, P., Walmsley, C. M., Terzieva, R., & Herbst, E. 1998, ApJ, 499, 234
- Ceccarelli et al. (2010) Ceccarelli, C., Bacmann, A., Boogert, A., et al. 2010, A&A, 521, L22
- Cernicharo et al. (2013) Cernicharo, J., Tercero, B., Fuente, A., et al. 2013, ApJ, 771, L10
- Charnley & Rodgers (2002) Charnley, S. B. & Rodgers, S. D. 2002, ApJ, 569, L133
- Chastaing et al. (2000) Chastaing, D., Le Picard, S. D., & Sims, I. R. 2000, J. Chem. Phys., 112, 8466
- Cheung et al. (1968) Cheung, A. C., Rank, D. M., Townes, C. H., Thornton, D. D., & Welch, W. J. 1968, Physical Review Letters, 21, 1701
- Crabtree et al. (2011) Crabtree, K. N., Indriolo, N., Kreckel, H., Tom, B. A., & McCall, B. J. 2011, ApJ, 729, 15
- Crapsi et al. (2007) Crapsi, A., Caselli, P., Walmsley, M. C., & Tafalla, M. 2007, A&A, 470, 221
- Crimier et al. (2010) Crimier, N., Ceccarelli, C., Maret, S., et al. 2010, ArXiv e-prints
- Crutcher (2012) Crutcher, R. M. 2012, Annu. Rev. Astron. Astrophys., 50, 29
- Dalgarno et al. (1973) Dalgarno, A., Black, J. H., & Weisheit, J. C. 1973, Astrophys. Lett., 14, 77
- Daranlot et al. (2012) Daranlot, J., Hincelin, U., Bergeat, A., et al. 2012, Proceedings of the National Academy of Science, 109, 10233
- Daranlot et al. (2011) Daranlot, J., Jorfi, M., Xie, C., et al. 2011, Science, 334, 1538
- D’Hendecourt et al. (1985) D’Hendecourt, L. B., Allamandola, L. J., & Greenberg, J. M. 1985, A&A, 152, 130
- Dislaire et al. (2012) Dislaire, V., Hily-Blant, P., Faure, A., et al. 2012, A&A, 537, A20
- Dos Santos et al. (2007) Dos Santos, S. F., Kokoouline, V., & Greene, C. H. 2007, J. Chem. Phys., 127, 124309
- Dumouchel et al. (2012) Dumouchel, F., Kłos, J., Toboła, R., et al. 2012, J. Chem. Phys., 137, 114306
- Faure et al. (2013) Faure, A., Hily-Blant, P., Le Gal, R., Rist, C., & Pineau des Forêts, G. 2013, ApJ, 770, L2
- Flower et al. (2005) Flower, D. R., Pineau des Forêts, G., & Walmsley, C. M. 2005, A&A, 436, 933
- Flower et al. (2006a) Flower, D. R., Pineau des Forêts, G., & Walmsley, C. M. 2006a, A&A, 456, 215
- Flower et al. (2006b) Flower, D. R., Pineau des Forêts, G., & Walmsley, C. M. 2006b, A&A, 449, 621
- Gerin et al. (1992) Gerin, M., Viala, Y., Pauzat, F., & Ellinger, Y. 1992, A&A, 266, 463
- Gerlich (1993) Gerlich, D. 1993, J. Chem. Soc. Faraday Trans., 89(13), 2199
- Gibb et al. (2000) Gibb, E. L., Whittet, D. C. B., Schutte, W. A., et al. 2000, ApJ, 536, 347
- Goicoechea et al. (2004) Goicoechea, J. R., Rodríguez-Fernández, N. J., & Cernicharo, J. 2004, ApJ, 600, 214
- Graedel et al. (1982) Graedel, T. E., Langer, W. D., & Frerking, M. A. 1982, Ap. J. Supp., 48, 321
- Grussie et al. (2012) Grussie, F., Berg, M. H., Crabtree, K. N., et al. 2012, ApJ, 759, 21
- Hasegawa & Herbst (1993) Hasegawa, T. I. & Herbst, E. 1993, MNRAS, 261, 83
- Herbst et al. (1987) Herbst, E., Defrees, D. J., & McLean, A. D. 1987, ApJ, 321, 898
- Herbst & Klemperer (1973) Herbst, E. & Klemperer, W. 1973, ApJ, 185, 505
- Herbst et al. (2000) Herbst, E., Terzieva, R., & Talbi, D. 2000, Monthly Notices of The Royal Astronomical Society, 311, 869
- Hidaka et al. (2011) Hidaka, H., Watanabe, M., Kouchi, A., & Watanabe, N. 2011, Physical Chemistry Chemical Physics (Incorporating Faraday Transactions), 13, 15798
- Hily-Blant et al. (2013a) Hily-Blant, P., Bonal, L., Faure, A., & Quirico, E. 2013a, Icarus, 223, 582
- Hily-Blant et al. (2010a) Hily-Blant, P., Maret, S., Bacmann, A., et al. 2010a, A&A, 521, L52
- Hily-Blant et al. (2013b) Hily-Blant, P., Pineau des Forêts, G., Faure, A., Le Gal, R., & Padovani, M. 2013b, A&A, 557, A65
- Hily-Blant et al. (2008) Hily-Blant, P., Walmsley, M., Pineau des Forêts, G., & Flower, D. 2008, A&A, 480, L5
- Hily-Blant et al. (2010b) Hily-Blant, P., Walmsley, M., Pineau des Forêts, G., & Flower, D. 2010b, A&A, 513, A41
- Hirota et al. (1998) Hirota, T., Yamamoto, S., Mikami, H., & Ohishi, M. 1998, ApJ, 503, 717
- Ho & Townes (1983) Ho, P. T. P. & Townes, C. H. 1983, Annu. Rev. Astron. Astrophys., 21, 239
- Hogerheijde & van der Tak (2000) Hogerheijde, M. R. & van der Tak, F. F. S. 2000, A&A, 362, 697
- Hollenbach & Salpeter (1971) Hollenbach, D. & Salpeter, E. E. 1971, ApJ, 163, 155
- Honvault et al. (2011) Honvault, P., Jorfi, M., González-Lezana, T., Faure, A., & Pagani, L. 2011, Physical Chemistry Chemical Physics (Incorporating Faraday Transactions), 13, 19089
- Honvault et al. (2012) Honvault, P., Jorfi, M., González-Lezana, T., Faure, A., & Pagani, L. 2012, Physical Review Letters, 108, 109903
- Hugo et al. (2009) Hugo, E., Asvany, O., & Schlemmer, S. 2009, J. Chem. Phys., 130, 164302
- Jenkins (2009) Jenkins, E. B. 2009, ApJ, 700, 1299
- Jensen et al. (2000) Jensen, M. J., Bilodeau, R. C., Safvan, C. P., et al. 2000, ApJ, 543, 764
- Jorfi & Honvault (2009) Jorfi, M. & Honvault, P. 2009, Journal of Physical Chemistry A, 113, 10648
- Jorfi et al. (2009) Jorfi, M., Honvault, P., & Halvick, P. 2009, Chemical Physics Letters, 471, 65
- Knauth et al. (2004) Knauth, D. C., Andersson, B.-G., McCandliss, S. R., & Warren Moos, H. 2004, Nature, 429, 636
- Le Bourlot (1991) Le Bourlot, J. 1991, A&A, 242, 235
- Le Bourlot et al. (1995) Le Bourlot, J., Pineau des Forêts, G., Roueff, E., & Flower, D. R. 1995, A&A, 302, 870
- Li et al. (2013) Li, X., Heays, A. N., Visser, R., et al. 2013, A&A, 555, A14
- Loinard et al. (2013) Loinard, L., Zapata, L. A., Rodríguez, L. F., et al. 2013, MNRAS, 430, L10
- Maret et al. (2006) Maret, S., Bergin, E. A., & Lada, C. J. 2006, Nature, 442, 425
- Maret et al. (2009) Maret, S., Faure, A., Scifoni, E., & Wiesenfeld, L. 2009, MNRAS, 399, 425
- Marquette et al. (1988) Marquette, J. B., Rebrion, C., & Rowe, B. R. 1988, J. Chem. Phys., 89, 2041
- Marquette et al. (1989) Marquette, J. B., Rebrion, C., & Rowe, B. R. 1989, A&A, 213, L29
- McCall et al. (2004) McCall, B. J., Huneycutt, A. J., Saykally, R. J., et al. 2004, Phys. Rev. A, 70, 052716
- Mendes et al. (2012) Mendes, M. B., Buhr, H., Berg, M. H., et al. 2012, ApJ, 746, L8
- Mitchell (1990) Mitchell, B. 1990, Phys. Rep., 186, 215
- Nieva & Przybilla (2012) Nieva, M.-F. & Przybilla, N. 2012, A&A, 539, A143
- Öjekull et al. (2004) Öjekull, J., Andersson, P. U., Någård, M. B., et al. 2004, J. Chem. Phys., 120, 7391
- Oka (2004) Oka, T. 2004, Journal of Molecular Spectroscopy, 228, 635
- Pachucki & Komasa (2008) Pachucki, K. & Komasa, J. 2008, Phys. Rev. A, 77, 030501
- Padovani et al. (2011) Padovani, M., Walmsley, C. M., Tafalla, M., Hily-Blant, P., & Pineau des Forêts, G. 2011, A&A, 534, A77
- Pagani et al. (2007) Pagani, L., Bacmann, A., Cabrit, S., & Vastel, C. 2007, A&A, 467, 179
- Pagani et al. (2012) Pagani, L., Bourgoin, A., & Lique, F. 2012, A&A, 548, L4
- Pagani et al. (2009) Pagani, L., Vastel, C., Hugo, E., et al. 2009, A&A, 494, 623
- Persson et al. (2010) Persson, C. M., Black, J. H., Cernicharo, J., et al. 2010, A&A, 521, L45+
- Persson et al. (2012) Persson, C. M., De Luca, M., Mookerjea, B., et al. 2012, A&A, 543, A145
- Pineau des Forêts et al. (1990) Pineau des Forêts, G., Roueff, E., & Flower, D. R. 1990, MNRAS, 244, 668
- Prasad & Huntress (1980) Prasad, S. S. & Huntress, Jr., W. T. 1980, Ap. J. Supp., 43, 1
- Przybilla et al. (2008) Przybilla, N., Nieva, M.-F., & Butler, K. 2008, ApJ, 688, L103
- Raich & Good (1964) Raich, J. C. & Good, Jr., R. H. 1964, ApJ, 139, 1004
- Rist et al. (2013) Rist, C., Faure, A., Hily-Blant, P., & Le Gal, R. 2013, Journal of Physical Chemistry A, 117, 9800
- Ruffle et al. (1999) Ruffle, D. P., Hartquist, T. W., Caselli, P., & Williams, D. A. 1999, MNRAS, 306, 691
- Sandford et al. (2001) Sandford, S. A., Bernstein, M. P., Allamandola, L. J., Goorvitch, D., & Teixeira, T. C. V. S. 2001, ApJ, 548, 836
- Sarrasin et al. (2010) Sarrasin, E., Abdallah, D. B., Wernli, M., et al. 2010, MNRAS, 404, 518
- Sipilä et al. (2013) Sipilä, O., Caselli, P., & Harju, J. 2013, A&A, 554, A92
- Sofia et al. (2011) Sofia, U. J., Parvathi, V. S., Babu, B. R. S., & Murthy, J. 2011, Astron.J., 141, 22
- Suzuki et al. (1992) Suzuki, H., Yamamoto, S., Ohishi, M., et al. 1992, ApJ, 392, 551
- Tafalla et al. (2004) Tafalla, M., Myers, P. C., Caselli, P., & Walmsley, C. M. 2004, A&A, 416, 191
- Tassis & Mouschovias (2004) Tassis, K. & Mouschovias, T. C. 2004, ApJ, 616, 283
- Tassis et al. (2012) Tassis, K., Willacy, K., Yorke, H. W., & Turner, N. J. 2012, ApJ, 753, 29
- Terzieva & Herbst (1998) Terzieva, R. & Herbst, E. 1998, ApJ, 501, 207
- Thaddeus (1972) Thaddeus, P. 1972, Annu. Rev. Astron. Astrophys., 10, 305
- Thomas et al. (2005) Thomas, R. D., Hellberg, F., Neau, A., et al. 2005, Phys. Rev. A, 71, 032711
- Tieftrunk et al. (1994) Tieftrunk, A., Pineau des Forêts, G., Schilke, P., & Walmsley, C. M. 1994, A&A, 289, 579
- Tielens & Hagen (1982) Tielens, A. G. G. M. & Hagen, W. 1982, A&A, 114, 245
- Troscompt et al. (2009) Troscompt, N., Faure, A., Maret, S., et al. 2009, A&A, 506, 1243
- Umemoto et al. (1999) Umemoto, T., Mikami, H., Yamamoto, S., & Hirano, N. 1999, ApJ, 525, L105
- van Dishoeck & Blake (1998) van Dishoeck, E. F. & Blake, G. A. 1998, Annu. Rev. Astron. Astrophys., 36, 317
- van Dishoeck et al. (1995) van Dishoeck, E. F., Blake, G. A., Jansen, D. J., & Groesbeck, T. D. 1995, ApJ, 447, 760
- Vigren et al. (2012) Vigren, E., Zhaunerchyk, V., Hamberg, M., et al. 2012, ApJ, 757, 34
- Wakelam et al. (2012) Wakelam, V., Herbst, E., Loison, J.-C., et al. 2012, Ap. J. Supp., 199, 21
- Wakelam et al. (2005) Wakelam, V., Selsis, F., Herbst, E., & Caselli, P. 2005, A&A, 444, 883
- Wakelam et al. (2010) Wakelam, V., Smith, I. W. M., Herbst, E., et al. 2010, Space Sci. Rev., 156, 13
- Walmsley et al. (2004) Walmsley, C. M., Flower, D. R., & Pineau des Forêts, G. 2004, A&A, 418, 1035
- Whittet (2010) Whittet, D. C. B. 2010, ApJ, 710, 1009
- Whittet et al. (1983) Whittet, D. C. B., Bode, M. F., Baines, D. W. T., Longmore, A. J., & Evans, A. 1983, Nature, 303, 218
- Wirström et al. (2012) Wirström, E. S., Charnley, S. B., Cordiner, M. A., & Milam, S. N. 2012, ApJ, 757, L11
- Womack et al. (1992) Womack, M., Ziurys, L. M., & Wyckoff, S. 1992, ApJ, 393, 188
- Zymak et al. (2013) Zymak, I., Hejduk, M., Mulin, D., et al. 2013, ApJ, 768, 86
Appendix A Radiative transfer modelling
Our one-dimensional spherical source model consists in two-layers with uniform density and kinetic temperature. The inner layer, close to the protostar, has a radius of AU, a dust temperature of 30 K, and a total (front + back) column density – hence, a density – and we assume this layer does not contain gas-phase nitrogen hydrides. Furthermore, the dust opacity is assumed to vary as a power-law of the wavelenght, with a exponent of 2.83 and a dust opacity at 250 GHz of 1 g/cm2. The values of and were adjusted so that the continuum observed with HIFI towards that source is well reproduced by our model.
The external layer has the same column density. Hence, the total column density is 1.3 or 140 magnitudes of visual extinction. We modelled the emergent telescope-convolved spectrum of all the observed transitions of ammonia, by solving the radiative transfer with the Monte-Carlo code RATRAN (Hogerheijde & van der Tak 2000). The collisional rates for - are taken from Maret et al. (2009). The of was fixed at 0.7, as predicted by our chemistry model. The free parameters are the density, the gas temperature, and the column density in the external, absorbing, layer. Note the radii is set by the column density and the density of that layer. The emergent spectra were then fitted simultaneously to match the observed ones, and a is used to select to best fit model. We found that the self-absorbed profile of the transition tightly constraints the density in the outer layer to be , as for higher densities the predicted profile shows no longer absorption. As a result, the absorbing ammonia molecules reside in the most external layer of the circumbinary envelope of IRAS 16293-2422.
An ensemble of solutions is then found for the ammonia column density and the kinetic temperature, with a best agreement corresponding to N()=1.4 and 11 K respectively (see Fig. 6). This column density is a factor of 2.5 below the lower limit of Hily-Blant et al. (2010a). A cross-check of the best agreement was performed by computing the emergent hyperfine spectra of NH. To this aim, we used the LIME radiative transfer code (Brinch & Hogerheijde 2010), which takes line blending into account. The collisional rates for NH- are scaled from the NH-He rates of Dumouchel et al. (2012) by applying the standard reduced mass ratio of 1.33. The model that best reproduces the three hyperfine multiplets of NH (see Fig. 7) has a column density of NH in the foreground layer of 2.0, in excellent agreement with the determination of Bacmann et al. (2010) based on the “HFS” method of the CLASS software. Therefore this simple 2-layers model succesfully reproduces both the NH and NH3 spectra. The (o) column density was not re-analyzed owing to the lack of collisional rates. However, the column density of (o) was derived by Hily-Blant et al. (2010a) using the same method and under the same assumptions as those for NH by Bacmann et al. (2010), and is thus expected to be reliable as well. In addition, here, we assumed an of 2 to estimate the total column density of .
Appendix B Chemical updates
| Chemical reactions a𝑎aa𝑎ao, and p stand for ortho, and para states respectively. As a spherical top with four identical protons, the ammonium ion exists in three nuclear spin states noted as in Faure et al. (2013): para (I = 0), meta (I = 2), and ortho (I = 1). We note that the meta and ortho species are inverted in Rist et al. (2013). | b𝑏bb𝑏bRates have been computed for a 10 K temperature. | References | NSBRc𝑐cc𝑐cNSBR stands for nuclear-spin branching ratio. These were combined with the overall rate coefficients taken from the cited references, e.g. Prasad & Huntress (1980). The integer ratios like e.g. 28/5/12 are normalized NSBR and stand for (28/5)/12 i.e. 28/60. | ||||||||
|---|---|---|---|---|---|---|---|---|---|---|---|
| Formation of H | |||||||||||
| H(o) | H2(o) | H(o) | H | 1.40(-9) | 0.00 | 0.00 | 1.40(-9) | 1 | 2/3 | ||
| H(o) | H2(o) | H(p) | H | 7.00(-10) | 0.00 | 0.00 | 7.00(-10) | 1 | 1/3 | ||
| H(o) | H2(p) | H(o) | H | 7.00(-10) | 0.00 | 0.00 | 7.00(-10) | 1 | 1/3 | ||
| H(o) | H2(p) | H(p) | H | 1.40(-9) | 0.00 | 0.00 | 1.40(-9) | 1 | 2/3 | ||
| H(p) | H2(o) | H(o) | H | 7.00(-10) | 0.00 | 0.00 | 7.00(-10) | 1 | 1/3 | ||
| H(p) | H2(o) | H(p) | H | 1.40(-9) | 0.00 | 0.00 | 1.40(-9) | 1 | 2/3 | ||
| H(p) | H2(p) | H(p) | H | 2.10(-9) | 0.00 | 0.00 | 2.10(-9) | 1 | 1 | ||
| Main ortho-to-para conversion reactions of H2 | |||||||||||
| H(o) | H2(o) | H(o) | H2(p) | 9.67(-11) | 0.00 | -0.14 | 9.81(-11) | 2 | |||
| H(o) | H2(o) | H(p) | H2(o) | 4.00(-10) | 0.00 | -0.19 | 4.08(-10) | 2 | |||
| H(o) | H2(o) | H(p) | H2(p) | 1.04(-10) | 0.00 | -0.14 | 1.04(-10) | 2 | |||
| H(o) | H2(p) | H(o) | H2(o) | 8.84(-10) | 0.00 | 170 | 3.66(-17) | 2 | |||
| H(o) | H2(p) | H(p) | H2(o) | 1.50(-9) | 0.00 | 136.2 | 1.82(-15) | 2 | |||
| H(p) | H2(o) | H(o) | H2(o) | 8.03(-10) | 0.00 | 32.6 | 3.08(-11) | 2 | |||
| H(p) | H2(o) | H(o) | H2(p) | 3.46(-10) | 0.00 | -0.69 | 3.71(-10) | 2 | |||
| H(p) | H2(o) | H(p) | H2(p) | 2.98(-10) | 0.00 | -0.69 | 3.19(-10) | 2 | |||
| H(p) | H2(p) | H(p) | H2(p) | 5.88(-10) | 0.00 | 198.2 | 1.45(-18) | 2 | |||
| H(p) | H2(p) | H(p) | H2(p) | 8.16(-10) | 0.00 | 164.9 | 5.63(-17) | 2 | |||
| H+ | H2(o) | H+ | H2(p) | 1.82(-10) | 0.13 | -0.02 | 1.17(-10) | 3 | |||
| H+ | H2(p) | H+ | H2(o) | 1.64(-9) | 0.13 | 170.5 | 4.15(-17) | 3 | |||
| HCO+ | H2(o) | HCO+ | H2(p) | 1.27(-10) | 0.00 | 0.00 | 1.27(-10) | 4 | |||
| HCO+ | H2(p) | HCO+ | H2(o) | 1.14(-9) | 0.00 | 170.5 | 4.49(-17) | 4 | |||
| Nitrogen hydrides formation | |||||||||||
| N+ | H2(o) | NH+ | H | 4.20(-10) | -0.15 | 44.1 | 8.50(-12) | 5 | |||
| N+ | H2(p) | NH+ | H | 8.35(-10) | 0.00 | 168.5 | 4.02(-17) | 5 | |||
| NH+ | H2(o) | NH(o) | H | 1.06(-9) | 0.00 | 0.00 | 1.06(-9) | 6 | 5/6 | ||
| NH+ | H2(o) | NH(p) | H | 2.13(-10) | 0.00 | 0.00 | 2.13(-10) | 6 | 1/6 | ||
| NH+ | H2(p) | NH(o) | H | 6.38(-10) | 0.00 | 0.00 | 6.38(-10) | 6 | 1/2 | ||
| NH+ | H2(p) | NH(p) | H | 6.38(-10) | 0.00 | 0.00 | 6.38(-10) | 6 | 1/2 | ||
| NH(o) | H2(o) | NH(o) | H | 1.80(-10) | 0.00 | 0.00 | 1.80(-10) | 6 | 2/3 | ||
| NH(o) | H2(o) | NH(p) | H | 9.00(-11) | 0.00 | 0.00 | 9.00(-11) | 6 | 1/3 | ||
| NH(o) | H2(p) | NH(o) | H | 9.00(-11) | 0.00 | 0.00 | 9.00(-11) | 6 | 1/3 | ||
| NH(o) | H2(p) | NH(p) | H | 1.80(-10) | 0.00 | 0.00 | 1.80(-10) | 6 | 2/3 | ||
| NH(p) | H2(o) | NH(o) | H | 9.00(-11) | 0.00 | 0.00 | 9.00(-11) | 6 | 1/3 | ||
| NH(p) | H2(o) | NH(p) | H | 1.80(-10) | 0.00 | 0.00 | 1.80(-10) | 6 | 2/3 | ||
| NH(p) | H2(p) | NH(p) | H | 2.70(-10) | 0.00 | 0.00 | 2.70(-10) | 6 | 1 | ||
| NH(o) | H2(o) | NH(I=2) | H | 1.40(-12) | 0.00 | 0.00 | 1.40(-12) | 6 | 7/12 | ||
| NH(o) | H2(o) | NH(I=1) | H | 8.40(-13) | 0.00 | 0.00 | 8.40(-13) | 6 | 21/60 | ||
| NH(o) | H2(o) | NH(I=0) | H | 1.60(-13) | 0.00 | 0.00 | 1.60(-13) | 6 | 1/15 | ||
| NH(o) | H2(p) | NH(I=2) | H | 1.80(-12) | 0.00 | 0.00 | 1.80(-12) | 6 | 1/4 | ||
| NH(o) | H2(p) | NH(I=1) | H | 6.00(-13) | 0.00 | 0.00 | 6.00(-13) | 6 | 3/4 | ||
| NH(o) | H2(p) | NH(I=0) | H | 0.00 | 0.00 | 0.00 | 0.00 | 6 | 0 | ||
| NH(p) | H2(o) | NH(I=2) | H | 4.00(-13) | 0.00 | 0.00 | 4.00(-13) | 6 | 1/6 | ||
| NH(p) | H2(o) | NH(I=1) | H | 1.68(-12) | 0.00 | 0.00 | 1.68(-12) | 6 | 21/30 | ||
| NH(p) | H2(o) | NH(I=0) | H | 3.20(-13) | 0.00 | 0.00 | 3.20(-13) | 6 | 2/15 | ||
| NH(p) | H2(p) | NH(I=2) | H | 0.00 | 0.00 | 0.00 | 0.00 | 6 | 0 | ||
| NH(p) | H2(p) | NH(I=1) | H | 1.44(-12) | 0.00 | 0.00 | 1.44(-12) | 6 | 3/5 | ||
| NH(p) | H2(p) | NH(I=0) | H | 9.60(-13) | 0.00 | 0.00 | 9.60(-13) | 6 | 2/5 | ||
| Destruction of Nitrogen hydrides by H, HCO+ & N2H+ | |||||||||||
| H(p) | NH | NH(p) | H2(p) | 1.63(-10) | 0.00 | 0.00 | 1.63(-10) | 7 | 1/8 | ||
| H(p) | NH | NH(o) | H2(p) | 3.25(-10) | 0.00 | 0.00 | 3.25(-10) | 7 | 1/4 | ||
| H(p) | NH | NH(p) | H2(o) | 3.25(-10) | 0.00 | 0.00 | 3.25(-10) | 7 | 1/4 | ||
| H(p) | NH | NH(o) | H2(o) | 4.88(-10) | 0.00 | 0.00 | 4.88(-10) | 7 | 3/8 | ||
| H(p) | NH2(p) | NH(p) | H2(p) | 7.20(-10) | 0.00 | 0.00 | 7.20(-10) | 7 | 8/5/4 | ||
| H(p) | NH2(p) | NH(p) | H2(o) | 7.20(-10) | 0.00 | 0.00 | 7.20(-10) | 7 | 8/5/4 | ||
| H(p) | NH2(p) | NH(o) | H2(o) | 3.60(-10) | 0.00 | 0.00 | 3.60(-10) | 7 | 4/5/4 | ||
| H(p) | NH2(o) | NH(p) | H2(o) | 8.40(-10) | 0.00 | 0.00 | 8.40(-10) | 7 | 28/5/12 | ||
| H(p) | NH2(o) | NH(o) | H2(o) | 4.20(-10) | 0.00 | 0.00 | 4.20(-10) | 7 | 14/5/12 | ||
| H(p) | NH2(o) | NH(p) | H2(p) | 2.40(-10) | 0.00 | 0.00 | 2.40(-10) | 7 | 8/5/12 | ||
| H(p) | NH2(o) | NH(o) | H2(p) | 3.00(-10) | 0.00 | 0.00 | 3.00(-10) | 7 | 2/12 | ||
| H(p) | NH3(p) | NH(I=0) | H2(p) | 9.10(-10) | 0.00 | 0.00 | 9.10(-10) | 8 | 8/5/16 | ||
| H(p) | NH3(p) | NH(I=1) | H2(p) | 2.28(-9) | 0.00 | 0.00 | 2.28(-9) | 8 | 4/16 | ||
| H(p) | NH3(p) | NH(I=0) | H2(o) | 1.52(-9) | 0.00 | 0.00 | 1.52(-9) | 8 | 8/3/16 | ||
| H(p) | NH3(p) | NH(I=1) | H2(o) | 3.64(-9) | 0.00 | 0.00 | 3.64(-9) | 8 | 32/5/16 | ||
| H(p) | NH3(p) | NH(I=2) | H2(o) | 7.58(-10) | 0.00 | 0.00 | 7.58(-10) | 8 | 4/3/16 | ||
| H(p) | NH3(o) | NH(I=0) | H2(o) | 7.58(-10) | 0.00 | 0.00 | 7.58(-10) | 8 | 4/3/16 | ||
| H(p) | NH3(o) | NH(I=1) | H2(o) | 4.55(-9) | 0.00 | 0.00 | 4.55(-9) | 8 | 8/16 | ||
| H(p) | NH3(o) | NH(I=2) | H2(o) | 1.52(-9) | 0.00 | 0.00 | 1.52(-9) | 8 | 8/3/16 | ||
| H(p) | NH3(o) | NH(I=2) | H2(p) | 1.14(-9) | 0.00 | 0.00 | 1.14(-9) | 8 | 2/16 | ||
| H(p) | NH3(o) | NH(I=1) | H2(p) | 1.14(-9) | 0.00 | 0.00 | 1.14(-9) | 8 | 2/16 | ||
| H(o) | NH | NH(p) | H2(o) | 1.63(-10) | 0.00 | 0.00 | 1.63(-10) | 7 | 1/8 | ||
| H(o) | NH | NH(o) | H2(o) | 9.75(-10) | 0.00 | 0.00 | 9.75(-10) | 7 | 6/8 | ||
| H(o) | NH | NH(o) | H2(p) | 1.63(-10) | 0.00 | 0.00 | 1.63(-10) | 7 | 1/8 | ||
| H(o) | NH2(p) | NH(o) | H2(p) | 4.50(-10) | 0.00 | 0.00 | 4.50(-10) | 7 | 1/4 | ||
| H(o) | NH2(p) | NH(p) | H2(o) | 9.00(-10) | 0.00 | 0.00 | 9.00(-10) | 7 | 2/4 | ||
| H(o) | NH2(p) | NH(o) | H2(o) | 4.50(-10) | 0.00 | 0.00 | 4.50(-10) | 7 | 1/4 | ||
| H(o) | NH2(o) | NH(p) | H2(p) | 1.20(-10) | 0.00 | 0.00 | 1.20(-10) | 7 | 4/5/12 | ||
| H(o) | NH2(o) | NH(p) | H2(o) | 4.20(-10) | 0.00 | 0.00 | 4.20(-10) | 7 | 14/5/12 | ||
| H(o) | NH2(o) | NH(o) | H2(p) | 1.50(-10) | 0.00 | 0.00 | 1.50(-10) | 7 | 1/12 | ||
| H(o) | NH2(o) | NH(o) | H2(o) | 1.11(-9) | 0.00 | 0.00 | 1.11(-9) | 7 | 37/5/12 | ||
| H(o) | NH3(p) | NH(I=1) | H2(p) | 1.14(-9) | 0.00 | 0.00 | 1.14(-9) | 8 | 2/16 | ||
| H(o) | NH3(p) | NH(I=2) | H2(p) | 1.14(-9) | 0.00 | 0.00 | 1.14(-9) | 8 | 2/16 | ||
| H(o) | NH3(p) | NH(I=0) | H2(o) | 7.58(-10) | 0.00 | 0.00 | 7.58(-10) | 8 | 4/3/16 | ||
| H(o) | NH3(p) | NH(I=1) | H2(o) | 4.55(-9) | 0.00 | 0.00 | 4.55(-9) | 8 | 8/16 | ||
| H(o) | NH3(p) | NH(I=2) | H2(o) | 1.52(-9) | 0.00 | 0.00 | 1.52(-9) | 8 | 8/3/16 | ||
| H(o) | NH3(o) | NH(I=0) | H2(p) | 2.28(-10) | 0.00 | 0.00 | 2.28(-10) | 8 | 2/5/16 | ||
| H(o) | NH3(o) | NH(I=1) | H2(p) | 5.69(-10) | 0.00 | 0.00 | 5.69(-10) | 8 | 1/16 | ||
| H(o) | NH3(o) | NH(I=2) | H2(p) | 5.69(-10) | 0.00 | 0.00 | 5.69(-10) | 8 | 1/16 | ||
| H(o) | NH3(o) | NH(I=0) | H2(o) | 3.79(-10) | 0.00 | 0.00 | 3.79(-10) | 8 | 2/3/16 | ||
| H(o) | NH3(o) | NH(I=1) | H2(o) | 2.62(-9) | 0.00 | 0.00 | 2.62(-9) | 8 | 23/5/16 | ||
| H(o) | NH3(o) | NH(I=2) | H2(o) | 4.74(-9) | 0.00 | 0.00 | 4.74(-9) | 8 | 25/3/16 | ||
| HCO+ | NH | NH(p) | CO | 1.60(-10) | 0.00 | 0.00 | 1.60(-10) | 7 | 1/4 | ||
| HCO+ | NH | NH(o) | CO | 4.80(-10) | 0.00 | 0.00 | 4.80(-10) | 7 | 3/4 | ||
| HCO+ | NH2(p) | NH(p) | CO | 8.90(-10) | 0.00 | 0.00 | 8.90(-10) | 7 | 1/1 | ||
| HCO+ | NH2(o) | NH(p) | CO | 3.00(-10) | 0.00 | 0.00 | 3.00(-10) | 7 | 1/3 | ||
| HCO+ | NH2(o) | NH(o) | CO | 5.90(-10) | 0.00 | 0.00 | 5.90(-10) | 7 | 2/3 | ||
| HCO+ | NH3(p) | NH(I=0) | CO | 4.80(-10) | 0.00 | 0.00 | 4.80(-10) | 6 | 1/4 | ||
| HCO+ | NH3(p) | NH(I=1) | CO | 1.40(-9) | 0.00 | 0.00 | 1.40(-9) | 6 | 3/4 | ||
| HCO+ | NH3(o) | NH(I=1) | CO | 7.10(-10) | 0.00 | 0.00 | 7.10(-10) | 6 | 3/8 | ||
| HCO+ | NH3(o) | NH(I=2) | CO | 1.20(-9) | 0.00 | 0.00 | 1.20(-9) | 6 | 5/8 | ||
| N2H+ | NH3(p) | NH(I=0) | N2 | 5.75(-10) | 0.00 | 0.00 | 5.75(-10) | 6 | 1/4 | ||
| N2H+ | NH3(p) | NH(I=1) | N2 | 1.73(-9) | 0.00 | 0.00 | 1.73(-9) | 6 | 3/4 | ||
| N2H+ | NH3(o) | NH(I=2) | N2 | 8.63(-10) | 0.00 | 0.00 | 8.63(-10) | 6 | 3/8 | ||
| N2H+ | NH3(o) | NH(I=1) | N2 | 1.43(-9) | 0.00 | 0.00 | 1.43(-9) | 6 | 5/8 | ||
| H(o) | O | OH+ | H2(o) | 7.98(-10) | -0.156 | 1.41 | 1.18(-9) | 9 | 1 | ||
| H(o) | O | H2O+ | H | 3.42(-10) | -0.156 | 1.41 | 5.05(-10) | 9 | |||
| H(p) | O | OH+ | H2(o) | 3.99(-10) | -0.156 | 1.41 | 5.89(-10) | 9 | 1/2 | ||
| H(p) | O | OH+ | H2(p) | 3.99(-10) | -0.156 | 1.41 | 5.89(-10) | 9 | 1/2 | ||
| H(p) | O | H2O+ | H | 3.42(-10) | -0.156 | 1.41 | 5.05(-10) | 9 | |||
(1) Langevin rate: 2.10 ; (2) Hugo et al. (2009); (3) Honvault et al. (2011); (4) Langevin rate: 1.52 ; (5) Dislaire et al. (2012); (6) Anicich & Huntress (1986); (7) Prasad & Huntress (1980);(8) Marquette et al. (1989);(9) datasheet by Ian Smith from KIDAd𝑑dd𝑑dWakelam et al. (2012).
| Reactions | b𝑏bb𝑏bRates have been computed for a 10 K temperature. | References | NSBRc𝑐cc𝑐cNSBR stands for nuclear-spin branching ratio. These were combined with the overall rate coefficients taken from the cited references, e.g. Dos Santos et al. (2007). | ||||||||
|---|---|---|---|---|---|---|---|---|---|---|---|
| DR of H | |||||||||||
| H(o) | e- | H2(o) | H | 2.51(-8) | 0.16 | -1.01 | 1.61(-8) | 1,2 | 1 | ||
| H(o) | e- | H | H | H | 4.87(-8) | 0.16 | -1.01 | 3.13(-8) | 1,2 | ||
| H(p) | e- | H2(o) | H | 0.92(-8) | -0.73 | 0.98 | 9.94e(-8) | 1,2 | 1/2 | ||
| H(p) | e- | H2(p) | H | 0.92(-8) | -0.73 | 0.98 | 9.94e(-8) | 1,2 | 1/2 | ||
| H(p) | e- | H | H | H | 3.56(-8) | -0.73 | 0.98 | 3.86(-7) | 1,2 | ||
| DR of Nitrogen hydrides | |||||||||||
| N2H+ | N2 | H | 2.77(-7) | -0.50 | 0.00 | 3.43(-6) | 3 | ||||
| N2H+ | NH | N | 2.09(-8) | -0.50 | 0.00 | 2.59(-7) | 3 | ||||
| NH(o) | NH | H | 1.17(-7) | -0.50 | 0.00 | 6.41(-7) | 4,5 | ||||
| NH(p) | NH | H | 1.17(-7) | -0.50 | 0.00 | 6.41(-7) | 4,5 | ||||
| NH(o) | N | H | H | 1.71(-7) | -0.50 | 0.00 | 9.37(-7) | 4,5 | |||
| NH(p) | N | H | H | 1.71(-7) | -0.50 | 0.00 | 9.37(-7) | 4,5 | |||
| NH(o) | N | H2(o) | 1.20(-8) | -0.50 | 0.00 | 6.57(-8) | 4,5 | ||||
| NH(p) | N | H2(p) | 1.20(-8) | -0.50 | 0.00 | 6.57(-8) | 4,5 | ||||
| NH(p) | NH2(p) | H | 7.75(-8) | -0.50 | 0.00 | 4.25(-7) | 6 | 1/2 | |||
| NH(p) | NH2(o) | H | 7.75(-8) | -0.50 | 0.00 | 4.25(-7) | 6 | 1/2 | |||
| NH(o) | NH2(o) | H | 1.55(-7) | -0.50 | 0.00 | 8.49(-7) | 6 | 1 | |||
| NH(p) | NH | H | H | 1.55(-7) | -0.50 | 0.00 | 8.49(-7) | 6 | |||
| NH(o) | NH | H | H | 1.55(-7) | -0.50 | 0.00 | 8.49(-7) | 6 | |||
| NH (I=2) | NH2(o) | H | H | 1.22(-7) | -0.60 | 0.00 | 9.39(-7) | 7 | 1 | ||
| NH (I=1) | NH2(o) | H | H | 8.07(-8) | -0.60 | 0.00 | 6.21(-7) | 7 | 2/3 | ||
| NH (I=1) | NH2(p) | H | H | 4.03(-8) | -0.60 | 0.00 | 3.10(-7) | 7 | 1/3 | ||
| NH (I=0) | NH2(o) | H | H | 6.11(-8) | -0.60 | 0.00 | 4.70(-7) | 7 | 1/2 | ||
| NH (I=0) | NH2(p) | H | H | 6.11(-8) | -0.60 | 0.00 | 4.70(-7) | 7 | 1/2 | ||
| NH (I=2) | NH2(o) | H2(o) | 1.88(-8) | -0.60 | 0.00 | 1.45(-7) | 7 | 1 | |||
| NH (I=1) | NH2(o) | H2(o) | 6.27(-9) | -0.60 | 0.00 | 4.83(-8) | 7 | 1/3 | |||
| NH (I=1) | NH2(o) | H2(p) | 6.27(-9) | -0.60 | 0.00 | 4.83(-8) | 7 | 1/3 | |||
| NH (I=1) | NH2(p) | H2(o) | 6.27(-9) | -0.60 | 0.00 | 4.83(-8) | 7 | 1/3 | |||
| NH (I=0) | NH2(o) | H2(o) | 9.40(-9) | -0.60 | 0.00 0 | 7.23(-8) | 7 | 1/2 | |||
| NH (I=0) | NH2(p) | H2(p) | 9.40(-9) | -0.60 | 0.00 | 7.23(-8) | 7 | 1/2 | |||
| NH (I=2) | NH3(o) | H | 8.00(-7) | -0.60 | 0.00 | 6.16(-6) | 7 | 1 | |||
| NH (I=1) | NH3(o) | H | 2.66(-7) | -0.60 | 0.00 | 2.05(-6) | 7 | 1/3 | |||
| NH (I=1) | NH3(p) | H | 5.33(-7) | -0.60 | 0.00 | 4.10(-6) | 7 | 2/3 | |||
| NH (I=0) | NH3(p) | H | 8.00(-7) | -0.60 | 0.00 | 6.16(-6) | 7 | 1 | |||
| DR of H3O+ | |||||||||||
| H3O+ | e- | OH | H2(o) | 3.00(-8) | -0.50 | 0.00 | 1.64(-7) | 6 | 1/2 | ||
| H3O+ | e- | OH | H2(p) | 3.00(-8) | -0.50 | 0.00 | 1.64(-7) | 6 | 1/2 | ||
| H3O+ | e- | OH | H | H | 2.60(-7) | -0.50 | 0.00 | 1.42(-6) | 6 | ||
| H3O+ | e- | H2O | H | 1.10(-7) | -0.50 | 0.00 | 6.03(-7) | 6 | |||
| H3O+ | e- | H2(o) | H | O | 2.80(-9) | -0.50 | 0.00 | 1.53(-8) | 6 | 1/2 | |
| H3O+ | e- | H2(p) | H | O | 2.80(-9) | -0.50 | 0.00 | 1.53(-8) | 6 | 1/2 | |
(1) Dos Santos et al. (2007); (2) McCall et al. (2004); (3) Vigren et al. (2012); (4) Mitchell (1990); (5) Thomas et al. (2005); (6) Jensen et al. (2000); (7) Öjekull et al. (2004).
| Chemical reactions | a𝑎aa𝑎aDR stands for dissociative recombination. | References | ||||||||
| N to N2 conversion | ||||||||||
| N | OH | NO | H | 8.9(-11) | 0.20 | 0.00 | 4.5(-11) | datasheet by Bergeat from KIDAb𝑏bb𝑏bWakelam et al. (2012). | ||
| N | NO | N2 | O | 7.2(-11) | 0.44 | 12.7 | 4.6(-12) | fit of calculations from Jorfi & Honvault (2009) | ||
| N | CN | N2 | C | 8.8(-11) | 0.42 | 0.00 | 2.1(-11) | Daranlot et al. (2012) | ||
| N | CH | CN | H | 1.7(-10) | 0.18 | 0.00 | 9.0(-11) | datatsheet by Smith & Loison from KIDAb𝑏bb𝑏bWakelam et al. (2012). | ||
| C | NO | CN | O | 6.0(-11) | -0.16 | 0.00 | 1.0(-10) | Chastaing et al. (2000); Bergeat (1999) | ||
| C | NO | CO | N | 9.0(-11) | -0.16 | 0.00 | 1.6(-10) | Chastaing et al. (2000); Bergeat (1999) | ||
| O to O2 conversion | ||||||||||
| O | OH | O2 | H | 4.0(-11) | 0.00 | 0.00 | 4.0(-11) | datasheet by Loison et al. from KIDAb𝑏bb𝑏bWakelam et al. (2012). | ||