Low-light-level four-wave mixing by quantum interference
Abstract
We observed electromagnetically-induced-transparency-based four-wave mixing (FWM) in the pulsed regime at low light levels. The FWM conversion efficiency of was observed in a four-level system of cold atoms using a driving laser pulse with a peak intensity of 80 , corresponding to an energy of 60 photons per atomic cross section. Comparison between the experimental data and the theoretical predictions proposed by Harris and Hau [Phys. Rev. Lett. 82, 4611 (1999)] showed good agreement. Additionally, a high conversion efficiency of was demonstrated when applying this scheme using a driving laser intensity of 1.8 . According to our theoretical predictions, this FWM scheme can achieve a conversion efficiency of nearly when using a dense medium with an optical depth of 500.
pacs:
42.50.Gy, 42.65.Ky, 03.67.-a, 32.80.QkI Introduction
Suppressing linear absorption and enhancing nonlinear interaction by using electromagnetically induced transparency (EIT) has been suggested to be a potential technique for all-optical control at low light levels Harris99 ; EIT05 ; KangXPM ; BrajePS ; ChenPS ; Chen06 ; Chen10 . To date, efficient all-optical switching and cross-phase modulation based on EIT have been realized at the level of a few hundred photons Bajcsy09 ; YFC11 . Recently, optical switching at the single-photon level based on cavity EIT was demonstrated Chen13 . Another crucial nonlinear effect based on EIT is four-wave mixing (FWM) which can be used to efficiently change the frequency of a photon. An individual photon with a tunable frequency can carry information among various types of devices, and may have potential applications in quantum networks Kimble08 ; kuzmich10 . However, to be useful in quantum control and communications, FWM must be highly efficient and not introducing additional noise photons Raymer10 ; Zeilinger11 ; Raymer12 .
Here, we report an experimental observation of EIT-based FWM in the pulsed regime at low light levels. An FWM conversion efficiency of was demonstrated using a driving laser pulse with a peak intensity of 1.8 in a four-level system of cold atoms. According to our theoretical predictions, this FWM scheme can achieve a conversion efficiency of nearly when using a dense medium with a great optical depth at low light levels. In addition, we observed a conversion efficiency of when using a driving laser intensity of 80 , corresponding to an energy of 60 photons per atomic cross section. Comparison between the experimental data and the theoretical predictions proposed by Harris and Hau Harris99 showed good agreement.
Before describing this study, we review previous experiments. Zhang et al. first observed sum-frequency generation by using EIT in atomic hydrogen Zhang93 . Jain et al. demonstrated an efficient frequency conversion by using EIT in atomic Pb vapor Jain96 . However, the laser intensities used in the two experiments were in the order of . Merriam et al. demonstrated an efficient gas-phase generation of ultraviolet radiation by using a double- system in the pulsed regime Merriam99 ; Merriam00 . Braje et al. reported first experimental demonstration of frequency conversion by using EIT in clod atoms Braje04 . Kang et al. demonstrated an FWM conversion efficiency of by using EIT in the pulsed regime Kang04 , and, recently, Wang et al. improved the efficiency to 73 in hot Rb atoms by using continuous-wave lasers with intensities greater than Wang10 .
II Theoretical Model
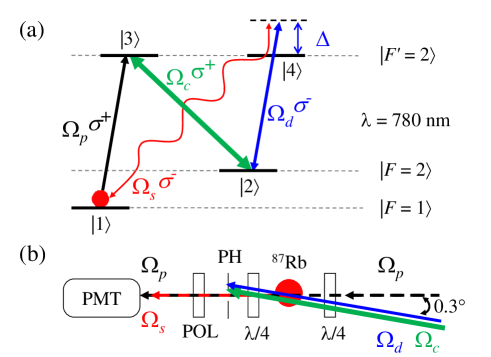
In the present study, we consider a four-level FWM system based on EIT, as shown in Fig. 1(a). The behavior of the probe and the generated signal pulses propagating in the medium were theoretically analyzed by solving the Maxwell-Schrödinger equations
| (1) | |||||
| (2) |
where and are the Rabi frequencies of the probe and signal pulses, respectively; is the slowly varying amplitude of the coherence between states and ; and are the total coherence decay rates from the excited states and , respectively; and () represents the optical depth of the probe (signal) transition, where is the number density of the atoms, () is the atomic absorption cross section of the probe (signal) transition, and is the optical path length of the medium. The optical depths of the probe and signal transitions in this experiment were the same () because is equal to when three degenerate Zeeman sublevels are considered.
When the probe and signal fields are very weak (i.e., ), the optical Bloch equations of the slowly varying amplitudes of the density-matrix elements are given by
| (3) | |||
| (4) | |||
| (5) |
where denotes the detuning of the driving transition [see Fig. 1(a)]. The parameter represents the dephasing rate of ground states and . Each parameter in the theoretical model was individually determined in additional experiments as follows: was measured based on the separation of the two absorption peaks in the EIT spectrum Harris97 ; was measured based on the delay time of the slow light pulse HauSlowLt ; and , which were contributed mainly by the spontaneous decay rate and laser linewidth, were both according to the spectral width of the one-photon absorption Lo10 . The spontaneous decay rate of the excited states was MHz; and was derived by numerically fitting the transmitted profiles of both the probe and signal pulses propagating through the FWM medium, and we modified to obtain the best fit of the amplitudes of the transmitted pulses.
When and = , the steady-state solutions for the probe and signal fields are obtained by solving Eqs. (1)-(5) as follows:
| (6) | |||
| (7) |
where and . The steady-state conversion efficiency is defined as the intensity ratio of the generated signal field to the incident probe field. According to Eqs. (6) and (7), for a given and , the conversion efficiency under the condition of three-photon resonance () saturates at a certain value for a sufficiently great optical depth, and the optimal value of 25 is achieved when . The EIT-based FWM scheme also allows a weak driving field to yield a conversion efficiency higher than 25 when Deng02 . Moreover, using a great optical depth ( 500) with a moderate , , and enable a conversion efficiency of nearly to be achieved when using this FWM scheme, which is discussed in the section of results and discussion.
III Experimental Details
The experiment was conducted in a magneto-optical trap (MOT) of 87Rb. To increase the optical depth, we designed a dark spontaneous-force optical trap (SPOT) Ketterle93 . Details on the experimental setup of the dark SPOT are provided in our previous study YFC13 . In the present study, the relevant energy levels of 87Rb atoms are shown in Fig. 1(a). All populations were prepared in ground state (). The probe () and coupling () fields with polarization drove the transitions of states and , respectively, to form a -type EIT. The driving field with polarization drove the transition of states , and had a frequency detuning . State was a ground state of , and states and were degenerated excited states (). We note that the Zeeman splitting of the hyperfine sublevels in this experiment was reduced to a few kHz or less because the background magnetic field was compensated to below 1 mG by using three pairs of magnetic coils.
The coupling and driving fields were produced by one diode laser which was injection locked by an external cavity diode laser (ECDL). One beam from the ECDL was sent through a 6.8-GHz electro optic modulator before seeding the probe field. The peak power of the probe pulse was set to 1 nW which is much smaller than that of the coupling pulse ( 60 ) throughout the experiment. Therefore, most of the populations would stay in the ground state even though at nearly FWM efficiency. The probe and coupling beams exhibited waist diameters of approximately 0.2 and 2.2 mm, respectively. The beam diameter of the driving field was the same as that of the coupling beam in the experiment.
The propagating direction of the probe beam was denoted as . The coupling and driving beams were coupled by a single-mode fiber and were then sent along the direction of . Because of the FWM effect, the signal field , which is generated when the phase matching condition is satisfied, propagates along with the direction of the probe beam [see Fig. 1(b)]. The probe and signal fields were detected using a photomultiplier tube, but were distinguished using a polarizer. Most of the scattering light from the coupling and driving beams was blocked by a 200-m pinhole.
In the timing sequence, we denoted the time of firing the probe pulse as . The magnetic field of the MOT was first turned off at ms. We then switched off the repumping laser of the MOT at s and immediately turned on the coupling field. The trapping laser of the MOT was switched off at s before sending the probe and driving pulses simultaneously. This process was used to ensure that the entire population was optically pumped to the ground state . The timing and detuning () of all light fields were controlled using individual acousto optic modulators. The repetition rate for each measurement was 100 Hz. Throughout the experiment, the duration of the probe square pulse, , was set to s to satisfy the condition that the spectral width of the probe pulse must be much smaller than the width of EIT transparency window; moreover, the driving square pulse with a duration of s was used to cover the entire slow-light probe pulse.
IV Results and Discussion
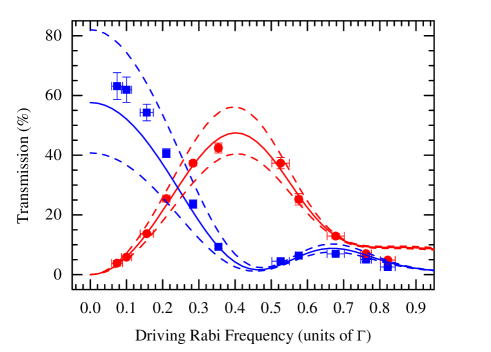
The conversion efficiency of EIT-based FWM is a function of , , , and , as shown in Eqs. (6) and (7). We first measured the conversion efficiency as a function of when = 13, = 42, and = 0.32. The blue squares and red circles in Fig. 2 represent the experimental data of the transmitted probe and signal pulses, respectively, and the solid lines are the theoretical curves estimated by numerically solving Eqs. (1)- (5) where the dephasing rate was set to . Consider all data in Fig. 2, has a standard deviation of . The large deviation of the dephasing rate is probably attributed to an increase of the strength of the driving field, which increased the dephasing rate, because the driving field also drives the transition of state to state , resulting in a far-off resonance photon-switching effect memory13 . This unwanted effect can be avoided by using the -line transitions of alkali atoms. The dashed lines (numerical curves) are guidelines for the experimental data with (lower dashed lines) and (upper dashed lines). For a weaker (stronger) driving field, the transmission of these two pulses approaches the upper (lower) dashed line. The experimental data also show that signal transmission exhibited a maximum value when . An FWM conversion efficiency of was obtained when , corresponding to a driving peak intensity of 1.8 .
We also observed an FWM conversion efficiency of (the leftmost data in Fig. 2) when using a driving pulse of = 0.074. The corresponding peak intensity, calculated as = , was 80 , where 1.63 is the saturation intensity and is the average value of the square of the Clebsch-Gordan coefficients determined by considering three degenerated Zeeman sublevels. The duration of the driving pulse, , was set to s in this experiment. We estimated that the driving pulse carries an energy of 60 photons per atomic cross section .
We subsequently compared the experimental data and the theoretical predictions proposed by Harris and Hau Harris99 . According to their theoretical analysis, the EIT-based FWM conversion efficiency, , in the pulsed regime is given by
| (8) |
where is the number of driving photons; is the atomic cross section of the transition; and is the spot area of the signal beam. The term is determined according to the dimensionless parameter, , where is the ratio of the EIT delay time to the probe pulse duration, and is equal to the loss of light propagating in the medium. For the experimental parameters in Fig. 2, we obtained and ; hence the analytic solution from Harris99 shows . When considering a driving pulse containing 60 photons is tightly focused to a spot area of an atomic cross section in the FWM experiment, we calculated a conversion efficiency of by using the Eq. (8). The difference between the experimental data () and the theoretical value () was due to the square profiles of the probe and driving pulses and the non-negligible dephasing rate () in the experiment.
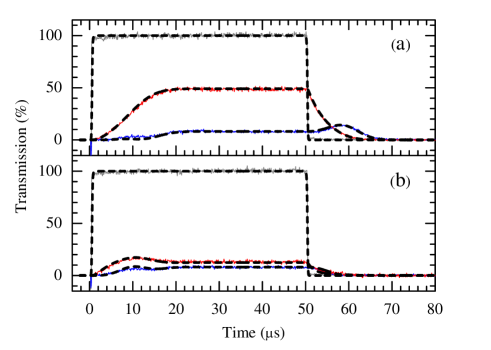
Figures 3(a) and 3(b) show typical data of the probe (middle) and signal (lower) pulses propagating through the FWM medium with the driving Rabi frequencies of and , respectively. The gray (upper) lines are the incident probe pulses. The group velocity differed between the transmitted probe and the signal pulses because . The FWM conversion efficiencies were and in Figs. 3(a) and 3(b), respectively.
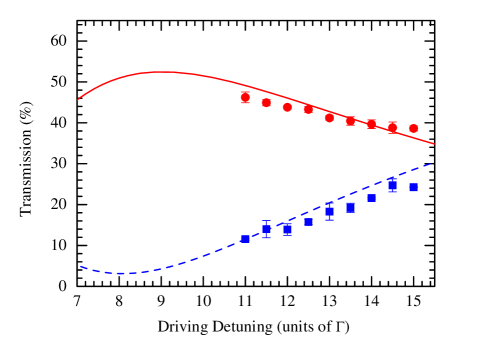
We further optimized the FWM conversion efficiency by modifying the driving detuning . We measured the conversion efficiency as a function of when , , and , as shown in Fig. 4. The experimental data show that the conversion efficiency increased as decreased. A high conversion efficiency of 46(2) was obtained when = 11. According to the theoretical predictions shown in the solid line, a greater conversion efficiency of can be achieved if the driving detuning is reduced from 11 to 9.
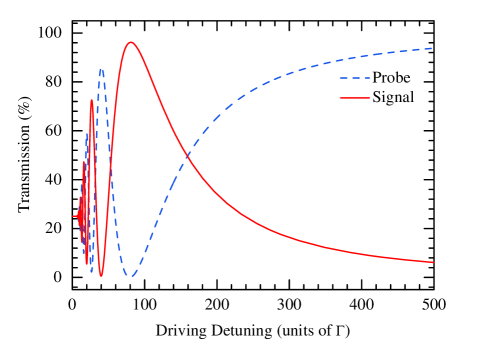
Figure 5 shows that an FWM conversion efficiency of nearly can be achieved when the optical depth is sufficiently great Peters13 . The dashed blue (probe) and solid red (signal) lines are the theoretical curves plotted according to Eqs. (6) and (7) with the parameters and . A nearly FWM efficiency was obtained at low light levels when the driving detuning, , was set to approximately 80. An efficient frequency conversion of single photons can protect quantum information carried by photons and may have potential applications in quantum control and communications Raymer12 .
V CONCLUSION
We experimentally demonstrated EIT-based FWM in the pulsed regime at low light levels. A conversion efficiency of was observed when using an ultraweak driving pulse with an energy of 60 photons per atomic cross section. We also demonstrated a high conversion efficiency of when using this scheme. According to our theoretical predictions, this FWM scheme can achieve a conversion efficiency of nearly when using a dense medium with an optical depth of 500. Additionally, the experimental data confirmed the analytic solution derived by the authors in Harris99 .
ACKNOWLEDGEMENTS
The authors thank Hao-Chung Chen for helpful discussions and Jun-Xian Chen for experimental assistance. This work was supported by the National Science Council of Taiwan under Grant No. 101-2112-M-006-004-MY3.
References
- (1) S. E. Harris and L. V. Hau, Phys. Rev. Lett. 82, 4611 (1999).
- (2) M. Fleischhauer, A. Imamoglu, and J. P. Marangos, Rev. Mod. Phys. 77, 633 (2005).
- (3) H. Kang and Y. Zhu, Phys. Rev. Lett. 91, 093601 (2003).
- (4) D. A. Braje, V. Bali, G. Y. Yin, and S. E. Harris, Phys. Rev. A 68, 041801(R) (2003).
- (5) Y.-F. Chen, Z.-H. Tsai, Y.-C. Liu, and I. A. Yu, Opt. Lett. 30, 3207 (2005).
- (6) Y.-F. Chen, C.-Y. Wang, S.-H. Wang, and I. A. Yu, Phys. Rev. Lett. 96, 043603 (2006).
- (7) H.-Y. Lo, P.-C. Su, and Y.-F. Chen, Phys. Rev. A 81, 053829 (2010).
- (8) M. Bajcsy et al., Phys. Rev. Lett. 102, 203902 (2009).
- (9) H.-Y. Lo et al., Phys. Rev. A 83, 041804(R) (2011).
- (10) W. Chen et al., Science 341, 768 (2013).
- (11) H. J. Kimble, Nature 453, 1023 (2008).
- (12) A. G. Radnaev et al., Nat. Phys. 6, 894 (2010).
- (13) H. J. McGuinness, M. G. Raymer, C. J. McKinstrie, and S. Radic, Phys. Rev. Lett. 105, 093604 (2010).
- (14) N. K. Langford et al., Nature 478, 360 (2011).
- (15) M. G. Raymer and K. Srinivasan, Phys. Today 65, 32 (2012).
- (16) G. Z. Zhang, K. Hakuta, and B. P. Stoicheff, Phys. Rev. Lett. 71, 3099 (1993).
- (17) M. Jain, H. Xia, G. Y. Yin, A. J. Merriam, and S. E. Harris, Phys. Rev. Lett. 77, 4326 (1996).
- (18) A. J. Merriam et al., Opt. Lett. 24, 625 (1999).
- (19) A. J. Merriam et al., Phys. Rev. Lett. 84, 5308 (2000).
- (20) D. A. Braje, V. Bali, S. Goda, G.Y. Yin, and S. E. Harris, Phys. Rev. Lett. 93, 183601 (2004).
- (21) H. Kang, G. Hernandez, and Y. Zhu, Phys. Rev. A 70, 061804(R) (2004).
- (22) G. Wang et al., Opt. Lett. 35, 3778 (2010).
- (23) S. E. Harris, Phys. Today 50, 36 (1997).
- (24) L. V. Hau, S. E. Harris, Z. Dutton, and C. H. Behroozi, Nature 397, 594 (1999).
- (25) H.-Y. Lo, P.-C. Su, Y.-W. Cheng, P.-I Wu, and Y.-F. Chen, Opt. Express 18, 18498 (2010).
- (26) M. G. Payne and L. Deng, Phys. Rev. A 65, 063806 (2002).
- (27) W. Ketterle, K. B. Davis, M. A. Joffe, A. Martin, and D. E. Pritchard, Phys. Rev. Lett. 70, 2253 (1993).
- (28) Y.-C. Chen et al., arXiv preprint arXiv:1302.1744 (2013).
- (29) Y.-H. Chen et al., Phys. Rev. Lett. 110, 083601 (2013).
- (30) F. Blatt, T. Halfmann, and T. Peters, Opt. Lett. 39, 446 (2014).