UV Suppression by Smearing and Screening Correlators
Abstract:
We investigate the mechanism of smearing in the APE, Stout, HYP and HEX schemes through their effect on glue and quark Fourier modes. Using this, we non-perturbatively tune the smearing parameters to their optimum values. Smearing causes a super-linear improvement in taste symmetry breaking in the high temperature phase of QCD. We use optimal smearing in the high temperature phase and find close agreement of meson screening masses with weak coupling predictions.
1 Introduction
Smeared gauge links improve the scaling behaviour of staggered quarks. It is believed that smearing achieves this by suppressing the dependence of operators on high-momentum field modes. Also, hypercubic gauge link smearing is gaining interest with the advent of HEX [7] as it is differentiable and can be implemented in dynamical simulations. Hence it is important to check if gauge link smearing suppresses only the ultraviolet modes while leaving the long distant physics intact. In this presentation, we present our study on the effect of gauge link smearing on the infrared and ultraviolet modes in both gluonic and quark sectors.
From [2], comparison of hadron screening masses at from various quenched calculations using different valence quarks shows complete disagreement between staggered quark results and results from Clover and Overlap fermion calculations. In particular, the staggered pseudoscalar/scalar screening masses lie anomalously below the lattice free field theory. We were motivated to see if this discrepancy is due to taste splitting in staggered fermion formulation.
The results presented here are based on [1].
2 Study of smearing
We examined four schemes which are currently popular: APE [4], HYP [5], Stout [6], and HEX [7]. Each of these smearing schemes have free parameter which determines how much importance is given to link neighbours. The APE and Stout schemes have a single fattening parameter , while HYP and HEX schemes have three different in three orthogonal directions. We restricted our study to the subset which have equal contributions from all directions, controlled by a single parameter . Also, to maintain locality, we restricted ourselves to one step of smearing.
To study the effect of gauge link smearing on the high frequency modes of the gauge field, we constructed the power spectrum, , of plaquettes summed over all spatial directions, , as
| (1) |
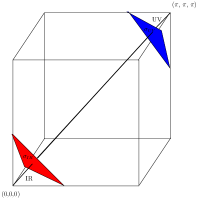
The mode numbers , is the size of the lattice in the direction , the integers , and for periodic boundary conditions and 1 for anti-periodic. Periodic or anti-periodic boundary conditions imply that the independent modes are those with inside the Brillouin hypercube whose body diagonal, BD, joins the corners (0,0,0,0) and ().
We used this power spectrum to find how smearing affects the UV and IR modes. As shown in Figure 1, we separated the IR and UV using hyperplanes perpendicular to BD. All modes within the Brillouin zone closer to the origin than a hyperplane were called IR modes; conversely all modes within the Brillouin zone closer to the far corner than the plane were called UV modes. Everything else was a generic mode– neither IR, nor UV. We defined the suppression of power in the IR and UV as a function of
| (2) |
where is the power summed over all modes in the UV for a fixed value of , and is a similar quantity obtained by summing over all modes in the IR.
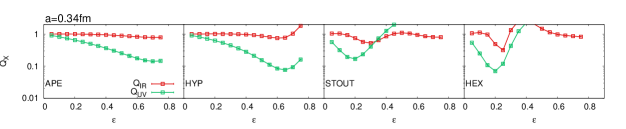
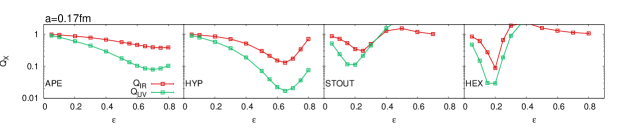
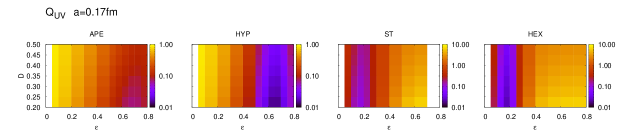
We investigated numerically with thermalized configurations at using and corresponding to lattice spacings of and fm. The Goldstone pion mass is the same in both the configurations. Periodic boundary conditions were used so that all . The variation of with is shown in the top two panels of Figure 2. First focusing on the top panel, one sees that the slope of the curve for always starts off larger than that for . Also, the slope of the latter seems to be close to zero. This shows that smearing can be used to modify the UV without modifying the IR. One can use this to seek an optimum value of , such that is as small as possible. From the bottom panel, we find that there is change in the overall suppression of power in the IR and UV, but the change in the optimum is not large even when the lattice spacing is halved. The optimum values of move down slightly. This movement is compatible with the intuition that finer lattices require less improvement. Since the definitions of IR and UV are arbitrary, one needs to check whether the results are sensitive to this definition. We placed the planes and at a fraction of the length of the diagonal (with , so that no mode is simultaneously in the IR and UV) from the nearest corner, and varied . The result for is shown in the bottom panel of Figure 2. The colour code is such that decreases when we go from yellow to blue. We find that the optimum is insensitive to .
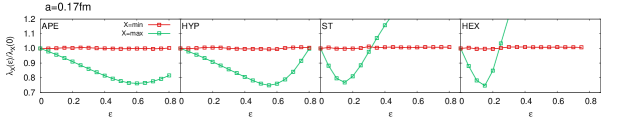
Then we studied how smearing affected the quark sector. Using massive staggered Dirac operator, , we took the minimum and maximum eigenvalues, and , of to be the IR and UV quantities in the quark sector. In the top panel of Figure 3, we show the variation of with by the red points and similarly for using green points, at . We find that there exists an optimum where is minimum. Interestingly, this optimal point occurs very close to the one determined in the gauge sector. Also, the changes in is very minimal and occurs within the tolerance used in Lanczos.
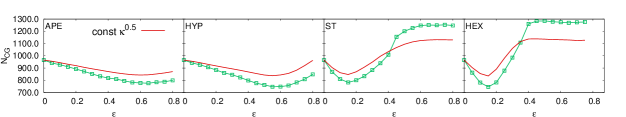
The convergence of conjugate gradient (CG) is related to the extremal eigenvalues through the condition number of , . In the bottom panel of Figure 3, we display the variation of number of CG iterations, , required for the residue to be less than as a function of . We find that CG is optimized at the same values of as found through and . We also show a curve proportional to (red curve) to show the striking dependence of on , even though only sets an upper bound on .
We summarize the results of our optimization of smearing algorithms in Table 1.
| Scheme | , | , | ||||
|---|---|---|---|---|---|---|
| APE | 0.71 | 0.65 | 0.62 | 0.70 | 0.65 | 0.60 |
| HYP | 0.65 | 0.60 | 0.56 | 0.65 | 0.55 | 0.55 |
| Stout | 0.19 | 0.15 | 0.16 | 0.18 | 0.15 | 0.14 |
| HEX | 0.20 | 0.15 | 0.17 | 0.17 | 0.15 | 0.14 |
3 Application to Screening Masses
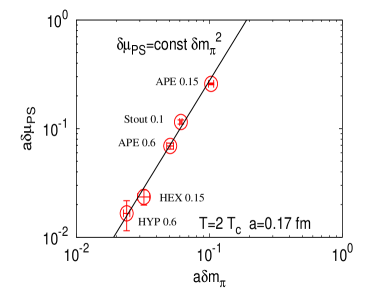
We now present the applications of our study on smearing to the study of hadronic screening masses. By construction of staggered quarks, each staggered meson has 16 different taste partners. In the continuum, the masses of the taste partners are degenerate, while at finite , they are split. Hence we take the measure of taste breaking as
| (3) |
where the subscript gives the taste structure. The splitting at finite temperature, , is taken as the splitting in the corresponding screening masses. In Figure 4, we show at as a function of . The different points are labelled by values of in different smearing schemes. The black line is given by . Thus the splitting in the deconfined phase improves super-linearly with the improvement at zero temperature. This observation could be explained by complete or almost complete restoration of taste symmetry in the chiral limit [1]. Since recovery of taste symmetry has been used as the main indicator of the reduction of UV effects, it is natural to use optimized HYP smearing in order to best reduce lattice artifacts.
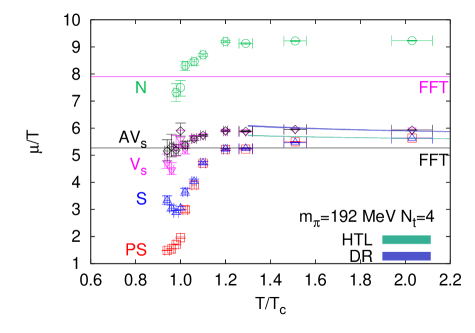
Using optimal HYP improved staggered valence quark, we determined the pseudoscalar (PS), scalar (S), vector (V), axialvector (AV) and nucleon (N) screening masses in the temperature range . The results are displayed in Figure 5 for the ensemble with MeV and temporal extent . The blue and green bands are the weak coupling predictions from dimensional reduction [8] and HTL [9] respectively. The salient feature of this plot is that in the deconfined phase lies closer to the lattice free field theory limit. Also, the meson screening masses agree with the weak coupling theory predictions within the uncertainty arising from the smearing scheme dependence at this lattice spacing.
4 Conclusions
We presented our work on the optimization of the valence quarks. We used four popular versions of fat-link staggered quarks. We optimized the smearing parameter, , in each case by observing changes to the power spectrum of the plaquette (see Figure 2) and the largest and smallest eigenvalues of the Dirac operator (see Figure 3). The optimum was chosen so that the UV was suppressed as much as possible without changing the IR behaviour in both cases. This also improved the performance of the conjugate gradient algorithm used for the inversion of the Dirac operator (see Table 1). Such a tuning was done at . We found mild changes in the tuning parameters as the lattice spacing was changed by a factor of 2. Smearing causes systematic changes in finite temperature properties of interest. Taste symmetry breaking in the hot phase improves super-linearly with improvement at (see Figure 4). Using optimal HYP improved valence quarks, the screening masses at high temperature are found to be close to weak-coupling theory (see Figure 5).
The lattice computations described here were performed on the Cray X1 of the ILGTI in TIFR.
References
- [1] S. Gupta and N. Karthik, Phys. Rev. D 8 (7) , 094001 (2013).
- [2] S. Datta et al., arxiv:1212.2927.
- [3] C. E. Detar and J. B. Kogut, Phys. Rev. Lett. 5 (9) , 399 (1987).
- [4] M. Albanese et al., Phys. Lett. B 192, 163 (1987).
- [5] A. Hasenfratz and F. Knechtli, Phys. Rev. D 6 (4) , 034504 (2001).
- [6] C. Morningstar and M. J. Peardon, Phys. Rev. D 6 (9) , 054501 (2004).
- [7] S. Capitani, S. Dürr, C. Hoelbling, J. High Energy Phys. 0 (6) 11, 028 (2006).
- [8] M. Laine and M. Vepsäläinen, J. High Energy Phys. 0 (4) 02, 004 (2004).
- [9] W. M. Alberico et al., Nucl. Phys. A 792, 152 (2007).