Structural phase transition induced by van Hove singularity in 5d transition metal compound IrTe2
Abstract
Comprehensive studies of the electronic states of Ir 5d and Te 5p have been performed to elucidate the origin of the structural phase transition in IrTe2 by combining angle-resolved photoemission spectroscopy and resonant inelastic X-ray scattering. While no considerable changes are observed in the configuration of the Ir 5d electronic states across the transition, indicating that the Ir 5d orbitals are not involved in the transition, we reveal a van Hove singularity at the Fermi level (EF) related to the Te px+py orbitals, which is removed from EF at low temperatures. The wavevector connecting the adjacent saddle points is consistent with the in-plane projection of the superstructure modulation wavevector. These results can be qualitatively understood with the Rice-Scott ``saddle-point'' mechanism, while effects of the lattice distortions need to be additionally involved.
pacs:
71.30.+h, 74.70.-b, 71.20.-b, 71.45.LrThe proximity of superconductivity to another quantum ordered state is a hot issue in condensed matter physics. The interplay between them is closely related to the origin of superconductivity. For example, in cuprates, ferropnictides and ferrochalcogenides, and heavy fermion superconductors, the development of superconductivity is usually accompanied by a decline of long-range magnetic order. It is thus widely believed that the origin of their unconventional superconductivity is intimately associated with the magnetic excitations, though the microscopic mechanisms are still a mystery cuprate ; iron ; HF . Another typical example is the coexistence and competition between charge-density-wave (CDW) and superconductivity in a number of compounds, which has attracted much attention to their relationship TiSe2 ; NbSe2_Shin ; NbSe2_Borisenko ; TiS2_FengDL .
Recently, the 5d transition metal dichalcogenide IrTe2 with 1T-structure was suggested to be of the second case. IrTe2 exhibits a structural phase transition from trigonal Pm1 to triclinic P1 at Ts 270 K structure , below which a new structural modulation with a wavevector Q = (1/5, 0, -1/5) was revealed ED1 . With intercalation or substitution at the Ir sites of Pt, Pd, Rh or Cu, the structural transition is suppressed and bulk superconductivity is induced with Tc up to 3 K, indicating interesting interplay between them ED1 ; optical ; JPSJ_PS ; CuxIrTe2 ; RhxIrTe2 . Clarifying the origin of the structural transition is a crucial step to understand the mechanism of the superconductivity. Yang et al. proposed that the transition is driven by partial Fermi surface (FS) nesting, and therefore of the CDW-type with involvement of the Ir 5d orbitials ED1 . However, no energy gap, characteristic of a density-wave type transition, was identified from the optical conductivity spectra optical . Several other mechanisms, including the orbital-induced Peierls instability ARPES ; photoemission , the reduction of kinetic energy by the crystal field effects optical , the interlayer hybridization CuxIrTe2 , the local bonding instability structure , and the anionic depolymerization transition ED2 , have been proposed to understand the structural transition.
In this Letter, we provide direct evidence that the phase transition in IrTe2 is intimately associated with the van Hove singularity (vHs) at the Fermi level (EF) related to the Te px+py orbitals. The vHs arises from six saddle points at kz = and the wavevector between the adjacent saddle points is q (0.19, 0, 0), which is very close to the in-plane projection of the structural modulation wavevector. The band structure related to the saddle points is dramatically reconstructed below Ts, leading to a significant reduction of the kinetic energy, which is likely to be the driving force for the transition. The results can be qualitatively understood in the framework of the Rice-Scott ``saddle-point'' mechanism.
High quality single crystals of IrTe2 were grown via the self-flux technique optical . Resonant inelastic X-ray scattering (RIXS) measurements were carried out at beamline 30-ID, Advanced Photon Source, in a horizontal scattering geometry. A Si(844) secondary monochromator and a R = 2m Si(844) diced analyzer were utilized. The overall energy resolution of this setup was 40 meV (FWHM). Angle-resolved photoemission spectroscopy (ARPES) experiments were performed at beamline PGM of the Synchrotron Radiation Center (Wisconsin), at beamline 4.0.3.2 of the Advanced Light Source (California), and beamline SIS of the Swiss Light Source (Switzerland) with Scienta R4000 analyzers. The energy and angular resolutions were set at 30 meV and 0.2∘, respectively. The samples were cleaved in situ and measured in a vacuum better than 310-11 Torr. Calculations for the electronic structure and density of states (DOS) were performed by using the full-potential augmented plane-wave and Perdew-Burke-Ernzerhof parametrization of the generalized gradient approximation (GGA-PBE) exchange-correlation function GGA as implemented in the WIEN2k code WIEN2k . The spin-orbital interactions were included by using a second variational procedure. The muffin-tin radii (RMT) were set to 2.50 bohrs for Ir and 2.26 bohrs for Te. The plane-wave cutoff (Kmax) was determined by RminKmax = 7.0, where Rmin is the minimal RMT.
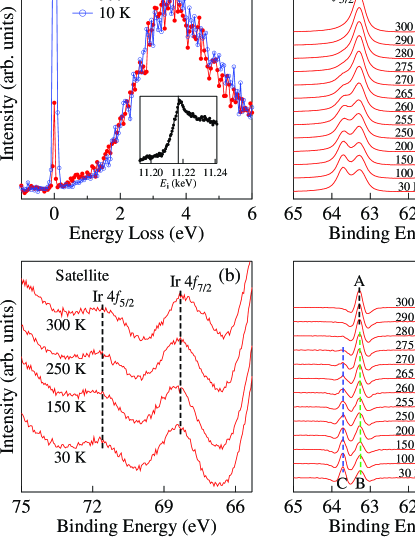
First we used RIXS and core level photoemission spectroscopy to show that the FSs of IrTe2 are dominated by the Te 5p orbitals and the phase transition is mainly related to the Te 5p electronic states near EF. To probe the electronic configuration of the Ir 5d orbitals, we have carried out RIXS measurements at the Ir-L3 edge. As a function of incident X-ray energy (Ei), a strong resonant peak is found at an energy loss of 3.5 eV [Fig. 1(a)], whose intensity is maximized at Ei 11.217 keV [inset of Fig. 1(a)]. The peak corresponds to the Ir t2g eg excitations. If the Ir t2g orbitals are partially occupied, excitations within t2g orbitals are expected, which resonate at slightly lower Ei. Features related to such excitations are observed in CuIr2S4, whose temperature dependence has been suggested to be the signature of Ir 3+:4+ charge disproportion RIXS . For IrTe2, the inelastic response down to 0.2 eV follows the same resonant behavior as the 3.5 eV peak, and shows no indication of excitations within the t2g orbitals. This suggests strongly that the t2g orbitals are fully occupied. With the Ir eg levels much higher in energy due to the crystal field splitting, the FSs are expected to be dominated by the Te 5p orbitals. We compare in Fig. 1(a) the RIXS response above and below Ts with data collected on the superstructure wavevector (1.6, 0, 6.4). Although the structural transition is clearly shown by the drastic increase of elastic peak at this superstructure wavevector, the inelastic response shows no appreciable difference at all, indicating that the Ir 5d orbitals are not involved in the transition.
The above conclusion is further supported by our core-level photoemission spectroscopy measurements. While a previous study has shown an increase in the Ir 4f peak width photoemission , our high-resolution measurements reveal clear splitting of the Ir 4f and Te 4d peaks below the phase transition. Figures 1(c) and 1(d) show the main peaks in the Ir 4f core level spectra and their second derivatives at various temperatures, respectively. A set of peaks (labeled as A in Fig. 1(d)) induced by the spin-orbital coupling are observed above Ts. The binding energy (EB) of Ir 4f7/2 in IrTe2 is 60.3 eV at 300 K, which is obviously lower than in IrO2 (62.0 eV, Ir4+) IrO2 and CuIr2S4 ( 61.0 eV, Ir3.5+) CuIr2S4 . This suggests that the valence of Ir in IrTe2 is near 3+, in agreement with the RIXS results. Upon cooling below Ts, they are split into two sets of peaks (B and C), whose energy difference BC slightly depends on temperature and is 0.44 eV at 30 K. In contrast, the Ir 4f satellite peaks in Fig. 1(b) exhibit no considerable change. It is known that the satellite and main peaks correspond to the unscreened 5d6 and well-screened 5d7 ( denotes one hole in the ligand Te 5p orbitals) final states, respectively. Thus the satellite line energy does not depend on the Te 5p electronic states, while the main line energy strongly correlates with them. Since the satellites exhibit no obvious difference, the electronic configuration of the Ir 5d orbitals does not change below Ts, in agreement with the RIXS results. Therefore, the splitting in the Ir 4f main peaks is due to a reconstruction of the Te 5p electronic states.
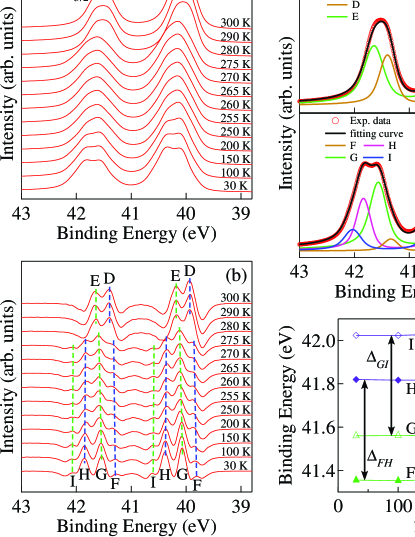
The reconstruction of the Te 5p electronic states below Ts is also directly reflected in the Te 4d core level spectra, as shown in Fig. 2, where a drastic change is seen across Ts. Two sets of peaks of Te 4d (D and E) are identified above Ts. A possible reason for the double-peak feature is that they may originate from two different screening channels, where the screening charge comes from the Te 5p conduction bands and the ligand Ir 5d orbitals, respectively. Similar double-peak features have been also observed in La1-xSrxMnO3 and V2O3, and interpreted in the same way LSMO ; V2O3 . Upon cooling below Ts, four sets of peaks (F, G, H, and I) are identified. The spectra above and below Ts are fitted to two and four sets of peaks with the Doniach-Sunjic line shape, respectively. The peak positions determined by fitting are plotted as a function of temperature in Fig. 2(e). The energy differences FH and GI are equal in the whole temperature range below Ts and 0.46 eV at 30 K. The value is very close to that of BC of Ir 4f at 30 K, indicating that the splitting in the Ir 4f and Te 4d peaks has the same origin.
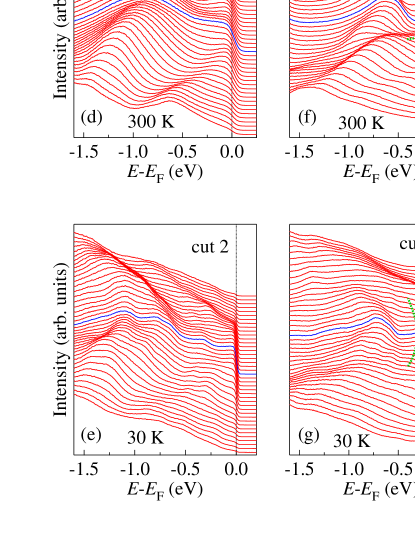
Having determined the orbital character at the low energy, we turn to the FS topology and band dispersions. Figures 3(a) and 3(b) show the FS intensity maps with photon energy h = 90 eV (corresponding to the kz 0.8 plane) measured at 300 and 30 K, respectively. We observe one outer and three inner hole-like FS pockets at 300 K, in agreement with the calculated ones at kz = 0.8 for the trigonal phase. According to their calculations, Yang et al. proposed a FS nesting between one of the corners of the outer pocket at kz = 0.8 and the inner pocket at kz = 0.4 with a wavevector of (1/5, 0, -1/5) ED1 . To inspect whether there exists any energy gap induced by this nesting, we show in Figs. 3(d) and 3(e) the ARPES spectra along the kx = -0.55 Å-1 cut at 300 and 30 K, respectively. The spectra exhibit a clear Fermi edge at 30 K, suggesting that no CDW-type gap is induced in the proposed nesting FS section, which is consistent with the optical data optical .
The most prominent change in the low temperature phase is that the three inner pockets disappear at 30 K. To clarify this, we compare in Figs. 3(f)-3(i) the band dispersions along the kx = -0.35 Å-1 cut at 300 and 30 K. While the inner hole-like band crosses EF at 300 K, forming the inner FS pocket, it sinks below EF at 30 K, leading to a large energy gap of 0.3 eV. From the intensity map at EB = 0.3 eV and 30 K in Fig. 3(c), we observe again three highlighted areas, corresponding to the band tops, whose momentum locations are consistent with those of the inner FS pockets at 300 K. This indicates that the change in the FS topology arises from an energy shift of the related band. According to the band calculations, the near-EF band that forms the inner pockets originates mainly from the Te px+py orbitals. As seen in Fig. 4(b), the partial DOS from the Te px+py orbitals exhibits a distinct peak located very close to EF. The large energy shift of the Te px+py band reduces remarkably the DOS at EF and the kinetic energy of the electrons, which is likely to be the driving force for the transition.
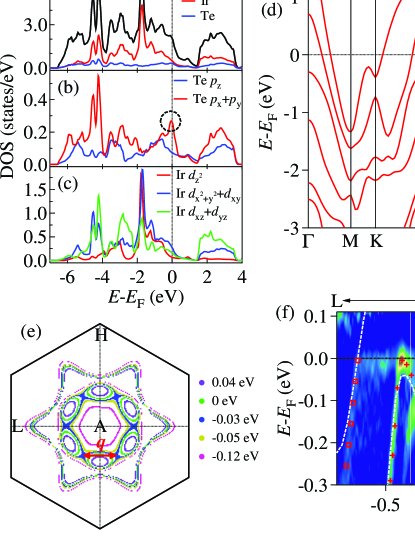
We further find that the distinct peak in the DOS is a van Hove singularity. According to the calculated band structure in Fig. 4(d), as moving from the A point to the L and H points, the Te px+py band disperses first towards EF and then to higher EB, leading to band tops at k// 0.36 Å-1 indicated by arrows. This band crosses and sinks below EF along AH and AL, respectively, forming six small hole pockets at kz = . From the contour map of EB's of the bands at kz = in Fig. 4(e), one can identify six saddle points located along the AL lines, at which the band dispersions are hole- and electron-like along and perpendicular to AL, respectively. It is worth noting that the momentum transfer connecting the adjacent saddle points is q (0.19, 0, 0), which is very close to the in-plane projection of the structural modulation wavevector Q = (1/5, 0, -1/5). In Fig. 4(f), we compare the experimental band dispersions and the calculated ones along L-A-H. The excellent consistency in the experimental and calculated data supports the scenario of the saddle points, whose energy position in experiment is just located at EF.
Our results indicate that the structural transition in IrTe2 is intimately associated with the vHs at EF. Firstly, the wavevector between the adjacent saddle points is very close to the in-plane projection of the structural modulation wavevector. Secondly, the bands near the saddle points are strongly reconstructed, which removes the vHs from EF and thus reduces the kinetic energy of the electronic system. This is reminiscent of the Rice-Scott ``saddle-point'' mechanism NbSe2_Shin ; Rice_Scott ; saddle . In this model, the susceptibility diverges logarithmically at a wavevector connecting two saddle points, leading to a CDW stability, and the FS is truncated near the saddle points. Although the phase transition in IrTe2 can be qualitatively understood in the framework of the ``saddle-point'' mechanism, distinct deviations from the characteristics of a typical CDW transition are observed. Firstly, the model predicts that the conductivity is enhanced due to the removal of the saddle points, where the effect of the scattering rate reduction is stronger than that of the carrier number reduction. However, a steep jump in the resistivity was observed across Ts upon cooling in IrTe2 ED1 ; optical ; JPSJ_PS ; CuxIrTe2 ; pressure . Secondly, the bands are strongly modified in a large energy range of at least 3 eV optical ; ARPES . Finally, the superstructure modulations are highly nonsinusoidal and rather rectangular ED2 . While there is no theoretical picture to explain all the experimental results, the deviations could be associated with the strong lattice distortions structure ; ED2 since a Kohn anomaly can be induced by the scattering of conduction electrons between the adjacent saddle points. This suggests that the phase transition is not purely electronically driven and a lattice degree of freedom is intricately coupled with a charge degree of freedom.
In the general vHs scenario, various states, including CDW, spin-density-wave, phase separation, and even superconductivity, may be induced to remove the singularity from EF and reduce the kinetic energy of the electronic system. One interesting question is whether superconductivity is also driven by the vHs since the opening of a superconducting gap in the vicinity of the saddle points could remove the vHs from EF. As the phase diagrams of doping and pressure exhibit a seemingly competitive interplay between superconductivity and other ordered phases ED1 ; optical ; JPSJ_PS ; CuxIrTe2 ; RhxIrTe2 ; pressure , our present study, which reveals the vHs origin of the phase transition in IrTe2, will motivate further experimental and theoretical studies on the relationship between superconductivity and adjacent quantum ordered states.
We acknowledge W. Ku, T. Xiang, Z. Y. Lu, G. L. Cao, H. F. Tian, J. Q. Li, X. D. Zhou, and Y. Y. Wang for valuable discussions. This work was supported by grants from CAS (2010Y1JB6), MOST (2010CB923000, 2011CBA001000, 2011CB921701, 2013CB921700 and 2012CB821403), NSFC (11004232, 11050110422, 11204359, 11120101003, 11074291, 11121063, 11234014, and 11274362), and SSSTC (IZLCZ2 138954). This work at Brookhaven was support by the U.S. Department of Energy, Division of Materials Science, under Contract No. DE-AC02-98CH10886. This work is based in part on research conducted at the Synchrotron Radiation Center, which is primarily funded by the University of Wisconsin-Madison with supplemental support from facility users and the University of Wisconsin-Milwaukee. This work is based in part upon research conducted at the Swiss Light Source, Paul Scherrer Institute, Villigen, Switzerland. The Advanced Light Source and the Advanced Photon Source are supported by the U.S. Department of Energy, Office of Science, Office of Basic Energy Sciences, under Contract No. DE-AC02-05CH112 and DE-AC02-06CH11357, respectively.
References
- (1) H. A. Mook, P. C. Dai, S. M. Hayden, G. Aeppli, T. G. Perring, and F. Dogan, Nature 395, 580 (1998).
- (2) A. D. Christianson, E. A. Goremychkin, R. Osborn, S. Rosenkranz, M. D. Lumsden, C. D. Malliakas, I. S. Todorov, H. Claus, D. Y. Chung, M. G. Kanatzidis, R. I. Bewley, and T. Guidi, Nature 456, 930 (2008).
- (3) N. D. Mathur, F. M. Grosche, S. R. Julian, I. R. Walker, D. M. Freye, R. K. W. Haselwimmer, and G. G. Lonzarich, Nature 394, 39 (1998).
- (4) E. Morosan, H. W. Zandbergen, B. S. Dennis, J. W. G. Bos, Y. Onose, T. Klimczuk, A. P. Ramirez, N. P. Ong, and R. J. Cava, Nature Phys. 2, 544 (2006).
- (5) T. Kiss, T. Yokoya, A. Chainani, S. Shin, T. Hanaguri, M. Nohara, and H. Takagi, Nature Phys. 3, 720 (2007).
- (6) S. V. Borisenko, A. A. Kordyuk, V. B. Zabolotnyy, D. S. Inosov, D. Evtushinsky, B. Buchner, A. N. Yaresko, A. Varykhalov, R. Follath, W. Eberhardt, L. Patthey, and H. Berger, Phys. Rev. Lett. 102, 166402 (2009).
- (7) J. F. Zhao, H. W. Ou, G. Wu, B. P. Xie, Y. Zhang, D. W. Shen, J. Wei, L. X. Yang, J. K. Dong, M. Arita, H. Namatame, M. Taniguchi, X. H. Chen, and D. L. Feng, Phys. Rev. Lett. 99, 146401 (2007).
- (8) H. B. Cao, B. C. Chakoumakos, X. Chen, J. Q. Yan, M. A. McGuire, H. Yang, R. Custelcean, H. D. Zhou, D. J. Singh, and D. Mandrus, Phys. Rev. B 88, 115122 (2013).
- (9) J. J. Yang, Y. J. Choi, Y. S. Oh, A. Hogan, Y. Horibe, K. Kim, B. I. Min, and S. W. Cheong, Phys. Rev. Lett. 108, 116402 (2012).
- (10) A. F. Fang, G. Xu, T. Dong, P. Zheng, and N. L. Wang, Sci. Rep. 3, 1153 (2013).
- (11) S. Pyon, K. Kudo, and M. Nohara, J. Phys. Soc. Japan 81, 053701 (2012).
- (12) M. Kamitani, M. S. Bahramy, R. Arita, S. Seki, T. Arima, Y. Tokura, and S. Ishiwata, Phys. Rev. B 87, 180501 (2013).
- (13) K. Kudo, M. Kobayashi, S. Pyon, and M. Nohara, J. Phys. Soc. Japan 82, 085001 (2013).
- (14) D. Ootsuki, S. Pyon, K. Kudo, M. Nohara, M. Horio, T. Yoshida, A. Fujimori, M. Arita, H. Anzai, H. Namatame, M. Taniguchi, N. L. Saini, and T. Mizokawa, J. Phys. Soc. Japan 82, 093704 (2013).
- (15) D. Ootsuki, Y. Wakisaka, S. Pyon, K. Kudo, M. Nohara, M. Arita, H. Anzai, H. Namatame, M. Taniguchi, N. L. Saini, and T. Mizokawa, Phys. Rev. B 86, 014519 (2012).
- (16) Y. S. Oh, J. J. Yang, Y. Horibe, and S. W. Cheong, Phys. Rev. Lett. 110, 127209 (2013).
- (17) J. P. Perdew, K. Burke, and M. Ernzerhof, Phys. Rev. Lett. 77, 3865 (1996).
- (18) P. Blaha, K. Schwarz, G. Madsen, D. Kvasnicka, and J. Luitz, WIEN2K package, available at http://www.wien2k.at.
- (19) H. Gretarsson, J. Kim, D. Casa, T. Gog, K. R. Choi, S. W. Cheong, and Y. J. Kim, Phys. Rev. B 84, 125135 (2011).
- (20) W. H. Chung, C. C. Wang, D. S. Tsai, J. C. Jiang, Y. C. Cheng, L. J. Fan, Y. W. Yang, and Y. S. Huang, Surf. Sci. 604, 118 (2010).
- (21) T. Okane, S.-i. Fujimori, K. Mamiya, J. Okamoto, Y. Muramatsu, A. Fujimori, H. Suzuki, T. Matsumoto, T. Furubayashi, M. Isobe, and S. Nagata, J. Magn. Magn. Mater. 272-276, e297 (2004).
- (22) K. Horiba, M. Taguchi, A. Chainani, Y. Takata, E. Ikenaga, D. Miwa, Y. Nishino, K. Tamasaku, M. Awaji, A. Takeuchi, M. Yabashi, H. Namatame, M. Taniguchi, H. Kumigashira, M. Oshima, M. Lippmaa, M. Kawasaki, H. Koinuma, K. Kobayashi, T. Ishikawa, and S. Shin, Phys. Rev. Lett. 93, 236401 (2004).
- (23) N. Kamakura, M. Taguchi, A. Chainani, Y. Takata, K. Horiba, K. Yamamoto, K. Tamasaku, Y. Nishino, D. Miwa, E. Ikenaga, M. Awaji, A. Takeuchi, H. Ohashi, Y. Senba, H. Namatame, M. Taniguchi, T. Ishikawa, K. Kobayashi, and S. Shin, Europhys. Lett. 68, 557 (2004).
- (24) P. Zhang, P. Richard, T. Qian, Y. M. Xu, X. Dai, and H. Ding, Rev. Sci. Instrum. 82, 043712 (2011).
- (25) T. M. Rice and G. K. Scott, Phys. Rev. Lett. 35, 120 (1975).
- (26) R. Liu, W. C. Tonjes, V. A. Greanya, C. G. Olson, and R. F. Frindt, Phys. Rev. B 61, 5212 (2000).
- (27) A. Kiswandhi, J. S. Brooks, H. B. Cao, J. Q. Yan, D. Mandrus, Z. Jiang, and H. D. Zhou, Phys. Rev. B 87, 121107 (2013).