Observation of the spin Peltier effect
Abstract
We report the observation of the spin Peltier effect (SPE) in the ferrimagnetic insulator Yttrium Iron Garnet (YIG), i.e. a heat current generated by a spin current flowing through a Platinum (Pt)YIG interface. The effect can be explained by the spin torque that transforms the spin current in the Pt into a magnon current in the YIG. Via magnon-phonon interactions the magnetic fluctuations modulate the phonon temperature that is detected by a thermopile close to the interface. By finite-element modelling we verify the reciprocity between the spin Peltier and spin Seebeck effect. The observed strong coupling between thermal magnons and phonons in YIG is attractive for nanoscale cooling techniques.
pacs:
76.50.+g, 75.78.-n, 72.15.Jf, 85.80.Fipacs:
The discovery of the spin Seebeck effect (SSE) in YIGPt bilayers Uchida et al. (2010) opened up a new research direction in the field of spin caloritronics. In the SSE a temperature difference between the magnons in the magnetic insulator and the electrons in the metal contact leads to thermal pumping of a spin current Xiao et al. (2010); Adachi et al. (2011); Hoffman et al. (2013). In a suitable metal such as Pt this spin current is transformed into an observable transverse voltage by the inverse spin Hall effect Hoffmann et al. (2013). Numerical simulations of the phonon, magnon and electron temperatures show good agreement with experiments Schreier et al. (2013). In this Letter we report the observation of the spin Peltier effect (SPE), which is the Onsager reciprocal Onsager et al. (1931) of the SSE.
The SPE is the generation of a magnon heat current in the magnetic insulator by a spin current through the interface with the metal contact. The latter can be generated by a charge current in the Pt film that by the spin Hall effect generates a transverse spin current normal to the interface. The spin Peltier heat current generates a temperature difference between magnons and phonons in the YIG that when relaxing leads to a change in the lattice temperature. We confirm this scenario experimentally by picking up such temperature changes via proximity thermocouples. According to our modelling the experimental results are consistent with Onsager reciprocity between the SPE and the SSE, which we measure separately (see supplementary IV). Our results confirm recent indications for a strong magnon-phonon interaction in YIG at room temperature Agrawal et al. (2013); Schreier et al. (2013); Roschewsky et al. (2013).
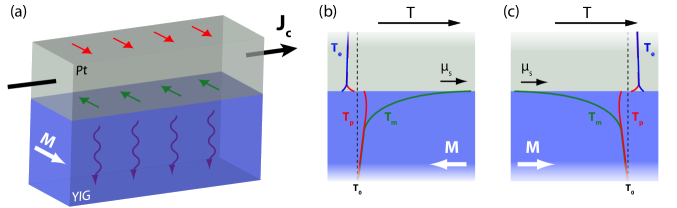
A charge current through a Pt strip generates a transverse spin current induced by the spin Hall effect that leads to a spin accumulation at the boundaries. At the interface to YIG the spin current is absorbed as a spin transfer torque proportional to the spin mixing conductance Brataas et al. (2006); Wang (2011), as depicted in Fig. 1(a). When the magnetic moment of the spin accumulation () at the PtYIG interface is parallel (antiparallel) to the average magnetization direction, the spin torque transfers magnetic momentum and energy from the electrons in the Pt to the magnons in the YIG (or vice versa). Magnons are thereby annihilated (excited) (see Fig. 1(b)) leading to cooling (heating) of the magnetic order parameter (see Fig. 1(c)). Since thermal magnons equilibrate with the lattice by magnon-phonon scattering, the non-equilibrium magnons affect the lattice temperature (see Fig. 1(b) and (c)) depending on the magnetization direction.
In the SSE Xiao et al. (2010) the spin current density () pumped from the YIG into the non magnetic metal is proportional to the temperature difference between the magnons and electrons at the interface () and the interface spin Seebeck coefficient , . In order to arrive at a symmetric linear response matrix that reflects Onsager symmetry, the sum of the products of currents and driving forces should be proportional to the dissipation Callen (1948), leading to (see supplementary I)
| (1) |
Here we used the Onsager Kelvin relation where the spin Seebeck and spin Peltier coefficients have been defined. is the average spin conductance per unit area when spin accumulation and magnetization are collinear, i.e. the at the YIGPt interface is either parallel or antiparallel to the average YIG magnetization. at room temperature G_S , where is the real part of the spin-mixing conductance per unit area. is the magnetic contribution to the interface heat conductance per unit area Schreier et al. (2013). The SPE heat current density we set out to discover is therefore
| (2) |
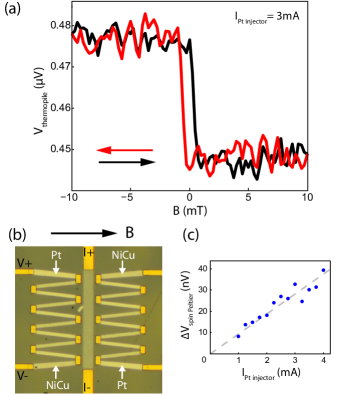
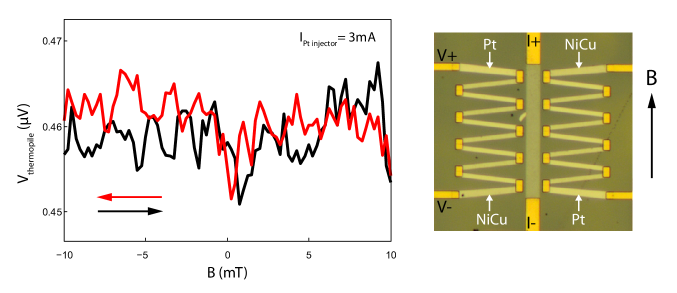
The devices designed for observing the SPE are fabricated on top of a 200 nm thick single-crystal (111) Y3Fe5O12 (YIG) film grown on a thick (111) Gd3Ga5O12 (GGG) substrate by liquid-phase-epitaxy. Two temperature sensors are fabricated in close proximity to the PtYIG interface. The optical microscope image in Fig. 2(b) shows the 202 and 5 nm thick Pt injector film. The thermopile sensors consist of five 40 nm thick Pt-Constantan (Ni45Cu55) thermocouples in series that are very sensitive because of the large difference in the Seebeck coefficient of these metals. In the thermopile on the right of the Pt injector the PtNi45Cu55 order is reversed for additional cross check measurements. The two thermopiles and the Pt injector are connected to 5100 nm thick titaniumgold contacts, providing good thermal anchoring and electrical contact to bonding pads away. All structures are patterned by electron beam lithography. The Pt injector and the Ni45Cu55 are deposited by DC sputtering while electron beam evaporation has been used to make the Au contacts and Pt thermocouple components.
An AC current is sent through the Pt injector, from I+ to I- (Fig. 2(b)), to create . The voltage over the thermopile (V+ and V-) is simultaneously recorded. Using a standard lock-in detection technique the first harmonic response () is extracted from the measured voltage. A low excitation frequency of 17 Hz was used to ensure a thermal steady-state condition. All measurements are carried out at room temperature.
In Fig. 2(a) the first harmonic voltage over the thermopile is shown as a function of an applied in-plane magnetic field () for a root-mean-square current of 3 mA through the Pt injector. A clear switch is observed just after the applied field becomes positive, in line with the magnetization reversal of YIG at very small coercive fields Vlietstra (2013). The signal switches back to its original value when reversing the field with a small hysteresis. We measure a SPE signal of 33 nV on top of a background voltage of . We observe linear scaling of the SPE signal for currents between 1 and 4 mA in the Pt (I)(see Fig. 2(c)). Results for four different samples (from two different batches) match the signal presented here within 15 %. The measurements were repeated with B rotated 90∘. No SPE signal was observed in this configuration while the background remained the same (see supplementary II), which confirms our interpretation.
In order to obtain quantitative information we carry out 3D finite element modelling of our devices comsol . As discussed above, the SPE heat current () flows between the electron and magnon systems through the PtYIG interface. is calculated using Eq. (2) and
| (3) |
where is the spin Hall angle, the Pt film thickness, the charge current density through the Pt injector, the Pt resistivity, the spin-flip diffusion length and a backflow correction factor. The heat charge current densities in Pt are modelled by a three reservoir model of thermalized phonons, magnons and electrons at temperatures , and , respectively Schreier et al. (2013). In linear response the charge () and heat () current densities in the bulk of the materials are related to their driving forces, i.e. gradients of (, , and ) as and
| (4) |
where is or , is the electrical conductivity, the Seebeck coefficient and , and are the phonon, magnon and electron thermal conductivities, respectively. The interaction between the magnon and phonon subsystems in YIG and between the phonon and electron subsystems in Pt are taken into account by using thermal relaxation lengths, and respectively (see supplementary III),
| (5) |
The phonon interface heat conductance () and heat exchange between magnons and electrons across the interface () are treated as boundary conditions Schreier et al. (2013) (see Supplementary III).
| S | ||||
|---|---|---|---|---|
| (S/m) | (/K) | (W/(m K)) | (W/(m K)) | |
| YIG | - | - | 6 | - |
| GGG | - | - | 8 | - |
| Au | 2.7107 | 1.7 | 1 | 179 |
| Pt injector | 3.5106 | -5 | 3 | 23 |
| Pt thermocouple | 4.2106 | -5 | 4 | 28 |
| Ni45Cu55 | 1106 | -30 | 1 | 9 |
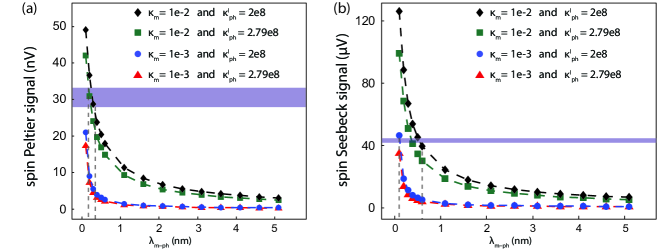
This model is evaluated for the material parameters listed in table 1. Additionally, we adopt m-2 Vlietstra (2013), Schreier et al. (2013), nm Schreier et al. (2013) and A/(m2K) Xiao et al. (2010); Schreier et al. (2013). The magnon heat conductivity of YIG () at room temperature is not well known so we used a of 10-2 and 10-3 W/(mK) in order to cover the range of estimated values Schreier et al. (2013); Douglass (1963). For PtYIG a of W/(m2K) obtained from the acoustic mismatch model was adopted Schreier et al. (2013). Since this model tends to overestimate the heat conductance Swartz (1989), we also used W/(m2K). In figure 3(a) the results are shown as a function of . The semi transparent blue horizontal bar indicates the range of measured SPE signals that are best fitted by a of 0.1 to 0.2 nm for the ranges of and discussed above.
SSE samples were fabricated and simulated by the same model and parameters used above (see Supplementary IV). In Fig. 3(b) the results are plotted and best fitted by between 0.2 and 0.5 nm, which is consistent with the values found for the SPE, as is indeed required by Onsager reciprocity. This implies that our model captures the essential physics of the interacting electron, magnon and phonon systems.
The observed SPE signal in Fig. 2(a) corresponds to a phonon temperature difference of 0.25 mK at the thermopile, which according to the model is 39 % of the phonon temperature difference directly at the PtYIG interface. By engineering devices in which the phonon heat loss through the substrate is minimized by thinner or etched YIG films could therefore significantly enhance the measured signal. Altering the Pt injector coupling to the heat sink or placing the thermocouple on top of the Pt injector might also help.
The found here is smaller than the one adopted by Ref. Schreier et al., 2013 ( 6nm) by roughly an order of magnitude. Actually Schreier et al.’s simulations might agree better with their measurements for smaller values as well. extracted from Fig. 3 is quite sensitive to small variations in the modelling, which implies a large uncertainty. Nevertheless even when accepting a large error bar from 0.1 to 6 nm for we may conclude that thermal magnons and phonons interact strongly Agrawal et al. (2013).
The background signal in the SPE data is a factor 20 higher than we would expect from conventional charge Peltier heating and cooling at the AuPt injector interfaces. Reference measurements on the second thermopile on the other side of the Pt injector excludes charge current leakage to the thermopile. For an identical configuration, V+ on the same side as I+, we find an opposite sign of the measured voltage, as expected for a thermal signal since the PtNi45Cu55 thermopile sequence is inverted. A current leak would not change sign and can therefore be excluded. The background in the second harmonic voltage is likely to be caused by the thermovoltage across the thermopile due to Joule heating in the Pt injector, since its value agrees within 17% with the modeled one. Additional measurements of frequency dependent properties (see Supplementary V) rule out pick-ups due to capacitive or inductive couplings.
We checked that the sign of the experimentally observed SPE and SSE signals obey reciprocity. Furthermore the voltage measured across the Pt detector in a RF spin pumping measurement matches the sign of the SSE voltage for the same geometry when heating the YIG relative to the Pt, as previously reported Sandweg et al. (2011); Weiler et al. (2013). However, the absolute sign of these three effects is still under investigation.
In conclusion, we report experimental proof that a spin accumulation at a PtYIG interface induces heat exchange between electrons and magnons on both sides. Using thermal modelling to knit the theory of interface transport to the observables we demonstrate that the SPE is the Onsager reciprocal of the SSE and confirm a strong interaction between thermal magnons and phonons in YIG, as reported earlier Agrawal et al. (2013). We hope that these results can contribute to a better understanding of coupling between thermomagnetic and thermoelectric properties. Our proof of principle opens new strategies for nanoscale cooling applications.
We would like to acknowledge B. Wolfs, M. de Roosz and J. G. Holstein for technical assistance. This work is part of the research program of the Foundation for Fundamental Research on Matter (FOM) and supported by NanoLab NL, Marie Curie ITN Spinicur, DFG Priority Programme 1538 ”Spin-Caloric Transport”, Grant-in-Aid for Scientific Research A (Kakenhi) 25247056 and the Zernike Institute for Advanced Materials.
References
- Uchida et al. (2010) K. Uchida, J. Xiao, H. Adachi, J. I. Ohe, S. Takahashi, J. Ieda, T. Ota, Y. Kajiwara, H. Umezawa, H. Kawai, G. E. W. Bauer, S. Maekawa, and E. Saitoh, Nature Materials 9, 894 (2010).
- Xiao et al. (2010) J. Xiao, G. E. W. Bauer, K. Uchida, E. Saitoh, S. Maekawa, Phys. Rev. B 81, 214418 (2010).
- Adachi et al. (2011) H. Adachi, J. I. Ohe, S. Takahashi, S. Maekawa, Phys. Rev. B 83, 094410 (2011).
- Hoffman et al. (2013) S. Hoffman, K. Sato, Y. Tserkovnyak, Phys. Rev. B 88, 064408 (2013).
- Hoffmann et al. (2013) A. Hoffmann, IEEE Trans. Magnetics 49, 5172 (2013).
- Schreier et al. (2013) M. Schreier, A. Kamra, M. Weiler, J. Xiao, G. E. W. Bauer, R. Gross, S. T. B. Goennenwein, Phys. Rev. B 88, 094410 (2013).
- Onsager et al. (1931) L. Onsager, Phys. Rev. 37, 405 426 (1931).
- Agrawal et al. (2013) M. Agrawal, V. I. Vasyuchka, A. A. Serga, A. D. Karenowska, G. A. Melkov, B. Hillebrands, Phys. Rev. Lett. 111, 107204 (2013).
- Roschewsky et al. (2013) N. Roschewsky, M. Schreier, A. Kamra, F. Schade, K. Ganzhorn, S. Meyer, H. Huebl, S. Geprägs, R. Gross, S. T. B. Goennenwein, arXiv 1309.3986v1 (2013).
- Brataas et al. (2006) A. Brataas, G. E. W. Bauer, P. J. Kelly, Phys. Rep. 427, 157 (2006).
- Wang (2011) Z. Wang, Y. Sun, M. Wu, V. Tiberkevich, A. Slavin, Phys. Rev. Lett. 107, 146602 (2011).
- Callen (1948) H. B. Callen, Phys. Rev. 73, 1349 (1948).
- (13) H. J. Jiao, J. Xiao, G. E. W. Bauer, in preparation.
- Vlietstra (2013) N. Vlietstra, J. Shan, V. Castel, B. J. van Wees, J. Ben Youssef, Phys. Rev. B 87, 184421 (2013).
- (15) COMSOL Multiphysics 4.2a .
- Vlietstra (2013) N. Vlietstra, J. Shan, V. Castel, J. Ben Youssef, G. E. W. Bauer, B. J. van Wees, Appl. Phys. Lett. 103, 032401 (2013).
- Douglass (1963) R. L. Douglass, Phys. Rev. 129, 1132 (1963).
- Swartz (1989) E. T. Swartz, R. O. Pohl, Rev. Mod. Phys. 61, 605 (1989).
- Bakker (2011) F. L. Bakker, J. Flipse, B. J. van Wees, J. Appl. Phys. 111, 084306 (2012).
- Sandweg et al. (2011) C. W. Sandweg, Y. Kajiwara, A. V. Chumak, A. A. Serga, V. I. Vasyuchka, M. B. Jungfleisch, E. Saitoh, B. Hillebrands, Phys. Rev. Lett. 106, 216601 (2011).
- Weiler et al. (2013) M. Weiler, M. Althammer, M. Schreier, J. Lotze, M. Pernpeintner, S. Meyer, H. Huebl, R. Gross, A. Kamra, J. Xiao, Y. T. Chen, H. J. Jiao, G. E. W. Bauer, S. T. B. Goennenwein, Phys. Rev. Lett. 111, 176601 (2013).
- Wang (2012) W. Wang, D. G. Cahill, Phys. Rev. Lett. 109, 175503 (2012).
- Uchida (2010) K. Uchida, H. Adachi, T. Ota, H. Nakayama, S. Maekawa, E. Saitoh, Appl. Phys. Lett. 97, 172505 (2010).
- Weiler (2012) M. Weiler, M. Althammer, F. D. Czeschka, H. Huebl, M. S. Wagner, M. Opel, I. Imort, G. Reiss, A. Thomas, R. Gross, S. T. B. Goennenwein, Phys. Rev. Lett. 108, 106602 (2012).
I SUPPLEMENTARY INFORMATION
II I. Onsager reciprocity for the spin Seebeck and spin Peltier effect
The linear response matrix of thermoelectrics reflects Onsager reciprocity when the sum of the products of currents times driving forces equals the dissipation Callen (1948). When and are the charge and heat currents driven by voltage and temperature differences and , equals the dissipation and we obtain the symmetric response matrix Callen (1948):
| (6) |
where is the electrical conductance, the Seebeck coefficient, and the heat conductance. Here the Onsager-Thomson relation for the Peltier coefficient has already been implemented.
In the case of the spin Seebeck effect (SSE) and the spin Peltier effect (SPE) for magnetic insulators, the spin accumulation at the interface drives a spin current. To ensure reciprocity, we have to compute the Joule heating caused by the spin currents:
| (7) |
where the subscripts denote the up and down spin contribution. Comparing this with the product of with :
| (8) |
we conclude that is the proper driving force. The linear response relations for spin and heat current densities at the interface between a normal metal and a ferromagnet then reads (Eq. (1) of the main text, where all variables and parameters are introduced):
| (9) |
and we omitted the charge sector because we are dealing with a ferromagnetic insulator.
III II. Measurement with B rotated 90∘
We repeated the measurements in the main text after rotating the magnetic field by 90∘ (see Fig. 4). The magnetization direction is here parallel to the current in the Pt film such that the current-induced spin accumulation is normal to the magnetization. The background voltage and noise level remain unmodified; we do not detect a heating or cooling of the ferromagnet. This confirms our interpretation of the experiments in the main text. The spin torque normal to the magnetization is not expected to affect the magnon temperature and the SPE should vanish, as observed.
IV III. The 3D finite element model
We adopt the three reservoir model of thermalized electron, magnon, and phonon systems. Charges are transported by the electron system only, while heat currents flow in all subsystems. We take into account spin angular momentum currents in the electron and magnon system, but disregard the phonon angular momentum current. The bulk charge and heat currents in linear response are given by Eq. (4) in the main text. The charge and energy conservation relations read:
| (10) |
with , and accounts for Joule heating. The other terms describe the heat exchange between phonons, magnons and electrons, as indicated by the subscripts. All parameters have been defined in the main text, except for the thermal relaxation lengths and The former is used as an adjustable parameter while the latter is calculated from the electron-phonon coupling parameter () for Au and Pt Wang (2012). This leads to a of 4.5 nm and a of 80 nm at room temperature.
The boundary conditions at the metalYIG interfaces are governed by the phonon () and magnetic () interface heat conductances. We adopt the values for from Ref. Schreier et al., 2013, while that for Ni45Cu55YIG is assumed to be equal to that of PtYIG. The interface magnetic heat conductance is calculated using Schreier et al. (2013)
| (11) |
where is the (spin pumping) magnetic coherence volume. The currents through the interface read
| (12) |
where are the phonon temperatures on the Pt/YIG side of the interface. and are the interface magnetic heat currents. The first terms on the r.h.s represent the heat current driven by temperature differences, while the second term is the heat current associated with the magnon injection by an applied (see Eq. (2) in the main text) that is responsible for the SPE.
V IV. Spin Seebeck effect
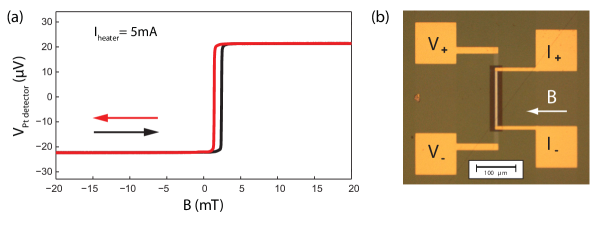
To verify reciprocity we fabricated samples nominally identical to the PtYIG heterostructures used for the SPE experiments in order to measure the longitudinal SSE Uchida (2010); Weiler (2012). Fig. 5(b) gives a picture of such a device consisting of a 5 nm thick sputtered Pt detector (250 x 10 m2) on top of a GGGYIG substrate as used for the study of the SPE effect. The Pt detector is covered with a 70 nm aluminium oxide (Al2O3) layer that electrically isolates the Pt detector from a 40 nm Pt film heater evaporated on top. Both the detector and heater are contacted by a 100 nm thick Au layer to large bonding pads.
By Joule heating, a charge current through the heater creates a thermal gradient over the PtYIG interface. The hot electrons transfer energy to the cold magnons, which is associated with a spin current in Pt that is converted to an observable charge current by the inverse spin Hall effect. This is the SSE.
In Fig. 5(a) the second harmonic voltage versus magnetic field is a measure of the Joule heating. A clear SSE signal is observed, which changes sign when the magnetization is reversed, as expected. The signal scales quadratically with the current and for B parallel to the Pt detector no SSE signal is detected, which confirms that the voltage is due to the inverse spin Hall effect.
The model discussed in the main text and the previous section can be applied to this measurement geometry to find the at the interface and the transverse voltage over the Pt detector Schreier et al. (2013):
| (13) |
where is the length of the Pt detector. The results obtained from the SSE modeling are shown in Fig. 3(b) of the main text.
VI V. Frequency dependent measurements
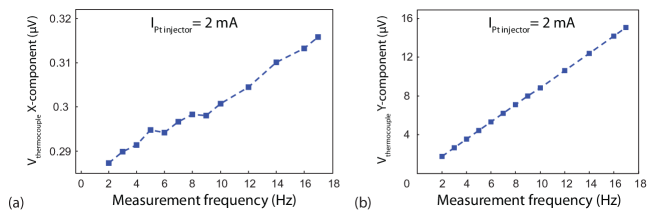
We measured the voltage as function of frequency in order to exclude any capacitive or inductive coupling between the Pt injector and the thermopile (see Fig. 6). The in-phase voltage (-component) slightly decreases with frequency, leading to a frequency-dependent voltage of around 10% at our usual measurement frequency of 17 Hz (Fig. 6(a)). The out-of-phase voltage (-component) linearly depends on frequency and vanishes for zero frequency, as expected.
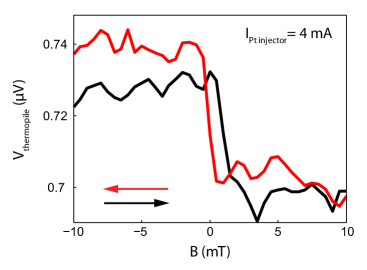
In Fig. 7 the first harmonic voltage across the thermopile is shown for a 4 mA current through the Pt injector with a frequency of 3 Hz. A clear SPE signal is observed with the same magnitude as for the measurements at 17 Hz . From these results we can safely conclude that the measured signal is not affected by any spurious capacitive or inductive signals. Furthermore at these low frequencies the thermal time constants are much shorter than the period of the measurement modulation.