Discovery of the Third Transient X-ray Binary in the Galactic Globular Cluster Terzan 5
Abstract
We report and study the outburst of a new transient X-ray binary (XRB) in Terzan 5, the third detected in this globular cluster, Swift J174805.3-244637 or Terzan 5 X-3. We find clear spectral hardening in Swift/XRT data during the outburst rise to the hard state, thanks to our early coverage (starting at ergs/s) of the outburst. This hardening appears to be due to the decline in relative strength of a soft thermal component from the surface of the neutron star (NS) during the rise. We identify a Type I X-ray burst in Swift/XRT data with a long (16 s) decay time, indicative of hydrogen burning on the surface of the NS. We use Swift/BAT, MAXI/GSC, Chandra/ACIS, and Swift/XRT data to study the spectral changes during the outburst, identifying a clear hard-to-soft state transition. We use a Chandra/ACIS observation during outburst to identify the transient’s position. Seven archival Chandra/ACIS observations show evidence for variations in Terzan 5 X-3’s non-thermal component, but not the thermal component, during quiescence. The inferred long-term time-averaged mass accretion rate, from the quiescent thermal luminosity, suggests that if this outburst is typical and only slow cooling processes are active in the neutron star core, such outbursts should recur every 10 years.
Subject headings:
accretion, accretion disks – globular clusters: individual (Terzan 5) – stars: neutron – X-rays: binaries – X-rays: bursts – X-rays: individual (Swift J174805.3-244637)1. Introduction
Transient low-mass X-ray binaries (LMXBs) experience long periods (often years to tens of years) of quiescence. In quiescence matter flowing from the companion builds up in the accretion disk, punctuated by outbursts when the accretion disk crosses a pressure and temperature threshold, increases in viscosity, and dumps large quantities of matter onto the accreting compact object (e.g., see Lasota, 2001, for a review). Their outbursts go through phases of varying X-ray spectra. These phases are generally interpreted as indicating the changing relative contributions of Comptonized optically thin emission vs. blackbody-like emission from an accretion disk, as the accretion rate and geometry change (e.g., Remillard & McClintock, 2006; Done et al., 2007, for reviews). These X-ray spectral states have been studied both for black hole LMXBs, and for NS LMXBs (e.g., Hasinger & van der Klis, 1989; Gierliński & Done, 2002; Gilfanov et al., 2003; Gladstone et al., 2007; Lin et al., 2007), which show an additional component from the NS surface.
The spectra of NS LMXBs in quiescence ( ergs/s) include thermal radiation from the (usually hydrogen) NS atmosphere (blackbody-like; Zavlin et al., 1996; Rajagopal & Romani, 1996), and often a harder nonthermal component, usually fit with a power-law (Campana et al., 1998). Several NS LMXBs have shown rapid, strong variability in quiescence indicative of accretion events, which can sometimes be clearly attributed to variation in both the thermal and power-law components (e.g., Rutledge et al., 2002; Campana et al., 2004; Cackett et al., 2010; Fridriksson et al., 2011). The thermal component can be produced either by re-radiation of stored heat from the cooling NS (Brown et al., 1998), or by low-level accretion (Zampieri et al., 1995; Deufel et al., 2001), which produce similar spectra (Zampieri et al., 1995).
Studies of the spectra of black hole LMXBs during their decline from the low/hard state into quiescence (as falls below ergs/s) have found clear softening (Corbel et al., 2006, 2008; Armas Padilla et al., 2013a; Plotkin et al., 2013). The softening of black hole LMXB spectra has been interpreted as a change in the origin of the X-ray emission, produced at low luminosities by either a radiatively inefficient hot flow (Esin et al., 1997; Gardner & Done, 2012) or synchrotron emission from a jet (Yuan & Cui, 2005; Pszota et al., 2008). A similar softening in the spectrum from the accretion flow occurs in NS systems at similar luminosities, where emission from the NS surface can play a role (Armas Padilla et al., 2011; Degenaar et al., 2013a; Linares et al., 2013).
Thermonuclear X-ray bursts burn accumulated hydrogen and/or helium on the NS surface, producing blackbody-like emission with a rapid rise, cooling over timescales of seconds to minutes (Lewin et al., 1993; Galloway et al., 2008). X-ray bursts occurring in hydrogen-poor environments (either due to no hydrogen being present in the accreted material, or hydrogen being stably burned during accretion) show different properties from those in hydrogen-rich environments. The ratio of energy released by fusion in a burst to energy released during accretion is lower for helium bursts compared to hydrogen bursts due to the lower energy available from fusion.
Helium bursts generally have faster rise and decline times, since hydrogen burning involves the CNO cycle and thus is limited by the speed of -decays (Fujimoto et al., 1981). Pure He bursts can be ignited in neutron stars that accrete hydrogen at low mass accretion rates (e.g., Peng et al. 2007), but neutron stars known to be accreting hydrogen-poor material (ultracompact systems with white dwarf donors) never show evidence of hydrogen-rich bursts (Galloway et al., 2008). Some bursts from ultracompact systems are relatively long, but these “giant” (or “intermediate-duration”) bursts exhibit dramatic photospheric radius expansion, thought to be produced by a thick layer of accumulated He, which can accumulate only at low (0.01) accretion rates (in’t Zand et al., 2005).
Globular clusters are highly efficient at producing X-ray binaries through dynamical interactions, such as the exchange of (heavy) NSs into pre-existing binary stars, replacing the lower-mass star in the binary. Of perhaps 200 galactic LMXBs known to have reached ergs/s , 18 (including Terzan 5 X-3) are located in globular clusters, a factor of 100 overabundance per unit stellar mass compared to the galactic disk. LMXBs are concentrated in the densest, most massive globular clusters, which have the highest predicted rates of stellar interactions (e.g., Verbunt & Hut, 1987; Heinke et al., 2003c). Studying the number and types of LMXBs in different globular clusters can help us understand the dynamical processes that produce LMXBs in clusters. For example, identifying multiple LMXBs in one cluster has implications for interpreting observations of X-ray emission from extragalactic globular clusters (such as their luminosity functions), where multiple LMXBs cannot be resolved (e.g., Sivakoff et al., 2007). Before Terzan 5 X-3, no more than two bright LMXBs had been identified in any one globular cluster (White & Angelini, 2001; Heinke et al., 2010; Pooley et al., 2010).
Terzan 5 is a dense and massive globular cluster close to the center of our Galaxy (d=5.9 kpc, Valenti et al., 2007), showing evidence of two separate stellar populations of different iron abundances, ages and helium content (Ferraro et al., 2009; D’Antona et al., 2010). Calculations of its stellar encounter rate suggest it may produce more X-ray binaries than any other Galactic globular cluster (Verbunt & Hut, 1987; Lanzoni et al., 2010; Bahramian et al., 2013). This status is supported by the largest population of known millisecond radio pulsars in any globular cluster, which are thought to be the descendants of LMXBs (Ransom et al., 2005; Hessels et al., 2006). Terzan 5 also hosts more than 50 known X-ray sources (Heinke et al., 2006b), including a dozen likely quiescent LMXBs (again the most numerous in any cluster).
Outburst of transient LMXBs have frequently been observed from Terzan 5 (Makishima et al., 1981; Warwick et al., 1988; Verbunt et al., 1995). Chandra observed one such outburst in 2000 (Heinke et al., 2003a), pinning down the location of an LMXB called EXO 1745-248111Note that the true identity of the transient seen by EXOSAT in the 1980s (leading to the EXO name) is not known., which was shown to have an unusually hard spectrum in quiescence during later Chandra observations (Wijnands et al., 2005; Degenaar & Wijnands, 2012). Another Terzan 5 outburst was identified in 2002 in RXTE All-Sky Monitor data (Wijnands et al., 2002a), but no imaging observations were taken. In 2010 an outburst was seen from an 11 Hz pulsar, IGR J17480-2446 (Terzan 5 X-2, Bordas et al. 2010; Strohmayer & Markwardt 2010), leading to a variety of detailed studies of the orbit and spin period, bursts, spectrum, burst oscillations, and evolution (e.g., Papitto et al., 2011; Chakraborty et al., 2011; Miller et al., 2011; Motta et al., 2011; Cavecchi et al., 2011; Linares et al., 2011, 2012; Patruno et al., 2012; Papitto et al., 2012; Altamirano et al., 2012a). A Chandra observation identifying the outbursting source (Pooley et al., 2010) allowed follow-up observations to track the crustal cooling of the NS (Degenaar et al., 2011; Degenaar & Wijnands, 2011; Degenaar et al., 2013b), while the even more precise moon occultation position (Riggio et al., 2012) permitted identification of the near-IR counterpart (Testa et al., 2012). Another Terzan 5 outburst, in 2011, was identified as EXO 1745-248 through a Chandra observation (Pooley et al., 2011a), and showed a superburst (a very long and energetic X-ray burst, thought to be powered by the burning of a thick layer of carbon) at the beginning of the outburst (Serino et al., 2012; Altamirano et al., 2012c)
In this paper we identify and study the outburst of the third transient X-ray binary in the globular cluster Terzan 5, Swift J174805.3-244637 (henceforth Terzan 5 X-3). We detected this transient using Swift/XRT(Wijnands et al., 2012), and identified spectral hardening in the rise of the outburst (Heinke et al., 2012), a Type I X-ray burst (Altamirano et al., 2012b), and the quiescent X-ray counterpart in Chandra images (Homan & Pooley, 2012). In §2 we present the X-ray data used and describe our data extraction. In §3 we derive the position of Terzan 5 X-3 by comparing observations before and during the outburst, analyze the spectral variation of the persistent emission throughout the outburst, study the properties of the thermonuclear burst, and analyze its quiescent X-ray spectrum. Finally, we discuss our results in §4.
2. Data Extraction
2.1. Swift/XRT
We monitored Terzan 5 up to a few times per week for part of 2012 with the Swift/XRT, covering the 0.3-10 keV energy range (Burrows et al., 2005), as part of our monitoring campaigns of globular cluster X-ray transients (see Altamirano et al., 2012c, Altamirano et al. in prep.). This monitoring enabled us to observe the rising outburst of a new transient (and the 3rd known transient LMXB in this cluster) first detected on July 6th, 2012 (Wijnands et al., 2012).
We used Swift/XRT’s photon counting (PC) mode, which produces two-dimensional images, and windowed timing (WT) mode for which CCD data is collapsed into a one-dimensional image for fast readout. PC mode data should be checked for pile-up when the count rate exceeds 0.5 count s-1. Pile-up is the recording of multiple photons as a single event, leading in the worst case to rejection of all events from the center of the point-spread function, or PSF. Our Swift/XRT observations include 22 observations during the outburst, with 8 observations in WT and the rest in PC mode (Table 1).
We used HEASOFT 6.12 and FTOOLS222http://heasarc.gsfc.nasa.gov/ftools/ (Blackburn, 1995) to reduce and analyze the data. We reprocessed the data with the FTOOLS xrtpipeline and manually extracted data for spectral analysis. We investigated every observation for pile-up, following the Swift/XRT pile-up thread333http://www.swift.ac.uk/analysis/xrt/pileup.php, and extracted data from an annulus around the source in PC mode observations that suffered from pile-up.We subtracted background from a circular region in the vicinity of the source in all PC observations. The extraction region for WT data was chosen to be a box around the event array (background subtraction was unnecessary for these countrates), as discussed in the Swift/XRT data reduction guide444http://heasarc.nasa.gov/docs/swift/analysis. We extracted spectra in the 0.5-10 keV bandpass using FTOOLS xselect, and created ancillary response function (ARF) files for each observations using FTOOLS xrtmkarf. We performed spectral analysis using XSPEC 12.7.1 (Arnaud, 1996).
For heavily absorbed sources, WT data show low energy spectral residuals, which look like a “bump” in the spectrum, and cause spectral uncertainties in the keV region555http://www.swift.ac.uk/analysis/xrt/digest_cal.php. We compared Swift/XRT WT mode data to Chandra data (§2.2) taken within a few days, fitting them with the same model to find the energy range in which discrepancies appear. Based on this comparison, we ignored data below keV in all WT observations during the outburst.
test?! Obs. ID Date MJD Exposure avg. count rate Notes (count s-1) Swift/XRT observations 32148002 2012-02-09 55966.9 985 s 1.75 PC mode; quiescent 91445001 2012-06-11 56089.8 913 s 2.67 PC mode; quiescent 91445002 2012-06-16 56094.5 1028 s 1.48 PC mode; quiescent 91445003 2012-06-21 56099.0 1033 s 1.66 PC mode; quiescent 91445004 2012-06-26 56104.8 1050 s 9.68 PC mode; quiescent 91445005 2012-06-30 56108.6 935 s 1.40 PC mode; quiescent 91445006 2012-07-06 56114.8 1197 s 7.65 PC mode; First detection of rise;(1) 32148003 2012-07-07 56115.8 987 s 0.154 PC mode;(2) 32148004 2012-07-08 56117.0 987 s 0.245 PC mode;(2) 32148005 2012-07-10 56118.1 781 s 1.26 PC mode; Piled up;(2) 32148006 2012-07-12 56120.7 978 s 3.19 PC mode; Piled up; Hard/soft transition 526511000 2012-07-13 56121.7 251 s 11.4 WT mode 91445008 2012-07-16 56124.3 253 s 14.2 WT mode 526892000 2012-07-16 56124.9 596 s 14.9 WT mode 32148007 2012-07-17 56125.9 960 s 20.4(16.3)a WT mode; Type I X-ray burst;(3) 91445009 2012-07-21 56129.1 1173 s 71.8 WT mode 91445010 2012-07-26 56134.1 612 s 23.5 PC mode; Piled up 91445011 2012-08-01 56140.1 985 s 52.1 WT mode 91445012 2012-08-05 56144.8 1057 s 24.1 WT mode; Return to hard state? 91445013 2012-08-10 56149.4 1031 s 4.15 WT mode 32148008 2012-08-11 56150.1 1488 s 3.16 PC mode; Piled up 32148011 2012-08-13 56152.2 1480 s 2.47 PC mode; Piled up 530808000 2012-08-13 56152.4 774 s 2.97 PC mode; Piled up 32148010 2012-08-14 56153.2 1494 s 2.51 PC mode; Piled up 91445014 2012-08-15 56154.3 1060 s 2.17 PC mode; Piled up 32148012 2012-08-19 56158.3 2153 s 1.78 PC mode; Piled up 91445015 2012-08-20 56159.1 1006 s 2.14 PC mode; Piled up 91445016 2012-08-24 56163.2 1131 s 1.05 PC mode 32148013 2012-08-30 56169.3 2075 s 2.95 PC mode; quiescent 32148014 2012-09-13 56177.6 1953 s 2.02 PC mode; quiescent 32148015 2012-09-20 56184.6 1976 s 1.98 PC mode; quiescent Chandra/ACIS observations 3798 2003-07-13 52833.6 39.34 ks 9.91 quiescent; (4,5) 10059 2009 -07-15 55027.7 36.26 ks 7.42 quiescent; (6,7) 13225 2011-02-17 55609.3 29.67 ks 5.56 quiescent; (6,7) 13252 2011-04-29 55680.7 39.54 ks 6.78 quiescent; (7,8) 13705 2011-09-05 55809.7 13.87 ks 5.69 quiescent; (9) 14339 2011-09-08 55812.1 34.06 ks 6.08 quiescent; (9) 13706 2012-05-13 56060.7 46.46 ks 7.58 quiescent; (9) 13708 2012-07-30 56138.4 9.84 ks 6.60 Terzan 5 X-3 outburst; Piled up; (10,11)
2.2. Chandra/ACIS
We observed Terzan 5 X-3 during outburst with Chandra/ACIS in full-frame and FAINT telemetry mode with no grating (Obs. ID: 13708, PI: Pooley). We also used Chandra archival data for our analysis of this source, details of which can be found in Table 1. All archival observations were taken in FAINT telemetry mode with the ACIS-S3 CCD at the focus. We analyze Chandra/ACIS data in the 0.5-10 keV energy range.
Data was reprocessed using CIAO 4.4 (Fruscione et al., 2006), with CALDB 4.4.8, following the standard CIAO science threads666http://cxc.harvard.edu/ciao/threads/index.html. We used observations during which all sources in the globular cluster were in quiescence. We reprocessed the data, corrected the relative astrometry and ran CIAO reproject_events, and then stacked the event files together using CIAO dmmerge.
Spectra were then extracted from both the archival and new data using CIAO task dmextract. Terzan 5 X-3 was heavily piled up in the new observation (in outburst), and so we extracted a spectrum from the readout streak. Finally, we combined all archival (quiescent data) using FTOOLS addspec777We found the results from CIAO’s combine_spectra and FTOOLS’s addspec completely identical.. Combining the quiescent data resulted in 240 ks of exposure time.
2.3. MAXI/GSC
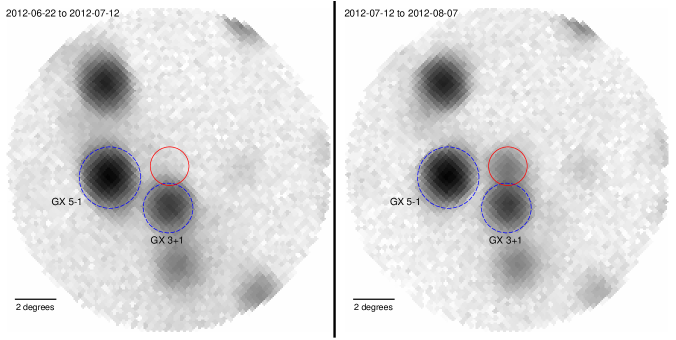
The MAXI all sky X-ray monitor’s (Matsuoka et al., 2009) GSC detector data covers the 2-20 keV energy range, and one-day averaged light curves are publicly provided in four bands: 2-4 keV, 4-10 keV, 10-20 keV and 2-20 keV (Mihara et al., 2011). We noticed two problems with MAXI/GSC light curves. Due to the low spatial resolution of MAXI/GSC and bright sources in the crowded field of Terzan 5, there is the possibility of background contamination from nearby sources like GX 3+1 and GX 5-1 (Fig. 1). Since these two sources showed stable X-ray brightness with no obvious variations in the MAXI/GSC data during Terzan 5 X-3 outburst, the background contamination may lead to a constant enhanced background.
We also noticed that MAXI/GSC light curves show periodic behaviour with a period of 35 days for various well-known stable X-ray sources (e.g., the Crab nebula). This is caused by calibration issues regarding the 70-day precession of the International Space Station’s orbit (MAXI team 2013, priv. comm.). This problem principally affects the 2-4 keV data, with less effect on the 4-10 and 10-20 keV light curves. Thus we ignored the 2-4 keV lightcurves for this research. We also ignored MAXI/GSC 10-20 keV band lightcurves, due to the low statistical significance of Terzan 5 X-3’s detection there. We decontaminated the MAXI/GSC 4-10 keV lightcurve assuming a constant background count rate of 0.023, calculated based on a weighted average of the count rates before the outburst for a period of 120 days, with the addition of a systematic error based on the rms variations in the light curve before the outburst. We used the corrected values of the statistical uncertainties in MAXI/GSC data, as the MAXI team announced an erratum in the reported statistical uncertainties on April 26, 2013 (MAXI team 2013, priv. comm.) noting that the corrected uncertainties are a factor of 2 larger than previously reported.
2.4. Swift/BAT
The Swift/BAT telescope data covers 15-150 keV energy range (Barthelmy et al., 2005). We used daily light curves from the Swift/BAT transient monitor results provided by the Swift/BAT team (Krimm et al., 2013). Data points on these daily light curves are from Swift/BAT survey data and are represented in a single band (15-50 keV). These points are the weighted average of all observations performed each day. The Swift/BAT has better angular resolution (20 vs.1 degree FWHM for Swift/BAT vs. MAXI/GSC). Such an improvement in the angular resolution limits the chances of contamination occurring. Although we cannot rule out some contamination, it seems reasonable that it does not pose a serious problem. As such, it is not surprising that we do not see evidence of contamination of the Swift/BAT data by nearby sources as is identifiable in the MAXI data.
3. Analysis and Results
3.1. Position
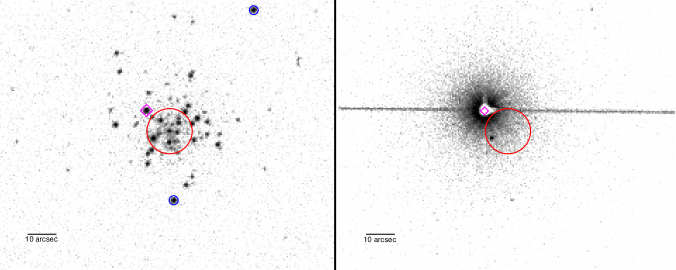
We accurately and precisely located the position of Terzan 5 X-3, using the Chandra/ACIS data. We compared the Chandra/ACIS observation taken during the outburst and a stacked image of 7 Chandra/ACIS observations taken when all Terzan 5 sources were in quiescence (§2.2, Table 1). We corrected the astrometry in the outburst observation by comparing the positions (using the CIAO wavdetect tool) of three other sources in this observation with their astrometrically corrected positions as reported in Heinke et al. (2006b). Using a weighted average of the required shifts (+0.23′′ for RA and +0.04′′ for Dec), we find the position of Terzan 5 X-3 to be RA= 17:48:05.41 and Dec=24:46:38.0, in agreement (2) with the published position of the X-ray source CXOGLB J174805.4-244637 (Heinke et al. 2006b), at RA= 17:48:05.413 and Dec=24:46:37.67 (Fig. 2).
3.2. Phases of the outburst
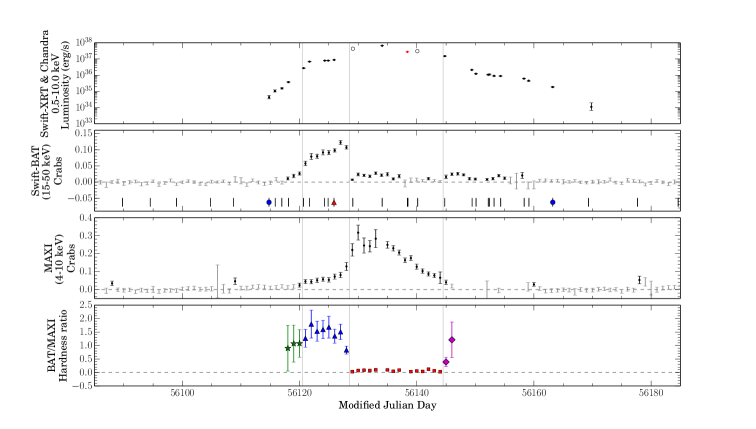
We used MAXI/GSC and Swift/BAT hard X-ray transient monitor light curves to study the evolution of Terzan 5 X-3’s outburst in the soft X-ray (4-10 keV, MAXI/GSC) and hard X-ray (15-50 keV, Swift/BAT) bands. We converted count rates into equivalent fluxes from the Crab Nebula to make these light curves suitable for comparison. For this purpose, we used conversion coefficients given for each instrument888MAXI- http://maxi.riken.jp/top/index.php?cid=000000000036 Swift/BAT- http://swift.gsfc.nasa.gov/docs/swift/results/transients: for the Swift/BAT hard X-ray transient monitor 1 Crab = 0.22 count cm-2 sec-1 and for the MAXI/GSC 4-10 keV band 1 Crab = 1.24 count cm-2 sec-1. We plot the light curves for Terzan 5 X-3’s outburst as seen by both MAXI/GSC and Swift/BAT, and their ratio, in Fig. 3.
We distinguish four phases of Terzan 5 X-3’s outburst. (a) Rise: the hard X-ray brightness of the source increases, the source eventually becoming significantly detected in the soft X-ray as well. (b) Hard state: hard X-ray brightness reaches its peak. (c) Soft state: soft X-ray brightness peaks while hard X-ray brightness drops. (d) Decline: the source briefly gets brighter in the hard X-ray again before turning off. Unfortunately there is insufficient data from the MAXI /GSC during the decline of the outburst. Therefore, we are unable to confirm that Terzan 5 X-3 returns to the hard state during its decline.
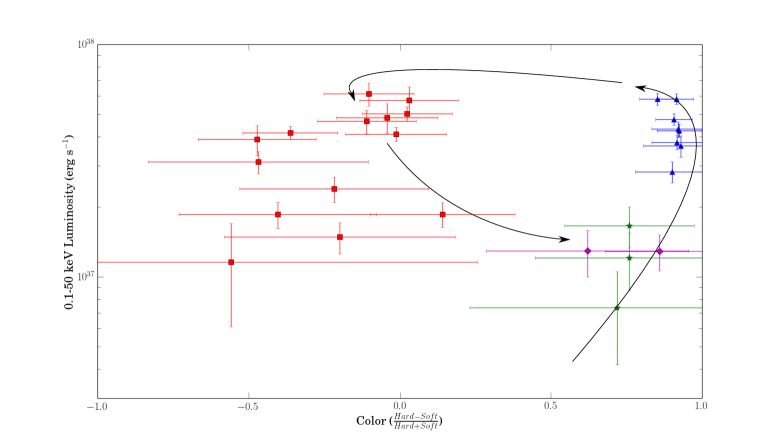
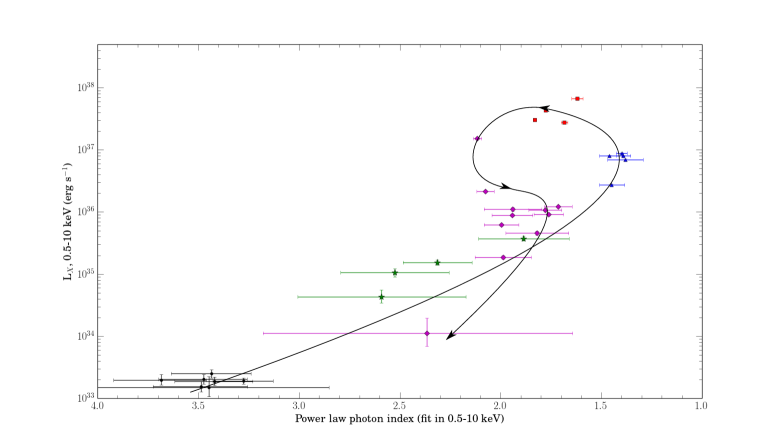
We used the soft X-ray (MAXI/GSC 4-10 keV, S) and hard X-ray (Swift/BAT 15-50 keV, H) lightcurves, to create a color-luminosity diagram (as an analogy to a hardness-intensity diagram, Fender et al. 2004) for the outburst (Fig. 4). We defined our color to be (H-S)/(H+S), and defined luminosity as (H+S), converting count rates to luminosities in each band before their summation or subtraction. We converted count rates to luminosities with the assumption of a 5.9 kpc distance and power-law spectra, using power-law index values inferred from Swift/XRT data spectral fitting (§3.3.2). We extrapolated the MAXI/GSC 4-10 keV band flux to 0.1-12 keV and the Swift/BAT 15-50 keV band flux to 12-50 keV, and calculated luminosities in the 0.1-50 keV band. We cannot measure the spectral index above 10 keV, but since in the hard state the spectra are typically reasonably described by a power-law up to 50 keV, and in the soft state the flux above 12 keV is a minor contribution to the total, this is unlikely to have a large effect. In the 0.5-10 keV band, the source was bright for approximately 20 days, reaching a maximum luminosity of 71037 erg s-1 and an average luminosity of 31037 erg s-1 in this time interval. The evolution of the outburst and phases mentioned above can be clearly seen in this color-luminosity diagram (Fig. 4). Spectral evolution during the outburst, including at fainter fluxes but with a more limited bandpass, can also be seen in Swift/XRT observations (§3.3.2).
3.3. Spectral analysis
3.3.1 Hydrogen column density of Terzan 5
The first step in our spectral analysis is constraining hydrogen column density , which we check by spectral analysis of multiple sources in the cluster. Since the sources are located within 1’ of each other, we expect little variation in along the different sightlines. Except for LMXBs observed at high inclination, generally the measured throughout an outburst appears to be stable (Miller et al., 2009), so we assume that Terzan 5 X-3’s remains constant. We used Chandra/ACIS observations of Terzan 5 taken when all sources were quiescent (Table 1). We extracted spectra of three of the brighter faint sources in Terzan 5 (Terzan 5 X-3, CXOGLB J174804.7-244709 and CXOGLB J174802.6-244602; Heinke et al. 2006b, Fig. 2) from each observation using CIAO dmextract and combined the extracted spectra for each source. We fit these combined spectra, along with the Chandra spectrum of Terzan 5 X-3 during the outburst, simultaneously. We used appropriate models based on previous studies of each faint source (Heinke et al., 2006b), confirmed as acceptable fits. For Terzan 5 X-3 during quiescence, and for CXOGLB J 174804.7-244709, we used a NS atmosphere (NSATMOS, Heinke et al. 2006a) plus a power-law (PEGPWRLW). For CXOGLB J 174802.6-244602 we used a power-law. Finally, for Terzan 5 X-3 during outburst, we used a disk model (DISKBB) plus a thermal Comptonization model (COMPTT, Titarchuk 1994). We fit all these spectra simultaneously with a single value of , using the PHABS model in XSPEC, with Anders & Grevesse (1989) abundances, finding cm-2. Individual spectral fits gave consistent results, with differences below the 10 level. This value is consistent with the measurements in Heinke et al. (2003a), Wijnands et al. (2005), Heinke et al. (2006b), and Degenaar et al. (2011), though not with the lower value of Miller et al. (2011)999Miller et al. (2011) report NH=(1.171022 cm-2, though they do not report the abundance scale they use., and is consistent with the E(B-V) estimates in Valenti et al. (2007) and Massari et al. (2012), using the Güver & Özel (2009) relation to . We note that Miller et al. (2011) fit a simple blackbody plus power-law to the outburst spectrum of IGR J17480-2446 (Terzan 5-X2), which may lead to systematic differences compared to more complex outburst spectral models. We used our best-fit value in the PHABS model, using default abundances, for the rest of the spectral analysis throughout this paper.
For comparison, we also used the same procedure for constraining using the TBABS model (instead of PHABS), with Wilms et al. (2000) abundances, finding an increase in to cm-2. The remaining parameters agreed within the errors with the results using our default absorption model, indicating that for our level of analysis only internal consistency is required in the choice of absorption model.
3.3.2 Outburst
The spatial resolution of Swift/XRT is such that we must account for possible contamination due to emission form other XRBs in the cluster. To assess these levels, we fit the spectra of pre-outburst observations (using the same extraction region as for the outburst spectra), finding a background level of ergs/s. We used 6 Swift/XRT observations taken before the outburst to estimate the combined spectrum from the other cluster sources. Due to the low number of counts per observation, we combined their spectra. We fit the resulting pre-outburst spectrum with an absorbed power-law model (Table 2) with fixed to cm-2, based on the results in §3.3.1.
For our initial spectral analysis, we used an absorbed power-law model to fit Terzan 5 X-3’s spectrum, including a second power-law component with values fixed to the pre-outburst results to model the background (Table 2, Fig. 5). A simple power-law model provided a good fit to most of the spectra (Table 2), while physically motivated complex spectral models could not be well-constrained for the high-quality bright outburst spectra (see below), so we focus on the results from power-law fits. This spectral analysis shows a significant drop of photon index from 2.60.7 to 1.40.1 during the outburst rise (Fig. 5), showing a clear hardening of the spectrum during the rise from quiescence. During the hard state, the photon index shows no significant variations and is . After the phase transition to the soft state, the photon index softens to , with significant variations and several poor fits.
Several spectral models have been suggested in the literature to model the detailed spectra of transient NS LMXBs in outburst, see e.g., Lin et al. (2007). These models usually contain a soft component for the radiation from the disk and/or boundary layer (i.e., a multi-color black body) and a hard component for the radiation from the hot corona around the accreting object (i.e., Comptonized radiation). We attempted to perform analyses of Terzan 5 X-3’s outburst spectra using a variety of complex models with multiple components (e.g., DISKBB + COMPTT, BBODY+COMPTT, BBODY+BKNPOW). We could not obtain strong constraints on the spectral parameters due to the limited energy band available and limited statistical quality of the XRT data. The Swift/XRT WT spectra suffered particularly from calibration issues below 1 keV(§2.1). The Swift/BAT survey mode hard (15 keV) X-ray spectra had a low signal to noise ratio, which prohibited spectral analysis. We defer further detailed spectral fitting, e.g. to clearly distinguish thermal vs. nonthermal components, to future work.
| Obs. ID | MJD | Photon index | Flux | LX | /D.O.F(nhp) |
|---|---|---|---|---|---|
| 32148002-91445005 | 55966-56108 | 2.4 | 2.4 | 1.0 | 0.68/7(0.69) |
| 91445006 | 56114.8 | 2.60.7 | 10 | 4 | 0.83/6(0.54) |
| 32148003 | 56115.8 | 2.50.4 | 25 | 10 | 0.85/5(0.51) |
| 32148004 | 56117.0 | 2.30.3 | 37 | 152 | 1.86/9(0.052) |
| 32148005 | 56118.1 | 1.90.4 | 90 | 375 | 0.54/6(0.78) |
| 32148006 | 56120.7 | 1.40.1 | 658 | 27313 | 1.58/19(0.05) |
| 526511000 | 56121.7 | 1.40.1 | 1658 | 688 38 | 1.20/14(0.27) |
| 91445008 | 56124.3 | 1.460.08 | 1920 | 797 26 | 0.69/25(0.87) |
| 526892000 | 56124.9 | 1.390.06 | 1936 | 803 19 | 1.56/34(0.03) |
| 32148007 | 56125.9 | 1.400.04 | 2125 | 882 17 | 1.05/37(0.38) |
| 91445009a | 56129.1 | 1.8? | 10440 | 4333? | 3.94/56() |
| 91445010 | 56134.1 | 1.620.05 | 16070 | 6669137 | 0.77/36(0.84) |
| 13708a(CXO) | 56138.4 | 1.680.03 | 6680 | 277233 | 1.76/102() |
| 91445011a | 56140.1 | 1.8? | 7330 | 3042? | 2.10/80() |
| 91445012 | 56144.8 | 2.110.03 | 3651 | 151529 | 1.12/38(0.27) |
| 91445013 | 56149.4 | 2.070.07 | 514 | 213 8 | 1.10/58(0.28) |
| 32148008 | 56150.1 | 1.70.1 | 295 | 122 7 | 0.81/45(0.81) |
| 32148011 | 56152.2 | 1.80.1 | 260 | 1087 | 0.70/37(0.91) |
| 530808000 | 56152.4 | 1.90.2 | 266 | 110 12 | 1.12/10(0.34) |
| 32148010a | 56153.2 | 1.80.1 | 219 | 915 | 1.79/44() |
| 91445014 | 56154.3 | 1.90.2 | 215 | 897 | 1.06/23(0.38) |
| 32148012 | 56158.3 | 2.00.1 | 149 | 625 | 1.06/33(0.37) |
| 91445015 | 56159.1 | 1.80.3 | 110 | 465 | 0.97/10(0.47) |
| 91445016 | 56163.2 | 2.00.2 | 45 | 192 | 1.49/16(0.09) |
| 32148013 | 56169.3 | 2.4 | 2.7 | 1.1 | - |
3.3.3 Thermonuclear burst
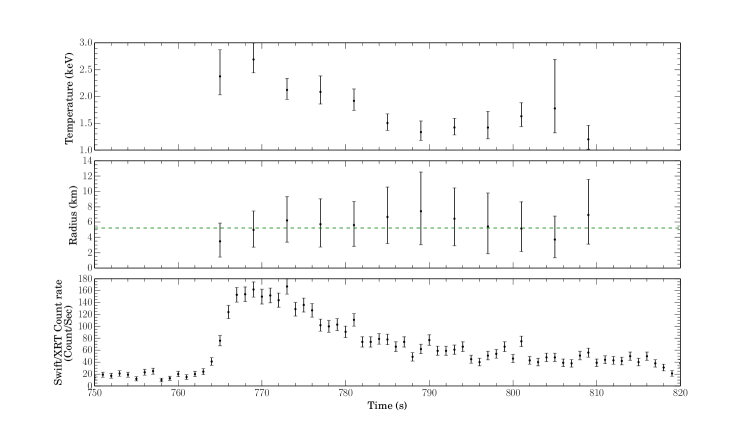
During Swift/XRT ObsID 32148007, which started at 20:54:00 UT on 2012 July 17 we detected an eightfold count rate increase over three seconds, starting at 21:06:40, followed by a slower decline over 1 minute (Fig. 6, bottom panel), suggestive of a thermonuclear burst (Altamirano et al., 2012b). Using FTOOLS xselect, we divided the data from this observation into time intervals of 4 seconds each. We extracted spectra from each time interval using FTOOLS xselect and analyzed the spectra.
During this thermonuclear burst, the count rate reached 160 count s-1. There is a possibility of pileup in Swift/XRT observations in windowed timing mode when the count rate exceeds 100 count s-1 (Romano et al. 2006). Following the Swift/XRT pile-up thread for WT data, we extracted spectra while excluding increasingly large fractions of the central PSF. Doing this, we found that the fitted photon index did not change, and thus we found no significant signs of pileup in this observation during the burst.
We fit an absorbed power-law to the spectrum extracted from a pre-burst interval, and considered this fit as a fixed component of the spectral model for time intervals during the burst (cf., Worpel et al. 2013; our statistics are insufficient to determine whether this assumption is correct, and moderate changes should not affect our conclusions). We fit an absorbed blackbody model (BBODYRAD) to the burst emission, finding decent fits for all intervals, and show the spectral evolution in Fig. 6. We find clear evidence of cooling (between 770 - 790 s in Fig. 6), while the inferred radius remains essentially constant. This is a clear signature of a thermonuclear burst, and thus of a NS.
We estimated the timescale of this burst using two methods. We fit an exponential model (count rate ) to the light curve of the burst after the peak, estimating the timescale s. Following Galloway et al. (2008), we estimated an alternative timescale for thermonuclear bursts , where is the total fluence during the burst and is flux at the peak, finding s. Galloway et al. (2008) divide bursts into those with longer than 10 s, and those with shorter than 10 s. The longer bursts are generally powered by hydrogen burning (with the exception of “giant” bursts involving photospheric radius expansion, which was not seen here), and the short bursts involve only helium burning, since hydrogen burning proceeds more slowly than helium burning (Fujimoto et al., 1981; van Paradijs et al., 1988; Cornelisse et al., 2003). Our measured burst timescale indicates that hydrogen is being accreted, and thus that the donor star is hydrogen-rich, which requires an orbital period 1.5 hr (e.g., Nelson et al. 1986) and excludes a WD donor.
3.3.4 Quiescent behaviour
We used 7 Chandra/ACIS observations taken when all sources were quiescent (Table 1) to study the behaviour of Terzan 5 X-3 in quiescence before its outburst. We extracted source and background spectra from each observation using CIAO dmextract. We used a combination of a power-law (PEGPWRLW) model and a hydrogen atmosphere for a NS (NSATMOS), with absorption (PHABS) set to our preferred cluster value, the NS radius to 10 km, mass to 1.4 , and distance set to 5.9 kpc. This model has been previously used to fit its spectrum in one quiescent observation (Heinke et al., 2006b). To study possible spectral variations, we simultaneously fit spectra from each observation in four different Trials, each with different parameters free (Table 3) : I) constraining the NSATMOS and PEGPWRLW components to have the same values between all observations; II) letting only the power-law normalization vary between observations, while constraining the NSATMOS temperature to be the same; III) letting only the NSATMOS temperature vary between observations, while constraining the power-law normalization to be the same; IV) letting both the power-law normalization and the NSATMOS temperature vary between observations. We found no evidence for variation in the power-law photon index between observations if we allowed it to vary. Therefore, we tied its value between observations in each Trial (Fig. 7).
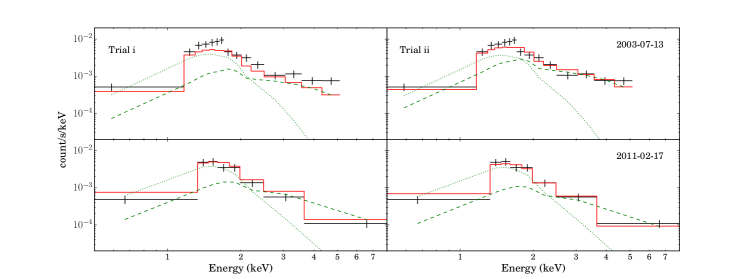
Trial I gives a poor fit, with =116.3 for 76 D.O.F. An F-test confirms the improvement from allowing the power-law flux to vary (Trial I to II), giving an F-statistic of 6.0 and probability of of obtaining such an improvement by chance. Alternatively, allowing the NS temperature to vary (Trial III) also gives an improvement compared to Trial I (F-statistic of 4.2, chance improvement probability of ). Letting both components vary is a substantial improvement compared to allowing the NS temperature alone to vary (comparing III to IV, F-statistic=2.27, chance improvement probability of ), while letting both components vary is not preferred over allowing the power-law component alone to vary (comparing II to IV, F-statistic=0.89, chance improvement probability 0.50). Thus, we identify clear variation in the non-thermal component, but no evidence for variation in the thermal component.
| log T | (0.5-10 keV) | (0.5-10 keV) | (0.5-10 keV) | ||||
|---|---|---|---|---|---|---|---|
| Trial | ObsID | (K) | (10-13 erg cm-2 s-1) | (10-13 erg cm-2 s-1) | (1033 erg s-1) | /D.O.F(nhp) | |
| I | all | 6.143 | 2.4 | 1.9 | 1.1 | 1.4 | 1.53/76(0.002) |
| II | 03798 | 6.138 | 2.4 | 2.1 | 1.9 | 1.8 | 1.09/70(0.27) |
| 10059 | t | t | t | 1.3 | 1.5 | t | |
| 13225 | t | t | t | 0.8 | 1.3 | t | |
| 13252 | t | t | t | 1.2 | 1.5 | t | |
| 13705 | t | t | t | 0.7 | 1.3 | t | |
| 14339 | t | t | t | 0.8 | 1.3 | t | |
| 13706 | t | t | t | 1.4 | 1.6 | t | |
| III | 03798 | 6.172 | 3.3 | 1.9 | 1.0 | 1.8 | 1.22/70(0.099) |
| 10059 | 6.149 | 2.7 | t | t | 1.5 | t | |
| 13225 | 6.120 | 1.9 | t | t | 1.2 | t | |
| 13252 | 6.144 | 2.4 | t | t | 1.4 | t | |
| 13705 | 6.115 | 1.9 | t | t | 1.2 | t | |
| 14339 | 6.131 | 2.2 | t | t | 1.3 | t | |
| 13706 | 6.155 | 2.7 | t | t | 1.5 | t | |
| IV | 03798 | 6.161 | 3.0 | 1.7 | 1.5 | 1.9 | 1.10/64(0.27) |
| 10059 | 6.148 | 2.7 | t | 1.1 | 1.6 | t | |
| 13225 | 6.134 | 2.2 | t | 0.7 | 1.2 | t | |
| 13252 | 6.146 | 2.7 | t | 1.0 | 1.5 | t | |
| 13705 | 6.121 | 1.7 | t | 1.3 | 1.2 | t | |
| 14339 | 6.142 | 2.4 | t | 0.7 | 1.3 | t | |
| 13706 | 6.154 | 2.7 | t | 1.1 | 1.6 | t |
3.3.5 Rise of the outburst
We fit the Swift/XRT spectra from the rise of the outburst with a two-component model including a thermal component (BBODYRAD in XSPEC) and a non-thermal component (PEGPWRLW in XSPEC). We found good fits permitting only the relative normalizations of the thermal and non-thermal components to vary, with a photon index tied between observations (=1.1) and a blackbody radius tied between observations (R=4.3 km). When the power-law index is left free between observations, the values are consistent, though they are poorly constrained in several spectra. Comparing our two-component model fits (Table 4) to our power-law fits (Table 2), a clear improvement in the fit is seen. Simultaneous fits to the first five Swift/XRT spectra of the outburst (listed in Table 4) with an absorbed power-law (with the photon index free between observations) give a reduced of 1.32 for 45 degrees of freedom, while fits with an absorbed power-law plus blackbody give a reduced of 1.09 for 43 degrees of freedom. An F-test gives an F-statistic of 5.55 and chance improvement probability of 0.007, supporting the addition of the thermal component. Protassov et al. (2002) showed that the F-test is often inaccurate for testing the necessity of adding an additional spectral component. We therefore chose the spectrum with the clearest evidence of a thermal component (ObsID 32148004), which shows a of 6.1 between the power-law and power-law plus thermal spectral fits (going from 12 degrees of freedom to 11). We simulated 1000 data sets using a best-fit absorbed power-law model, and fit them both with a power-law model and with a power-law plus thermal component model. None of our simulations showed a larger than that produced by our model, allowing us to conclude that the probability of incorrectly concluding that a thermal component is required is less than 99.5%.
This indicates that the hardening during the outburst rise is likely caused by the decreasing relative contribution of a thermal component. With increasing time, and thus with increasing , the fractional contribution of the thermal component decreases, but its kT increases monotonically. In the next section, we suggest that the thermal component is due to low-level accretion onto the surface of the neutron star.
4. Discussion
4.1. Hardening during the outburst rise
We observed clear evidence of hardening of the spectrum during the outburst rise from up to ergs/s. We have evidence that this hardening is due to the relative reduction in strength of a thermal component in the spectrum with increasing brightness. This is the first time that such hardening during the outburst rise has been detected, made possible by our program of Swift/XRT globular cluster monitoring allowing early detection of the outburst below ergs/s. The trend of inferred photon index (for a fit to a power-law model) versus is clear from the data in the rise, and is consistent with the data in the decay (which are not well-sampled below ergs/s); see Fig. 5.
Softening during outburst decays has been seen from other (likely) NS LMXBs, in the range of ergs/s, especially when the soft (2 keV) X-ray energy range is included (Jonker et al., 2003, 2004; Cackett et al., 2011; Fridriksson et al., 2011; Armas Padilla et al., 2011, 2013c). RXTE observations have shown marginal softening during the decay of Aql X-1 down to ergs/s (Maitra & Bailyn, 2004), only in the part of the spectrum below 6 keV. RXTE observations of SAX J1808.4-3658 showed almost no spectral changes from down to ergs/s (Gilfanov et al., 1998). These apparently contrasting observations are consistent if the softening is due to the increasing importance of the thermal component at lower . Evidence in favor of an increasing relative thermal component can also be seen in Swift/XRT spectra of SAX J1808.4-3658 declining from down to ergs/s (Campana et al., 2008). Thus, we interpret the hardening we observe in Terzan 5 X-3’s rise as due primarily to the decreasing importance of a thermal component, rather than to the same physics responsible for the softening of black hole LMXBs during their decay, which show a steepening power-law spectrum (e.g., Plotkin et al., 2013).
Comparing the spectra observed from Terzan 5 X-3 to those of other NS LMXBs, we find a common pattern, that below ergs/s a thermal component is often required. For instance, Armas Padilla et al. (2013b) find, using XMM-Newton spectra, that two LMXBs at ergs/s require a strong thermal component, while this is not critical for another LMXB at ergs/s. Wijnands et al. (2002b), using Chandra find that SAX J1747.0-2853, at ergs/s, does not need a thermal component. Armas Padilla et al. (2013c) measure a thermal component to comprise 20% of the 0.5-10 keV luminosity for a transient at ergs/s (using XMM), with no evidence (from poorer Swift/XRT spectra) for a thermal component above ergs/s. Jonker et al. (2003, 2004) study the return to quiescence of XTE J1709-267, finding a thermal component to comprise % of the flux at ergs/s, increasing to % at ergs/s. All these results suggest that there is a physical transition operating around ergs/s which changes the energy spectra.
| FX,BB (0.5-10 keV) | FX,PL (0.5-10 keV ) | LX,total(0.5-10 keV) | |||||
|---|---|---|---|---|---|---|---|
| Obs. ID | MJD | kT (keV) | (10-12 erg s-1 cm-2) | (10-12 erg s-1 cm-2) | FX,PL/FX,total | (1034 erg s-1) | /D.O.F |
| 91445006 | 56114.8 | 0.310.03 | 52 | 52 | 50 | 4 | 0.53/6 |
| 32148003 | 56115.8 | 0.360.03 | 93 | 134 | 59 | 9 | 0.68/5 |
| 32148004 | 56117 | 0.410.02 | 15 | 176 | 53 | 13 | 1.19/9 |
| 32148005 | 56118.1 | 0.44 | 2010 | 7020 | 78 | 37 | 0.55/6 |
| 32148006 | 56120.7 | 0.670.06 | 11040 | 500 | 82 | 250 | 1.39/19 |
Such a transition can be provided by the declining optical depth of a hot Comptonizing atmosphere, as seen in numerical calculations of NSs accreting at low rates (Deufel et al., 2001; Popham & Sunyaev, 2001). Deufel et al. 2001 show temperature profiles and emergent spectra for NSs illuminated by high-temperature protons, such as are produced by radiatively inefficient accretion flows. in their figs. 4 and 5 they show that the emergent spectrum is a featureless Comptonized spectrum extending to 100 keV above ergs/s, which develops a clear 0.5 keV thermal component at ergs/s, and loses the Comptonized tail by ergs/s. This transition is a strikingly accurate match to our observations of Terzan 5 X-3’s spectral variations, and to other NS transients discussed in the literature. However calculations of Deufel et al. 2001 underpredict the observed hard power-law components seen in many quiescent LMXBs at low ( ergs/s, including Terzan 5 X-3 in quiescence). This may arise from their not including the Comptonizing effects of the overlying accretion flow on the observed spectrum. Popham & Sunyaev (2001) compute solutions for a hot boundary layer, which becomes optically thin for accretion luminosities below ergs/s, suggesting that some additional Comptonization can be performed by the accretion flow.
The temperature of the thermal component increases monotonically with the total X-ray luminosity during the rise (Table 4), as expected if the thermal component during the rise is produced by accretion. A correlation of thermal component temperature with total luminosity has been suggested from comparisons of multiple sources (Armas Padilla et al., 2013c), but this measurement clearly confirms this correlation in a single source. Furthermore, heating of the NS crust by accretion during the outburst will give rise to a rapidly decaying surface temperature at the end of the outburst (e.g., Cackett et al., 2006a). This effect of an accretion-heated crust could be confused with changing thermal emission from low-level accretion onto the NS surface during the outburst decline, but is not an issue during the outburst rise.
4.2. Nature of donors in globular cluster X-ray binaries
The detection of a thermonuclear burst during this outburst showed that the accreting object is a NS. Furthermore, the timescale of this thermonuclear burst indicates that the accreted matter contains hydrogen, evidence that the donor is not a white dwarf. With this information, we are now capable of classifying 15 of the 18 known bright Galactic globular cluster LMXBs as either ultracompact ( 1 hour, accreting from a hydrogen-deficient and/or degenerate donor) or not ultracompact (accreting from a nondegenerate, H-rich star). Five are known to be ultracompact by direct detection of their orbital periods, and seven systems are known not to be ultracompact by direct measurement of their orbital periods. On the basis of X-ray burst behaviour indicative of hydrogen burning (Galloway et al., 2008), another three systems can be identified as not ultracompact (Table 5). (4U 1722-30, in Terzan 2, has shown some evidence, by its persistent low-luminosity accretion and burst behaviour, in favor of an ultracompact nature; in’t Zand et al. 2007.) Thus, the fraction of observed bright globular cluster LMXBs that are ultracompact appears to be between 28-44% (for 5 or 8 of 18). This fraction is believed to be higher than in the rest of the Galaxy (Deutsch et al., 2000), but uncertainties in selection effects mean that we cannot confidently extrapolate the true underlying fraction of ultracompact systems and make clear comparisons to binary population synthesis models (e.g., Ivanova et al., 2008).
4.3. Quiescent counterpart
We have identified the quiescent counterpart to Terzan 5 -X3 with the brightest previously suggested candidate quiescent LMXB in the cluster, CXOGLB J174805.4-244637 (Heinke et al., 2006b). Our spectral analysis reveals evidence for a variable power-law contribution to the quiescent spectrum over timescales of years, but exhibits no evidence for changes to the thermal component. It is fascinating to see clearly here that the quiescent spectral properties appear to lie on a continuum with the outburst properties, with increasing hardening from quiescence, through the early rise, up to the hard state at ergs/s (Fig. 5).
Chandra quiescent X-ray counterpart searches have now been performed for nine transient cluster LMXBs, of which the three with the faintest outbursts have been identified with very faint ( ergs/s) quiescent counterparts (M15 X-3, Heinke et al. 2009; NGC 6440 X-2, Heinke et al. 2010; IGR J17361-4441 in NGC 6388, Pooley et al. 2011b), two have spectrally hard counterparts with ergs/s (EXO 1745-248 in Terzan 5, Wijnands et al. 2005; IGR J18245-2452 in M28, Papitto et al. 2013; Linares et al. 2013), and four have spectrally soft counterparts with ergs/s (SAX J1748.9-2021 in NGC 6440, in’t Zand et al. 2001; X1732-304 in Terzan 1, Cackett et al. 2006b; IGR J17480-2446 in Terzan 5, Degenaar & Wijnands 2011; and Terzan 5 X-3). These identifications support the idea that the faint soft X-ray sources identified as candidate quiescent LMXBs in globular clusters are indeed transient LMXBs, between (relatively bright) outbursts (Heinke et al., 2003c; Wijnands et al., 2013). The brightest of the faint soft X-ray sources should experience relatively high long-term average mass accretion rates, which will cause relatively large amounts of deep crustal heating and keep their cores warm. Such high mass accretion rates suggest frequent outbursts, and thus it is comforting that we have identified the brightest of the faint soft X-ray sources in the clusters NGC 6440, Terzan 5, and Terzan 1 with observed transients. The suggestion that roughly half the quiescent LMXBs in each cluster are easily identifiable in short Chandra observations by showing soft, primarily thermal X-ray spectra and X-ray luminosities between ergs/s (Heinke et al., 2005) continues to seem reasonable, though it remains unproven.
From the quiescent NS thermal bolometric luminosity ( ergs/s, kT=118 eV at the surface) of Terzan 5 X-3, and its outburst properties, we can make some general statements about its outburst history or neutrino cooling properties, assuming that the quiescent thermal flux is due to heat deposited in the core during multiple accretion episodes (Brown et al., 1998). We estimate the total mass transfer rate onto the NS during this outburst by converting the daily MAXI/GSC 4-10 keV flux estimates (in Crab units) into 0.1-12 keV fluxes (assuming a power-law with photon index set by the nearest Swift/XRT observations), converting the daily Swift/BAT flux estimates into 12-50 keV fluxes (using the same power-law photon index as for the MAXI data), adding these together, and assuming a 1.4 , 10 km NS. This gives us a total energy release over the outburst of 9 ergs, and a total mass transfer of 2.4 .
If we assume “standard” modified Urca cooling (Yakovlev & Pethick, 2004; Wijnands et al., 2013), then we can estimate (using the quiescent NS luminosity) a mass transfer rate onto the NS of Ṁ /year (though this value might vary depending on the choice of crustal composition, e.g. whether a thick light-element layer is present; Page et al. 2004). Assuming this outburst is typical, we derive an average interval of 8 years between outbursts. If the average interval between outbursts were much longer than 10 years, then Terzan 5 X-3 would be brighter in quiescence than expected under even the slowest cooling processes. One could attribute its quiescent thermal luminosity to continued accretion, but our analysis of the quiescent observations identifies no evidence for variability in the thermal component, arguing against this explanation. All Terzan 5 X-ray outbursts since 1996 have been identified with their quiescent counterpart with arcsecond precision, except one in 2002 (Wijnands et al., 2002a). The 2002 outburst had an average luminosity of erg s-1, peak erg s-1, and lasted for days (Degenaar & Wijnands, 2012). The 2012 outburst of Terzan 5 X-3 had a similar average luminosity of erg s-1, peak erg s-1, and lasted for 30 days above ergs s-1 (comparable to the RXTE/ASM detection limit for the 2002 outburst). We therefore suggest that the 2002 X-ray outburst is likely to have also been produced by Terzan 5 X-3. This would nicely fit the 8 year recurrence time we inferred above.
| LMXB | globular cluster | State | Porb | nature | notes | references |
|---|---|---|---|---|---|---|
| 4U 1820-30 | NGC 6624 | P | 11 min | U | X | (1) |
| 4U 0513-40 | NGC 1851 | P | 17 min | U | UV | (2) |
| X1850-087 | NGC 6712 | P | 20.6a min | U | UV | (3) |
| M15 X-2 | M 15 | P | 22.6 min | U | UV | (4) |
| NGC 6440 X-2 | NGC 6440 | T | 57.3 min | U | XP | (5) |
| XB 1832-330 | NGC 6652 | P | 2.1 hrs | N | O | (6) |
| 4U 1746-37 | NGC 6441 | P | 5.16 hrs | N | X | (7) |
| SAX J1748.9-2021 | NGC 6440 | T | 8.7 hrs | N | XP | (8) |
| IGR J18245-2452 | M28 | T | 11.0 hrs | N | XP | (9) |
| GRS 1747-312 | Terzan 6 | T | 12.36 hrs | N | X | (10) |
| AC 211 | M 15 | P | 17.1 hrs | N | UV | (11) |
| Terzan 5 X-2 | Terzan 5 | T | 21.27 hrs | N | XP | (12,13) |
| Rapid Burster | Liller 1 | T | ? | N | B | (14) |
| EXO 1745-248 | Terzan 5 | T | ? | N | B | (14) |
| Terzan 5 X-3 | Terzan 5 | T | ? | N | B | (15) |
| XB 1732-304 | Terzan 1 | T | ? | ? | ? | (16) |
| 4U 1722-30 | Terzan 2 | P | ? | U? | B | (17) |
| IGR J17361-4441 | NGC 6388 | T | ? | ? | ? | (18) |
| LMXBs with no observed outbursts | ||||||
| 47 Tuc W37 | 47 Tuc | Q | 3.09 hrs | N | X | (19) |
| 47 Tuc X5 | 47 Tuc | Q | 8.67 hrs | N | X | (20) |
| Cen qLMXB | Cen | Q | ? | N | H | (21) |
References
- Altamirano et al. (2008) Altamirano, D., Casella, P., Patruno, A., Wijnands, R., & van der Klis, M. 2008, ApJ, 674, L45
- Altamirano et al. (2012a) Altamirano, D., Ingram, A., van der Klis, M., et al. 2012a, ApJ, 759, L20
- Altamirano et al. (2010) Altamirano, D., Patruno, A., Markwardt, C. B., & et al. 2010, ApJ, 712, L58
- Altamirano et al. (2012b) Altamirano, D., Wijnands, R., Heinke, C. O., Sivakoff, G. R., & Pooley, D. 2012b, The Astronomer’s Telegram, 4264, 1
- Altamirano et al. (2012c) Altamirano, D., Keek, L., Cumming, A., et al. 2012c, MNRAS, 426, 927
- Anders & Grevesse (1989) Anders, E., & Grevesse, N. 1989, Geochim. Cosmochim. Acta, 53, 197
- Armas Padilla et al. (2011) Armas Padilla, M., Degenaar, N., Patruno, A., et al. 2011, MNRAS, 417, 659
- Armas Padilla et al. (2013a) Armas Padilla, M., Degenaar, N., Russell, D. M., & Wijnands, R. 2013a, MNRAS, 428, 3083
- Armas Padilla et al. (2013b) Armas Padilla, M., Degenaar, N., & Wijnands, R. 2013b, ArXiv e-prints, arXiv:1303.6640
- Armas Padilla et al. (2013c) Armas Padilla, M., Wijnands, R., & Degenaar, N. 2013c, MNRAS, submitted, arXiv:1307.6009
- Arnaud (1996) Arnaud, K. A. 1996, in ASP Conf. Ser. 101: Astronomical Data Analysis Software and Systems V, 17
- Bahramian et al. (2013) Bahramian, A., Heinke, C. O., Sivakoff, G. R., & Gladstone, J. C. 2013, ApJ, 766, 136
- Bałucińska-Church et al. (2004) Bałucińska-Church, M., Church, M. J., & Smale, A. P. 2004, MNRAS, 347, 334
- Barthelmy et al. (2005) Barthelmy, S. D., Barbier, L. M., Cummings, J. R., et al. 2005, Space Sci. Rev., 120, 143
- Blackburn (1995) Blackburn, J. K. 1995, in Astronomical Society of the Pacific Conference Series, Vol. 77, Astronomical Data Analysis Software and Systems IV, ed. R. A. Shaw, H. E. Payne, & J. J. E. Hayes, 367
- Bordas et al. (2010) Bordas, P., Kuulkers, E., Alfonso-Garzón, J., et al. 2010, The Astronomer’s Telegram, 2919, 1
- Bozzo et al. (2011) Bozzo, E., Ferrigno, C., Stevens, J., et al. 2011, A&A, 535, L1
- Brown et al. (1998) Brown, E. F., Bildsten, L., & Rutledge, R. E. 1998, ApJ, 504, L95
- Burrows et al. (2005) Burrows, D. N., Hill, J. E., Nousek, J. A., et al. 2005, Space Sci. Rev., 120, 165
- Cackett et al. (2010) Cackett, E. M., Brown, E. F., Miller, J. M., & Wijnands, R. 2010, ApJ, 720, 1325
- Cackett et al. (2011) Cackett, E. M., Fridriksson, J. K., Homan, J., Miller, J. M., & Wijnands, R. 2011, MNRAS, 414, 3006
- Cackett et al. (2006a) Cackett, E. M., Wijnands, R., Linares, M., et al. 2006a, MNRAS, 372, 479
- Cackett et al. (2006b) Cackett, E. M., Wijnands, R., Heinke, C. O., et al. 2006b, MNRAS, 369, 407
- Campana et al. (1998) Campana, S., Colpi, M., Mereghetti, S., Stella, L., & Tavani, M. 1998, A&A Rev., 8, 279
- Campana et al. (2004) Campana, S., Israel, G. L., Stella, L., Gastaldello, F., & Mereghetti, S. 2004, ApJ, 601, 474
- Campana et al. (2008) Campana, S., Stella, L., & Kennea, J. A. 2008, ApJ, 684, L99
- Cavecchi et al. (2011) Cavecchi, Y., Patruno, A., Haskell, B., et al. 2011, ApJ, 740, L8
- Chakraborty et al. (2011) Chakraborty, M., Bhattacharyya, S., & Mukherjee, A. 2011, MNRAS, 418, 490
- Corbel et al. (2008) Corbel, S., Koerding, E., & Kaaret, P. 2008, MNRAS, 389, 1697
- Corbel et al. (2006) Corbel, S., Tomsick, J. A., & Kaaret, P. 2006, ApJ, 636, 971
- Cornelisse et al. (2003) Cornelisse, R., in’t Zand, J. J. M., Verbunt, F., et al. 2003, A&A, 405, 1033
- D’Antona et al. (2010) D’Antona, F., Ventura, P., Caloi, V., et al. 2010, ApJ, 715, L63
- Degenaar et al. (2011) Degenaar, N., Brown, E. F., & Wijnands, R. 2011, MNRAS, 418, L152
- Degenaar & Wijnands (2011) Degenaar, N., & Wijnands, R. 2011, MNRAS, 412, L68
- Degenaar & Wijnands (2012) —. 2012, MNRAS, 422, 581
- Degenaar et al. (2013a) Degenaar, N., Wijnands, R., & Miller, J. M. 2013a, ApJ, 767, L31
- Degenaar et al. (2013b) Degenaar, N., Wijnands, R., Brown, E. F., et al. 2013b, ArXiv e-prints, arXiv:1306.2345
- Deufel et al. (2001) Deufel, B., Dullemond, C. P., & Spruit, H. C. 2001, A&A, 377, 955
- Deutsch et al. (2000) Deutsch, E. W., Margon, B., & Anderson, S. F. 2000, ApJ, 530, L21
- Dieball et al. (2005) Dieball, A., Knigge, C., Zurek, D. R., et al. 2005, ApJ, 634, L105
- Done et al. (2007) Done, C., Gierliński, M., & Kubota, A. 2007, A&A Rev., 15, 1
- Engel et al. (2012) Engel, M. C., Heinke, C. O., Sivakoff, G. R., Elshamouty, K. G., & Edmonds, P. D. 2012, ApJ, 747, 119
- Esin et al. (1997) Esin, A. A., McClintock, J. E., & Narayan, R. 1997, ApJ, 489, 865
- Fender et al. (2004) Fender, R. P., Belloni, T. M., & Gallo, E., 2004, MNRAS, 355, 1105
- Ferraro et al. (2009) Ferraro, F. R., Dalessandro, E., Mucciarelli, A., et al. 2009, Nature, 462, 483
- Fridriksson et al. (2011) Fridriksson, J. K., Homan, J., Wijnands, R., et al. 2011, ApJ, 736, 162
- Fruscione et al. (2006) Fruscione, A., McDowell, J. C., Allen, G. E., et al. 2006, in Society of Photo-Optical Instrumentation Engineers (SPIE) Conference Series, Vol. 6270, Society of Photo-Optical Instrumentation Engineers (SPIE) Conference Series
- Fujimoto et al. (1981) Fujimoto, M. Y., Hanawa, T., & Miyaji, S. 1981, ApJ, 247, 267
- Galloway et al. (2008) Galloway, D. K., Muno, M. P., Hartman, J. M., Psaltis, D., & Chakrabarty, D. 2008, ApJ Supp, 179, 360
- Gardner & Done (2012) Gardner, E., & Done, C. 2012, ArXiv e-prints, arXiv:1207.6984
- Gierliński & Done (2002) Gierliński, M., & Done, C. 2002, MNRAS, 337, 1373
- Gilfanov et al. (2003) Gilfanov, M., Revnivtsev, M., & Molkov, S. 2003, A&A, 410, 217
- Gilfanov et al. (1998) Gilfanov, M., Revnivtsev, M., Sunyaev, R., & Churazov, E. 1998, A&A, 338, L83
- Gladstone et al. (2007) Gladstone, J., Done, C., & Gierliński, M. 2007, MNRAS, 378, 13
- Guainazzi et al. (1999) Guainazzi, M., Parmar, A. N., & Oosterbroek, T. 1999, A&A, 349, 819
- Güver & Özel (2009) Güver, T., & Özel, F. 2009, MNRAS, 400, 2050
- Haggard et al. (2004) Haggard, D., Cool, A. M., Anderson, J., et al. 2004, ApJ, 613, 512
- Harris (1996) Harris, W. E. 1996, AJ, 112, 1487
- Hasinger & van der Klis (1989) Hasinger, G., & van der Klis, M. 1989, A&A, 225, 79
- Heinke et al. (2010) Heinke, C. O., Altamirano, D., Cohn, H. N., & et al. 2010, ApJ, 714, 894
- Heinke et al. (2009) Heinke, C. O., Cohn, H. N., & Lugger, P. M. 2009, ApJ, 692, 584
- Heinke et al. (2003a) Heinke, C. O., Edmonds, P. D., Grindlay, J. E., et al. 2003a, ApJ, 590, 809
- Heinke et al. (2005) Heinke, C. O., Grindlay, J. E., & Edmonds, P. D. 2005, ApJ, 622, 556
- Heinke et al. (2003b) Heinke, C. O., Grindlay, J. E., Lloyd, D. A., & Edmonds, P. D. 2003b, ApJ, 588, 452
- Heinke et al. (2003c) Heinke, C. O., Grindlay, J. E., Lugger, P. M., et al. 2003c, ApJ, 598, 501
- Heinke et al. (2006a) Heinke, C. O., Rybicki, G. B., Narayan, R., & Grindlay, J. E. 2006a, ApJ, 644, 1090
- Heinke et al. (2012) Heinke, C. O., Wijnands, R., Altamirano, D., Pooley, D., & Sivakoff, G. R. 2012, The Astronomer’s Telegram, 4249, 1
- Heinke et al. (2006b) Heinke, C. O., Wijnands, R., Cohn, H. N., et al. 2006b, ApJ, 651, 1098
- Hessels et al. (2006) Hessels, J. W. T., Ransom, S. M., Stairs, I. H., et al. 2006, Science, 311, 1901
- Homan & Pooley (2012) Homan, J., & Pooley, D. 2012, The Astronomer’s Telegram, 4302, 1
- Homer et al. (1996) Homer, L., Charles, P. A., Naylor, T., et al. 1996, MNRAS, 282, L37
- Ilovaisky et al. (1993) Ilovaisky, S. A., Auriere, M., Koch-Miramond, L., et al. 1993, A&A, 270, 139
- in’t Zand et al. (2005) in’t Zand, J. J. M., Cumming, A., van der Sluys, M. V., Verbunt, F., & Pols, O. R. 2005, A&A, 441, 675
- in’t Zand et al. (2003) in’t Zand, J. J. M., Hulleman, F., Markwardt, C. B., & et al. 2003, A&A, 406, 233
- in’t Zand et al. (2007) in’t Zand, J. J. M., Jonker, P. G., & Markwardt, C. B. 2007, A&A, 465, 953
- in’t Zand et al. (2001) in’t Zand, J. J. M., van Kerkwijk, M. H., Pooley, D., et al. 2001, ApJ, 563, L41
- Ivanova et al. (2008) Ivanova, N., Heinke, C. O., Rasio, F. A., Belczynski, K., & Fregeau, J. M. 2008, MNRAS, 386, 553
- Jonker et al. (2004) Jonker, P. G., Galloway, D. K., McClintock, J. E., et al. 2004, MNRAS, 354, 666
- Jonker et al. (2003) Jonker, P. G., Méndez, M., Nelemans, G., Wijnands, R., & van der Klis, M. 2003, MNRAS, 341, 823
- Krimm et al. (2013) Krimm, H. A., Holland, S. T., Corbet, R. H. D., et al. 2013, ApJ Supp, 209, 14
- Lanzoni et al. (2010) Lanzoni, B., Ferraro, F. R., Dalessandro, E., et al. 2010, ApJ, 717, 653
- Lasota (2001) Lasota, J.-P. 2001, New A Rev., 45, 449
- Lewin et al. (1993) Lewin, W. H. G., van Paradijs, J., & Taam, R. E. 1993, Space Sci. Rev., 62, 223
- Lin et al. (2007) Lin, D., Remillard, R. A., & Homan, J. 2007, ApJ, 667, 1073
- Linares et al. (2012) Linares, M., Altamirano, D., Chakrabarty, D., Cumming, A., & Keek, L. 2012, ApJ, 748, 82
- Linares et al. (2011) Linares, M., Chakrabarty, D., & van der Klis, M. 2011, ApJ, 733, L17
- Linares et al. (2013) Linares, M., et al. 2013, MNRAS, in prep.
- Maitra & Bailyn (2004) Maitra, D., & Bailyn, C. D. 2004, ApJ, 608, 444
- Makishima et al. (1981) Makishima, K., Ohashi, T., Inoue, H., & et al. 1981, ApJ, 247, L23
- Massari et al. (2012) Massari, D., Mucciarelli, A., Dalessandro, E., et al. 2012, ApJ, 755, L32
- Matsuoka et al. (2009) Matsuoka, M., Kawasaki, K., Ueno, S., & et al. 2009, PASJ, 61, 999
- Mihara et al. (2011) Mihara, T., Nakajima, M., Sugizaki, M., et al. 2011, PASJ, 63, 623
- Miller et al. (2009) Miller, J. M., Cackett, E. M., & Reis, R. C. 2009, ApJ, 707, L77
- Miller et al. (2011) Miller, J. M., Maitra, D., Cackett, E. M., Bhattacharyya, S., & Strohmayer, T. E. 2011, ApJ, 731, L7
- Motta et al. (2011) Motta, S., D’Aı, A., Papitto, A., et al. 2011, MNRAS, 414, 1508
- Nelson et al. (1986) Nelson, L. A., Rappaport, S. A., & Joss, P. C. 1986, ApJ, 304, 231
- Page et al. (2004) Page, D., Lattimer, J. M., Prakash, M., & Steiner, A. W. 2004, ApJ Supp, 155, 623
- Papitto et al. (2011) Papitto, A., D’Aì, A., Motta, S., et al. 2011, A&A, 526, L3
- Papitto et al. (2012) Papitto, A., Di Salvo, T., Burderi, L., et al. 2012, MNRAS, 423, 1178
- Papitto et al. (2013) Papitto, A., Ferrigno, C., Bozzo, E., et al. 2013, Nature, submitted, arXiv:1305.3884
- Patruno et al. (2012) Patruno, A., Bult, P., Gopakumar, A., et al. 2012, ApJ, 746, L27
- Peng et al. (2007) Peng, F., Brown, E. F., & Truran, J. W. 2007, ApJ, 654, 1022
- Plotkin et al. (2013) Plotkin, R. M., Gallo, E., & Jonker, P. G. 2013, ArXiv e-prints, arXiv:1306.1570
- Pooley et al. (2011a) Pooley, D., Homan, J., Altamirano, D., et al. 2011a, The Astronomer’s Telegram, 3743, 1
- Pooley et al. (2010) Pooley, D., Homan, J., Heinke, C., et al. 2010, The Astronomer’s Telegram, 2974, 1
- Pooley et al. (2011b) Pooley, D., Homan, J., Heinke, C. O., et al. 2011b, The Astronomer’s Telegram, 3627, 1
- Popham & Sunyaev (2001) Popham, R., & Sunyaev, R. 2001, ApJ, 547, 355
- Protassov et al. (2002) Protassov, R., van Dyk, D. A, Connors, A., Kashyap, V. L., & Siemiginowska, A. 2002, ApJ, 571, 545
- Pszota et al. (2008) Pszota, G., Zhang, H., Yuan, F., & Cui, W. 2008, MNRAS, 389, 423
- Rajagopal & Romani (1996) Rajagopal, M., & Romani, R. W. 1996, ApJ, 461, 327
- Ransom et al. (2005) Ransom, S. M., Hessels, J. W. T., Stairs, I. H., et al. 2005, Science, 307, 892
- Remillard & McClintock (2006) Remillard, R. A., & McClintock, J. E. 2006, ARAA, 44, 49
- Riggio et al. (2012) Riggio, A., Burderi, L., Di Salvo, T., et al. 2012, ApJ, 754, L11
- Romano et al. (2006) Romano, P., Campana, S., Chincarini, G., et al. 2006, A&A, 456, 917
- Rutledge et al. (2002) Rutledge, R. E., Bildsten, L., Brown, E. F., Pavlov, G. G., & Zavlin, V. E. 2002, ApJ, 577, 346
- Serino et al. (2012) Serino, M., Mihara, T., Matsuoka, M., et al. 2012, PASJ, 64, 91
- Sivakoff et al. (2007) Sivakoff, G. R., Jordán, A., Sarazin, C. L., et al. 2007, ApJ, 660, 1246
- Stella et al. (1987) Stella, L., Priedhorsky, W., & White, N. E. 1987, ApJ, 312, L17
- Strohmayer & Markwardt (2010) Strohmayer, T. E., & Markwardt, C. B. 2010, The Astronomer’s Telegram, 2929, 1
- Strohmayer et al. (2010) Strohmayer, T. E., Markwardt, C. B., Pereira, D., & Smith, E. A. 2010, The Astronomer’s Telegram, 2946, 1
- Testa et al. (2012) Testa, V., di Salvo, T., D’Antona, F., et al. 2012, A&A, 547, A28
- Titarchuk (1994) Titarchuk, L. 1994, ApJ, 434, 570
- Valenti et al. (2007) Valenti, E., Ferraro, F. R., & Origlia, L. 2007, AJ, 133, 1287
- van Paradijs et al. (1988) van Paradijs, J., Penninx, W., & Lewin, W. H. G. 1988, MNRAS, 233, 437
- Verbunt et al. (1995) Verbunt, F., Bunk, W., Hasinger, G., & Johnston, H. M. 1995, A&A, 300, 732
- Verbunt & Hut (1987) Verbunt, F., & Hut, P. 1987, in IAU Symp. 125: The Origin and Evolution of Neutron Stars, 187
- Warwick et al. (1988) Warwick, R. S., Norton, A. J., Turner, M. J. L., Watson, M. G., & Willingale, R. 1988, MNRAS, 232, 551
- White & Angelini (2001) White, N. E., & Angelini, L. 2001, ApJ, 561, L101
- Wijnands et al. (2012) Wijnands, R., Altamirano, D., Heinke, C. O., Sivakoff, G. R., & Pooley, D. 2012, The Astronomer’s Telegram, 4242, 1
- Wijnands et al. (2013) Wijnands, R., Degenaar, N., & Page, D. 2013, MNRAS, 432, 2366
- Wijnands et al. (2005) Wijnands, R., Heinke, C. O., Pooley, D., et al. 2005, ApJ, 618, 883
- Wijnands et al. (2002a) Wijnands, R., Homan, J., & Remillard, R. 2002a, The Astronomer’s Telegram, 101, 1
- Wijnands et al. (2002b) Wijnands, R., Miller, J. M., & Wang, Q. D. 2002b, ApJ, 579, 422
- Wilms et al. (2000) Wilms, J., Allen, A., & McCray, R. 2000, ApJ, 542, 914
- Worpel et al. (2013) Worpel, H., Galloway, D. K., & Price, D. J. 2013, ArXiv e-prints, arXiv:1303.4824
- Yakovlev & Pethick (2004) Yakovlev, D. G., & Pethick, C. J. 2004, ARAA, 42, 169
- Yuan & Cui (2005) Yuan, F., & Cui, W. 2005, ApJ, 629, 408
- Zampieri et al. (1995) Zampieri, L., Turolla, R., Zane, S., & Treves, A. 1995, ApJ, 439, 849
- Zavlin et al. (1996) Zavlin, V. E., Pavlov, G. G., & Shibanov, Y. A. 1996, A&A, 315, 141
- Zurek et al. (2009) Zurek, D. R., Knigge, C., Maccarone, T. J., Dieball, A., & Long, K. S. 2009, ApJ, 699, 1113