Nature of H selected galaxies at . II. clumpy galaxies and compact star-forming galaxies
Abstract
We present the morphological properties of 109 H-selected galaxies at in SXDF-UDS-CANDELS field. With high-resolution optical/near-infrared images obtained by , we identify giant clumps within the H emitters (HAEs). We find that at least 41% of our sample show clumpy structures in the underlying disks. The color gradient of clumps is commonly seen in the sense that the clumps near the galactic center tend to be redder than those in the outer regions. The mid-infrared detection in galaxies with red clumps and the spatial distribution of H emission suggest that dusty star-formation activity is probably occurring in the nuclear red clumps. A gas supply to a bulge component through the clump migration is one of the most potent physical processes to produce such dusty star-forming clumps and form massive bulges in local early-type galaxies. They would become large quiescent galaxies at later times just by consumption or blowout of remaining gas. Also, while most of the HAEs have extended disks, we observe two massive, compact HAEs, whose stellar surface densities are significantly higher. They are likely to be the direct progenitors of massive, compact quiescent galaxies at –2.0. Two evolutionary paths to massive quiescent galaxies are devised to account for both the size growth of quiescent galaxies and their increased number density from to .
Subject headings:
galaxies: evolution – galaxies: high-redshift1. Introduction
By the recent advances on the multi-wavelength observing techniques, intensive quantitative studies have been conducted on global properties of high-redshift galaxies, such as stellar mass, SFR, age and metallicity of stellar populations. An important next step is to spatially resolve their properties and identify the physical processes that govern the galaxy formation and evolution. However, it is difficult to dissect distant galaxies with ground-based telescopes as the spatial resolution of 1″ corresponds to 8 kpc in the physical scale at . The high-resolution imaging with (HST) allows us to study the evolution of galaxy morphologies in the distant universe. The Advanced Camera for Surveys (ACS) on HST has demonstrated that star-forming galaxies at tend to have irregular, clumpy morphologies unlike the present-day galaxies on the Hubble sequence (e.g., Elmegreen & Elmegreen, 2005; Lotz et al., 2006; Law et al., 2007). However, the optical camera ACS can sample only the rest-frame ultraviolet (UV) lights from high-redshift galaxies, and its images pick out only star-forming regions within galaxies rather than the bulk structures of galaxies traced by stellar mass. With the advent of Near Infrared Camera and Multi-Object Spectrometer (NICMOS) and Wide Field Camera 3 (WFC3), it has become possible to measure the rest-frame optical morphologies for statistical samples of galaxies at . Surprisingly, clumpy structures are often seen in both rest-frame UV and optical wavelengths, especially for massive star-forming galaxies (e.g., Elmegreen et al., 2009; Förster Schreiber et al., 2011a; Wuyts et al., 2012). Clumps are characterized typically by a large size of 1 kpc and a large stellar mass of for luminous star-forming galaxies with log (Förster Schreiber et al., 2011b). Although such clumpy structures are first interpreted as the outcome of a major merger (Conselice et al., 2003), recent dynamical studies of high-redshift galaxies suggest an alternative origin.
Spectroscopies with an AO-assisted integral field unit (IFU) on 8–10m class telescopes have enabled us to study in detail the internal kinematics of star-forming galaxies at as well as the spatial structures (e.g., Genzel et al., 2006; Law et al., 2009; Swinbank et al., 2012). To date, the largest survey with near-infrared IFU spectroscopy for galaxies at is the work by Förster Schreiber et al. (2009). They have obtained the H spectra of 50 star-forming galaxies at , selected in the rest-frame UV, optical, near-infrared and submillimeter, with SINFONI on the VLT. Although their morphologies in the H line emission are generally irregular or clumpy like their appearances in the rest-frame UV/optical continua images, their kinematics of ionized gas show ordinary disks with symmetric rotation of km s-1. Many of them also exhibit a large local velocity dispersion of km s-1, suggesting that the gas disks commonly have random motions. About one third of their H IFU sample are classified as rotation-dominated galaxies with . Roughly another third are categorized into dispersion-dominated galaxies. These kinematical classifications strongly correlate with their intrinsic sizes in the sense that smaller galaxies are more likely dispersion-dominated (Newman et al., 2013). Although a lot of clumpy star-forming galaxies have been observed at high redshift, interacting or merging systems inferred from dynamical signatures are only about one third (Förster Schreiber et al., 2011b). However, we should be cautious of the face value because it is strongly biased by the sample selection of the IFU observations, which tend to pick up a bright H emission. Since a merger system is likely to be associated with a bright H line emission, the intrinsic merger fraction can be smaller than that.
While is the epoch when cosmic star-formation activities in galaxies come to a peak (Hopkins & Beacom, 2006), some massive quiescent galaxies already exist at the same epoch (e.g., Kriek et al., 2006, 2009). It is remarkable that these quiescent galaxies are extremely compact with an effective radius of only 1 kpc (e.g., Trujillo et al., 2006; Toft et al., 2007; van Dokkum et al., 2008). This is about a factor of four to five smaller than the size of local giant ellipticals at the fixed stellar mass. In the local Universe, such compact, red sequence galaxies are extremely rare (Taylor et al., 2010). These compact quiescent galaxies must have evolved significantly in size after much faster than in mass, hence by mechanisms other than simple star formation. The most widely accepted scenario at the moment is the inside-out growth through repeated minor mergers and accretion of small satellites (e.g., Naab et al., 2009; Oogi & Habe, 2013). Dissipationless minor mergers are more effective to enlarge the compact galaxies in size by putting mass efficiently to the outer region of galaxies. In contrast, major mergers lead to growth both in size and mass proportionally, and are not supported by the local relation between and (Bezanson et al., 2009). van Dokkum et al. (2010) have investigated the redshift evolution of mass profiles based on the samples selected at the constant number density in co-moving space so that the direct comparison can be made. They have shown that the mass within the radius of 5 kpc stays nearly constant with redshift, whereas the mass at 5 kpc 75 kpc has increased by a factor of four from to zero. Patel et al. (2013) have improved this study of mass profile evolution with HST images of high spatial resolution, and confirm that there is no substantial growth at in the central part of 2 kpc.
The merger paradigm accounts for both the enhancement of SFR (e.g., increase in starburst galaxies such as SMGs) at high redshift and the transformation of galaxy morphologies. However, the dominant populations responsible for the cosmic stellar mass density and SFR density are found not to be merger-driven starburst galaxies but normal star-forming ( ) galaxies (Rodighiero et al., 2011). An alternative process is required to account for enhancement in SFRs, clumpy structures embedded in ordinary rotational disks, large velocity dispersions and compact sizes. In the past several years, the efficient gas supply through cold streams along filamentary structures is suggested to be a preferred mechanism to account for these properties (clumpy structure and compact system) of high-redshift galaxies (Dekel et al., 2009b). The steady, narrow, cold gas streams penetrate the shock-heated media of massive dark matter halos and continuously supply a large amount of gas to the inner regions of star-forming galaxies. A cosmological simulation implies that there are two types of streams: smooth mode and clumpy mode (Dekel et al., 2009a). In massive halos with at , smooth streams maintain dense gas-rich disks, as observed in CO observations (Tacconi et al., 2010; Daddi et al., 2010). In such a gas-rich disk, a small gas perturbation in the radial direction would grow up and fragment into giant clumps by gravitational instability. Then, the internal gravitational interaction within a perturbed disk generates turbulence and the velocity dispersion becomes progressively larger. In fact, theoretical models provide support for gas-rich turbulent disks having clumps (Bournaud et al., 2007; Bournaud & Elmegreen, 2009). On the other hand, the clumpy components in cold streams lift up the velocity dispersion in disks. The external clumps merge into the central spheroid as a wet major merger and form a compact spheroid that is significantly smaller in size than the disk (Dekel & Cox, 2006). Though no direct observational evidence for cold gas streams has been found yet, these two kinds of gas stream may account for the differences in the properties between high redshift and local galaxies.
Recent large surveys have dramatically improved our understanding of the physical properties of star-forming and quiescent galaxies at . However, not much is yet known about the evolutionary paths from star-forming galaxies to quiescent galaxies. Remaining critical issues include: What fraction of star-forming galaxies is in the clumpy phase? What are their fates? How are they connected to compact or extended quiescent galaxies at later times, and how does that transition happen? To shed light on these issues, what is required is to study galaxy morphologies with a “clean,” “statistical” and “unbiased” sample of star-forming galaxies at this critical era of galaxy formation at and beyond, and then to spatially resolve their internal properties within galaxies such as clumpy structures, extended disks, or compact bulges. Many previous studies had to rely on the sample selection by photometric redshifts. Due to the significantly degraded accuracy of photometric redshifts at , however, we are left with incomplete, biased samples of star-forming galaxies at this epoch.
In this paper, we study the morphologies of H emitters (HAEs) at , which is a robust star-forming galaxy sample selected by narrow-band (NB) imaging. This paper is structured as follows: In Section 2, we note the existing data and our sample in Subaru/– Deep survey Field (SXDF). The analyses to characterize the morphological properties of HAEs and their results are described in Section 3. We show the clump properties within HAEs and newly discovered compact star-forming galaxies at in Section 4. In Section 5, we discuss the evolutionary track from HAEs at to massive, quiescent galaxies in the present Universe. We summarize our study in Section 6. Throughout this paper, we assume the cosmological parameters of H0=70 km s-1 Mpc-1, , and , and Salpeter IMF is adopted for the estimation of stellar masses and SFRs (Salpeter, 1955).
2. Sample and data
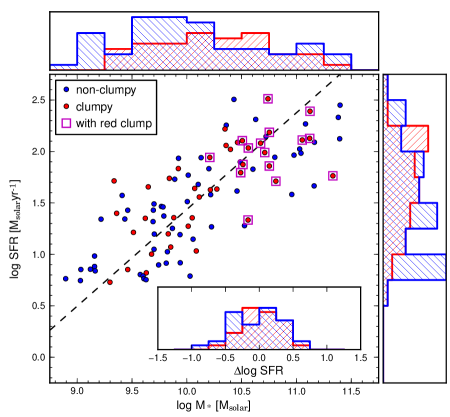
We use data from the “-” project (MApping HAlpha and Lines of Oxygen with Subaru; see an overview by Kodama et al. 2013), This project provides a statistical analysis of H emitting star-forming galaxies over the peak epoch of galaxy formation (), and across various environments from blank fields (Tadaki et al., 2011) to clusters/proto-cluster regions (Koyama et al., 2013; Tanaka et al., 2011; Hayashi et al., 2012). In this paper, we use 63 HAEs at and 46 at in the SXDF-UDS-CANDELS blank field, which have been identified with two NB filters. The observations, sample selection and estimate of physical properties are described in detail in the companion paper (Tadaki et al., in preparation). This is a clean sample of star-forming galaxies, and importantly, much less biased to a certain limit in SFRs. Actually, in our spectroscopic follow-up observations, 12 HAEs out of 13 targets (%) have been confirmed to be located at . Five AGN-dominated objects at are rejected from the sample, based on the [N ii]/H line ratios, IRAC colors (Tadaki et al., in preparation) and/or [C iv] line detections (Simpson et al., 2012). Since most of the other HAEs are located in the on the color-magnitude diagram, they are expected to be star-forming galaxies rather than AGN-dominated objects (Tadaki et al., in preparation). Their stellar masses and amounts of dust extinction are estimated from the spectral energy distributions (SEDs) with 12-band photometries from -band to 4.5 m, which are fitted by the stellar population synthesis model of Bruzual & Charlot (2003). The SFRs are computed from the H luminosities with the standard calibrations of Kennicutt (1998). In Figure 1, we show the SFR versus stellar mass diagram of our HAE sample. The sample includes the galaxies with and SFR=5–400yr-1.
To investigate the morphologies of our HAEs, we make use of the publicly available, high spatial resolution images at four passbands ( and ) of the CANDELS survey (Grogin et al., 2011; Koekemoer et al., 2011). The spatial resolution of all the images is matched to FWHM=0.18″, which is the PSF size of the image. At , this corresponds to 1.5 kpc in the physical scale. The wavelength regime of the ACS- image corresponds to the rest-frame UV at and hence approximately traces internal star-formation activities of galaxies (with some complexity introduced by dust extinction though). The WFC3- image corresponds to the rest-frame optical at and hence approximately traces the stellar mass distribution. As such, the ACS and WFC3 data are both imperative to investigate the morphologies of high redshift star-forming galaxies.
3. Analysis
3.1. Clump identification
Star-forming galaxies are found to become increasingly irregular at higher redshift () with clumpy structures and asymmetry (e.g., Elmegreen & Elmegreen, 2005). Such clumpy nature must be mirroring important physics of the early phase of galaxy formation. To investigate the properties of clumpy galaxies, we first identify clumps in the HAEs by a semi-automatic method using the 2-D version of code (Williams et al., 1994) as employed by Livermore et al. (2012). Clumps are defined in the or images. Note that -band traces the rest-frame UV, dominated by massive stars, and it gives a biased view of the clumps rather than overall stellar populations. We thus use as color of clumps. (section 3.2 and 4.1). Because the ACS images are not available for four HAEs at , we use a total of 100 galaxies. To minimize misidentification, the contour intervals of 3 are adopted. To distinguish clumps from noises, we only accept the clumps that satisfy the following criteria : (1) the size is larger than the PSF (0.18″), and (2) the peak flux density is above the 10 level in map or the 6 level in map. We adopt different criteria for the map and the map to match the visual inspection. The stellar mass of identified clumps roughly corresponds to (Section 3.2).
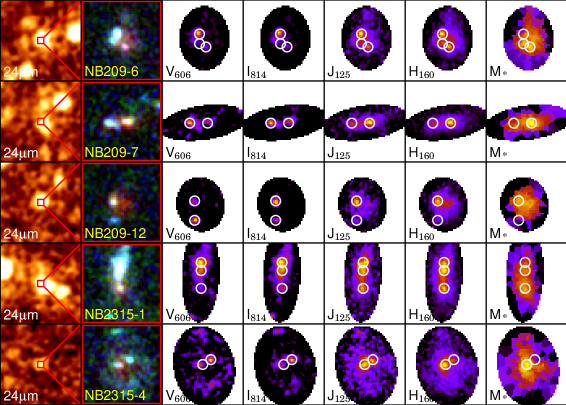
Figure 2 displays some examples of the color images of clumpy galaxies. The identified clumps are marked by black circles. Here, a clumpy galaxy is defined as an object consisting of multi-components, no matter whether a second-component (or a later component) is a clump formed by a gravitational collapse or an external small galaxy. We find that 41 out of 100 HAEs (%) have sub-clumps along with the main-component. Such clumpy galaxies are seen everywhere on and around the main sequence over a wide range in stellar mass, but the fraction of clumpy galaxies peaks in and SFR yr-1 (Figure 1). The fraction of clumpy galaxies noted here is the lower limit because non-clumpy galaxies could consist of a few smaller clumps, which are not resolved in the 0.18″resolution images, especially for less massive galaxies. On the other hand, the fraction seems to decrease in the most massive galaxies with , although clumps, if they exist, could be more easily resolved in those larger galaxies. If clumps are continuously formed by gravitational collapses, their host disks should be gas rich so as to be able to collapse by overcoming a large velocity dispersion and a shear of differential rotation. Given that a gas supply through a cold stream is prevented by a virial shock in a massive halo, our HAEs with would exhaust the bulk of gas and become unable to form new clumps. In fact, the sSFRs of massive HAEs are suppressed compared to other HAEs, suggesting that they may be just quenching their star-formation activities.
Also, we investigate the fraction of clumpy galaxies for the HAEs with as a function of the offset from the main sequence at fixed stellar mass: log(SFR)=log(SFR)-log(SFRMS). The AGN fraction is likely to be small in this mass range (Tadaki et al., in preparation). Here, the main sequence is defined as SFRMS=238( (Tadaki et al., in preparation). However, there is no clear evidence for a difference between clumpy and non-clumpy galaxies on the stellar mass–SFR diagram. To identify any systematic difference in the physical properties between clumpy/non-clumpy galaxies, we would need to investigate other quantities such as the local velocity dispersion. In this paper, we simply conclude that the clumpy signature is common among star-forming galaxies at .
3.2. Distribution of stellar components
To derive the spatial distribution of stellar components within a galaxy with high precision, we take into account the mass-to-light ratio at each position within the galaxy. We therefore first establish a relation between the color and the stellar mass-to-light ratio at band by using the population synthesized bulge-disk composite model of Kodama et al. (1999). We note that the relation between color and mass-to-light ratio does not depend much on the assumed star-formation histories or metallicity or dust extinction because of the age–metallicity–dust-extinction degeneracy (Kodama & Bower, 2003) as far as the IMF is fixed. The stellar mass at each position within galaxies is then calculated from the -band luminosity and the mass-to-light ratio derived from the color. We used the following conversion equations:
| (1) | |||||
| (2) |
where =22.8, and at , and =23.0, and at . The equation (1) exhibits the stellar mass–magnitude relation in the case of passively evolving galaxies at each redshift. The other equation (2) gives the amount of correction in stellar mass as a function of colors, which represents the variation in mass-to-light ratio depending on star-formation history. Because the color measurement is less accurate at the pixels with low surface brightness, we perform an adaptive spatial binning with the Voronoi technique (Cappellari & Copin, 2003) so as to achieve the minimum S/N level of 10 per bin on the -band image.
We present the stellar mass maps of some clumpy HAEs along with the HST images in Figure 2. In the inferred stellar mass distribution, some bright clumps in the -band become less prominent while some other bright clumps in the -band become more prominent. This suggests that the bright clumps seen in the -band are young and star-forming, and thus, do not contribute significantly to the overall mass distributions of the galaxies. Moreover, it should be noted that a diffuse component is now seen in the -band image or the stellar mass distribution just surrounding the geometric center of the galaxy. Whereas these galaxies may simply resemble a merging system in the -band image, the stellar mass is very smoothly distributed, and bridging the distinct components seen in the -band image. In the case of a merging galaxy, we would have to see multi-components in the stellar mass distribution. Such smooth distributions of stellar components in high redshift star-forming galaxies are also supported by the analysis of spatially resolved SEDs (Wuyts et al., 2012).
We cannot clearly tell with the current existing data alone whether this is a clumpy galaxy or a merger system. However, some recent IFU studies have been just resolving such internal kinematical structures in some clumpy star-forming galaxies at , and revealing that they often have disks with coherent rotation (e.g., Genzel et al., 2006; Förster Schreiber et al., 2009). Therefore our sample of clumpy galaxies are also more likely single galaxies with internal large gravitational fragmentations of the gas in the disks at the early phase of galaxy formation fed by abundant gas accretion (Genzel et al., 2011).
3.3. Structural parameters
The high-resolution images by WFC3 enable us to estimate the structural parameters such as size and radial profile in the rest-frame optical for galaxies at . The publicly available catalog by van der Wel et al. (2012) is used to obtain the structural parameters of our HAEs. We give a brief summary of the catalog and their work below. For all the objects detected in the CANDELS fields, the surface brightness distributions in the -band images are fitted with Srsic model (Sersic, 1968) by using the GALFIT version 3.0 code (Peng et al., 2010) and GALAPAGOS (Barden et al., 2012). The free parameters are the position of galaxy center, Srsic index, effective radius, axial ratio, position angle of the major axis, and total magnitude. Initial guesses for these parameters are taken from the SExtractor measurements. Simulations with artificial objects can estimate the systematic uncertainties in the measured parameters by comparing them to the input (true) parameters. In the case of galaxies with , the measurement errors are estimated to be and for 3, and and for 3 (van der Wel et al., 2012). Because most of the faint objects with are less massive galaxies than , we apply the stellar mass cut of in the analysis. However, even the sample of 86 HAEs that satisfy this criterion includes 13 faint objects. We do not use them because the accuracy of the fitting is significantly degraded, especially for bulge-dominated galaxies. We also reject four objects whose fitting results are bad and unreliable (flag value of two in van der Wel et al. 2012 catalog). After all, we have obtained the structural parameters for 69 HAEs with .
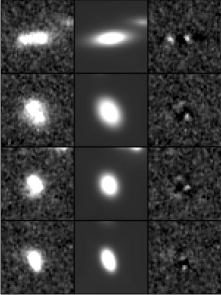
In Figure 3, we show the -band images, model and residual images of four examples of the HAEs. These are all HAEs with star-forming clumps as identified in Section 3.1, but the surface brightness distributions of overall galaxies seem to be suitably fitted by the Srsic model. Therefore, we do not discern between clumpy and non-clumpy galaxies when discussing their size measurements.
Seventy-four percent of them are found to have disk-like morphologies where their Srsic indices lie close to unity (). The median value of for the HAEs is . Other studies have also shown that high-redshift star-forming galaxies tend to have disk-like morphologies with (e.g., Yuma et al., 2012; Targett et al., 2013). The other fourth part of our sample exhibits a high Srsic index of 2 indicative of bulge-dominated morphologies.
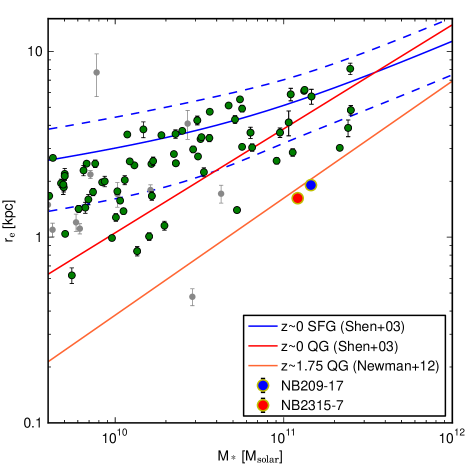
Figure 4 shows the stellar mass–size relation of our HAEs at =2.2 and 2.5, compared to the local relation (Shen et al., 2003). This diagram is a powerful tool to investigate the size evolution of galaxies. We fit the mass-size relation of log = to our HAEs, that gives and . Most of the HAEs with are distributed within the 1 range of the local relation for late-type galaxies although the star-formation activities of our HAEs are significantly higher (SFR=5–400 yr-1) than those of local disk galaxies. This trend is consistent with the universal relation, which does not show a size evolution at a given mass, as reported by Ichikawa et al. (2012) and Stott et al. (2013). On the other hand, less massive HAEs are slightly smaller than the local relation. Even if faint galaxies with –26 (gray points in Figure 4) are included in the sample, such a trend is not changed. Some other processes other than secular processes are needed for these less massive HAEs to evolve into local star-forming/quiescent galaxies. We also find two massive, compact HAEs, and we will discuss these interesting objects in detail in Section 4.2.
4. Result
4.1. Dusty star-forming clump
A lot of HAEs at have kilo-parsec scale clumps as shown in Figure 2. The fate of these clumps is an important issue and a matter of hot debate in relation to the bulge formation of galaxies. In the numerical simulations, clumps formed in rotational disks can migrate toward galaxy centers as a result of their mutual interactions and of dynamical friction against the host disk, and coalesce into central young bulges (Ceverino et al., 2010; Inoue & Saitoh, 2012). This is a very efficient process to carry a large amount of gas from the galactic disks to the bulge components. On the other hand, the momentum-driven galactic winds due to massive stars and supernova can disrupt giant clumps with before they migrate towards galaxy centers (Genel et al., 2012). Genzel et al. (2011) and Newman et al. (2012b) find the empirical evidence for gas outflows originating in massive luminous clumps in disks by deep AO-assisted integral field spectroscopic observations. Whether the scenario for clump-origin bulge formation is viable depends sensitively on the longevity of clumps. If the clumps contain a large amount of gas, they would survive and exhibit an age gradient as a function of distance from galaxy centers. The H equivalent width is relatively insensitive to dust extinction if the line and continuum emissions both originate in the same regions, and is thus the most useful measure of variation in stellar ages. Förster Schreiber et al. (2011b) have measured the equivalent widths of H emission (EWHα) for clumps in one massive galaxy at and find a correlation between EWHα and galactocentric distance. This suggests that the clumps near the galactic center tend to be older than the outer clumps, supporting the clump migration event. All the other previous studies of clumps have relied on the colors of galaxies and SED fitting with multi-wavelength photometries. Wuyts et al. (2012) have performed a detailed analysis of spatially resolved SEDs for a complete sample of star-forming galaxies at . They find the trend of having redder colors, older stellar ages, and stronger dust extinction in the clumps near galactic centers compared to the off-center clumps. Guo et al. (2012) have also shown the same obvious radial gradients in color, age and dust extinction for the clumpy galaxies at –2.0.
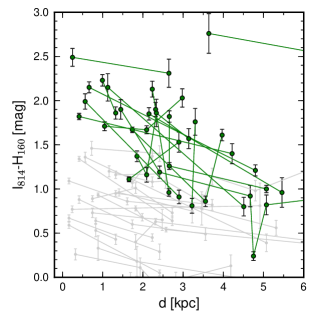
In our sample, there are some clumpy HAEs with red clumps of , which are often seen in the stellar mass range of (Figure 1). We focus on these HAEs with a red clump to investigate the clump properties and test the viability of the clump migration scenario. Figure 5 shows the radial gradient of clump colors across the host galaxies. An aperture magnitude within a diameter of 0.36″(=2PSF size) is used to derive the color of a clump. The stellar mass-weighted center is adopted to define a galactocentric distance. We find that the clumps closer to the centers are redder compared to the off-center clumps in agreement with the previous studies. The nuclear red clump seems to be a proto-bulge component, which would become an old bulge seen in local early-type galaxies.
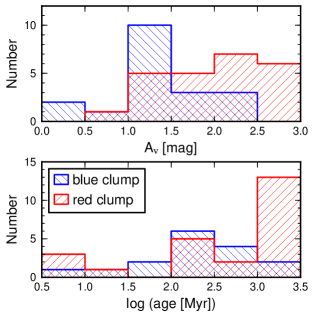
Some HAEs with a red clump are detected in the public MIPS 24-micron image (SpUDS; PI: J. Dunlop). Because the PSF size of the MIPS 24m image is ″, we cannot spatially resolve the infrared emission within galaxies for most of the HAEs, nor resolve the structures from clump to clump. The five HAEs presented in Figure 2 each have a blue clump of as well as a red clump. It is worth stressing that these objects are bright in the infrared emission, which indicates that a dusty starburst is occurring somewhere within them. If the blue clumps contain a large amount of dust, they should appear much redder due to dust extinction. To pin down where the dusty star-forming regions are located within the galaxies, we fit the SEDs of individual clumps with the stellar population synthesis model of (Bruzual & Charlot, 2003) by using hyperz (Bolzonella et al., 2000). Since only four broad-band photometries () are used for the fitting, constant star-formation histories and solar metallicity are assumed to estimate the amount of dust extinction and the luminosity-weighted age of the clumps. In Figure 6, we plot histograms of dust extinction and luminosity-weighted age of the clumps. We divide the clumps into red and blue clumps at . It is clear from the distributions that the red clumps are dustier and older than the blue clumps. The Kolmogorov-Smirnov (K-S) tests suggest that the null hypothesis, that they are drawn from the same distribution, is proven to be false at the significance level of 1.0% both in Av and age. Therefore it is likely that dusty starburst activities are concentrated in the red clumps towards galaxy centers rather than in the blue clumps or in the inter-clump regions.
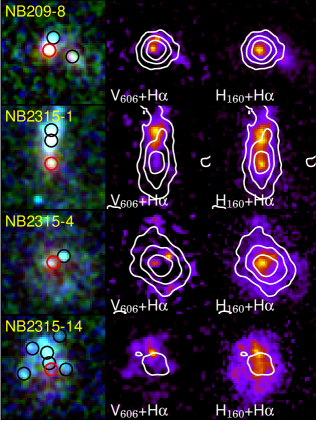
As an alternative approach, the H flux maps are created from the NB (line+continuum) and -band (continuum) images of the clumpy HAEs. Since the H flux extends over entire galaxies in most cases, we cannot identify the internal star-forming regions from which strong H emission is actually radiated. However, there are a few cases where we can resolve clumps even in the seeing limited H images. In Figure 7, we display the HST images of four such clumpy HAEs, which can be spatially resolved in the H maps. If only the rest-frame UV luminosities are used as SFR indicators, the blue clumps would be seen as major contributors of the intense star formation within these galaxies. However, the peak of H distribution is clearly located at or near the red clump rather than at the blue clumps. Although H luminosities are sensitive to massive stars compared to UV, the two SFR indicators provide consistent results for old stellar population systems with age 100 Myr (Wuyts et al., 2013). Since the red clumps are older (Figure 6), the high flux ratios of H to UV is a robust evidence for dusty star formation in the red clumps. H emission line is much less attenuated by dust compared to UV continuum emission, and penetrates through the dusty star-forming regions and comes out. If we can correct for the differential dust extinction among clumps, the intrinsic H line strength in the red clumps would be significantly larger and the star-formation map would become quite different from the UV luminosity map. It should be noted that AGNs at the galactic centers may be contributing to MIPS 24m fluxes and H flux densities. At least for SXDF-NB209-6,7 and 11, however, the line ratios of H/[N ii] indicate that they are more like star-formation dominated galaxies rather than AGN-dominated ones (Tadaki et al., in preparation).
Our results suggest that some HAEs at have a dusty star-forming proto-bulge component. How is such a dusty starburst triggered at the center of the galaxies? What is a feeding process to a proto-bulge component? Although a major merger is a viable process to induce a nucleated starburst, other processes should be required in the case of normal star-forming galaxies with ordinary rotational disks. Such star-forming clumps embedded in the disks are thought to be produced by gravitational instabilities of gas-rich disks (Genzel et al., 2011). However, clumps are seldom formed at the galactic center due to large velocity dispersion there. The clump migration is a more preferable process than galaxy mergers, which can transport a large amount of gas from the rotational disks to the galactic center. If gas rich clumps migrate to a galaxy center, a starburst would be induced at the center by a collision between the clumps in a manner similar to a major merger (Barnes & Hernquist, 1996).
The gas fueling to the galactic center by clump migration is also an important process in view of the co-evolution of galaxies and supermassive black holes (Bournaud et al., 2011a). Dusty star formation at the galaxy center is thought to accelerate the black-hole growth due to strong dissipation of gas and its further accretion towards the center. This scenario is preferable therefore to account for the tight relationship between bulge and supermassive black hole masses (Di Matteo et al., 2005).
4.2. Massive compact, star-forming galaxies
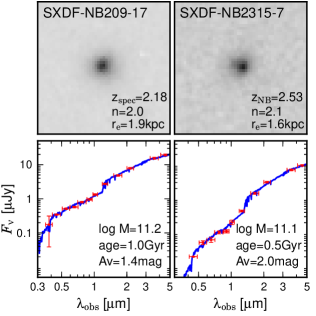
Recent observational studies have shown that massive quiescent galaxies at tend to be extremely compact compared to local ones with the same stellar mass (e.g., van Dokkum et al., 2008). This suggests that the structures of compact quiescent galaxies have undergone a rapid evolution since (Trujillo et al., 2007). However, the progenitors and the formation processes of such compact quiescent galaxies have been much less investigated. Barro et al. (2013) have studied both the number densities of compact quiescent galaxies (“red nuggets”) and compact star-forming galaxies (“blue nuggets”) at –3.0, and find that blue nuggets can fade to red nuggets with the starburst lifetime of Gyr. In our H emitter sample, we find two massive, compact star-forming galaxies with M M⊙ and kpc (SXDF-NB209-17 and SXDF-NB2315-7 in Figure 4). Their surface stellar mass densities are as high as those of red nuggets at –2.0 (Newman et al., 2012a). Moreover, the two compact HAEs show high Srsic indices of , which indicate relaxed bulge-like morphologies. They can directly turn into compact quiescent galaxies at high-redshift just by stopping their star-formation activities without changing the sizes or structures. Note that SXDF-NB209-17 has been spectroscopically confirmed to be located at (Tadaki et al., in preparation).
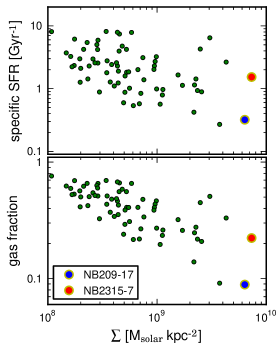
The star-formation activities and stellar populations substantially differ between the two compact HAEs. Figure 8 shows the relation between stellar surface density (defined as ) and specific SFR (=SFR/) for the HAEs. SXDF-NB209-17 is found to have significantly suppressed specific SFRs compared to the other extended HAEs. This may suggest that the star-forming activity in the compact galaxy is just beginning to be quenched. In contrast, the star-formation activity of SXDF-NB2315-7 is still high despite its large stellar mass of . Next, we evaluate the gas mass of HAEs from with the assumption of the Kennicutt-Schmidt relation, (Kennicutt, 1998). While most of the HAEs show high gas fractions of , consistent with the direct measurements of gas fraction in star-forming galaxies at based on the CO observations (Tacconi et al., 2010; Daddi et al., 2010), the gas fractions of the two nuggets are clearly much lower, especially for SXDF-NB209-17. This further supports the idea that they are in the transitional phase from star-forming to quiescent galaxies.
Also, the SED from UV to near-infrared indicates an old stellar population with the age of 1.0 Gyr in SXDF-NB209-17, while SXDF-NB2315-7 is likely to be a young dusty star-bursting galaxy with the age of 0.5 Gyr and dust extinction of 2.0 mag in (Figure 9). These results suggest that both of them are good candidates for the progenitors of red nuggets at , but they are in the midst of the different evolutionary phases on the way to quiescent galaxies. While SXDF-NB2315-7 is in the starburst phase, SXDF-NB209-17 is probably a similar population to the young quiescent (post-starburst) galaxies reported by Whitaker et al. (2012). Such a compact star-forming phase appears only at and it can be the direct channel to form red nuggets seen at similar redshifts.
5. Formation of massive quiescent galaxies
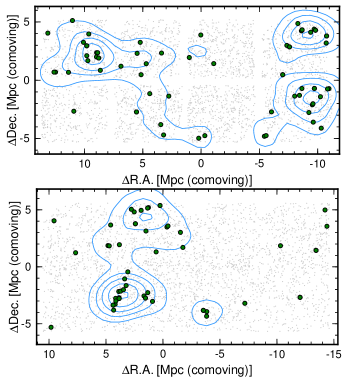
We have presented two kinds of curious populations: galaxies with a nuclear dusty star-forming clump, and the very compact star-forming nuggets. The fundamental questions are how they evolve afterwards and what their descendant galaxies are in the present Universe. The constant number density method is a useful approach with which we can link high-redshift galaxies to the local ones (e.g., Leja et al., 2013). As shown in Figure 1, the completeness limit of our survey almost reaches down to . The stellar masses of the HAEs with red clumps and the star-forming nuggets are (Figures 1 and 9), which corresponds to the number density of – Mpc-3 (Patel et al., 2013). At the constant number density, their descendants would be massive galaxies with at , and dominated by red, quiescent galaxies (Baldry et al., 2004). Moreover, our HAEs are inhomogeneously distributed and constitute large-scale structures at (Figure 10). The galaxies existing in such overdense regions at high redshifts are most likely the progenitors of massive, quiescent galaxies like giant ellipticals in the local clusters/groups, rather than late-type galaxies that dominate in less dense environments. In this section, we will discuss the evolutionary paths of our sample of star-forming galaxies at high redshifts to the massive quiescent galaxies at later epochs.
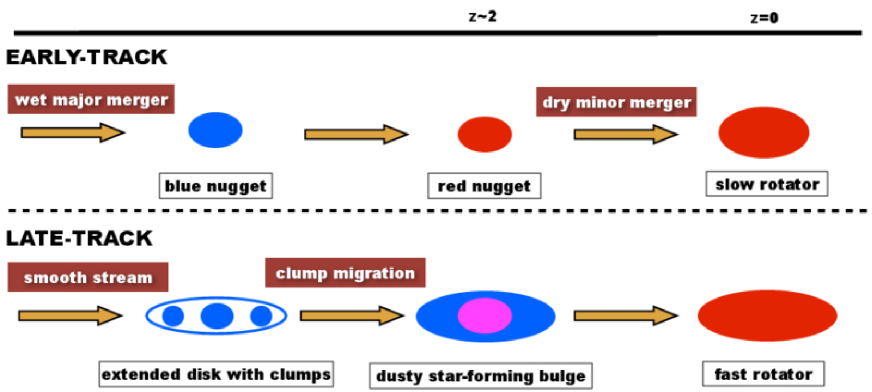
We present the schematic chart of the two kinds of evolutionary tracks from high-redshift galaxies to local quiescent ones in Figure 11. In the numerical simulations, a gas-rich major merger at high redshifts can produce a massive, compact system (Wuyts et al., 2009; Bournaud et al., 2011b). Our two star-forming nuggets are likely to be in the phase of violent starburst or shortly after that. They would subsequently quench star formation (and become red nuggets), and further evolve from red nuggets into large quiescent galaxies through a number of dry minor mergers. By forepast dissipational processes such as a major merger, they would be dispersion-dominated objects, and be observed as slow rotators, early-type galaxies in the present Universe (Emsellem et al., 2011). They would show little or no rotation. This evolutionary path would be most efficient at high redshifts because almost all the star-forming galaxies are no longer compact at , and therefore this path can be called (Barro et al., 2013).
Though the short duty cycle of star-forming nuggets can explain the evolution of number density of red nuggets (Barro et al., 2013), the number density of massive quiescent galaxies increases by a factor of two between and (Brammer et al., 2011), at which the nuggets would be very rare. This means that there must be another evolutionary path to form quiescent galaxies from the majority of star-forming galaxies. The size evolution during the star-forming phase before they quench star formation is also quite important as well as the later growth of their sizes by minor mergers. We find a lot of star-forming galaxies with extended disks at (Figure 4). They are expected to evolve into more massive galaxies just following the local mass–size relation, unless some external processes such as mergers happen to occur. The feeding process through cold gas accretions would calm down at , because even typical dark matter halos become as massive as and the gas within the halos is heated up by a virial shock (Dekel & Birnboim, 2006). The remaining cold gas within galaxies is gradually consumed and star-formation activities would be significantly decreased due to the inefficient supply of cold gas. Therefore, the HAEs with extended disks would quench their star formation eventually at later times, and directly evolve into large quiescent galaxies that are more frequently present at , just by the consumption of gas. This path for the latecomers of quiescent galaxies can be called (Barro et al., 2013).
Massive, large quiescent galaxies through the late track should be observed as fast rotator early type galaxies at , provided that their progenitors do not undergo dissipational processes (Cappellari et al., 2013). However, the formation process of bulge components is still unknown in the late track. It needs the transformation of structures as well as the size evolution. We show that a lot of HAEs have clumpy morphologies. We also find that nuclear dusty star-forming clumps in the HAEs with are the expected sites of bulge formation. A gas supply through giant clumps could fully explain such a dusty star-forming proto-bulge although we do not have any definitive evidence for it yet. Since a galactic wind at each clump may disrupt the clumps before they migrate to the center, such feedback process is also critical to destine the subsequent evolution of the clumps (Hopkins et al., 2012). To validate the scenario of clump migration, we have to know whether the clumps contain gas that is massive enough to be left over after a rapid consumption by high star-forming activity and a subsequent strong stellar feedback. High-resolution observations with JVLA and/or ALMA provide us with valuable information about the amount of molecular gas within clumps. Our discovery of dusty star-forming clumps is the first step to verifying the clump migration scenario to form galactic bulges.
6. Summary
In this paper, we present and discuss the morphological properties of H selected star-forming galaxies at in SXDF-UDS-CANDELS field. Using the high-resolution images that trace the rest-frame UV and optical light, many kilo-parsec scale clumps are identified within galaxies by a semi-automatic method. We find that at least 41% of our sample show clumpy structures and the fraction of clumpy galaxy peaks in . We find no significant difference in the distribution on the offset from the main sequence between clumpy and non-clumpy galaxies, however.
For HAEs containing a red clump, it is found that the clump closest to the galaxy center is redder compared to the off-center clumps in the disks. The presence of infrared emission and the H flux density maps of four of them suggest that dusty star formation is most likely occurring in the nuclear red clump. Since it is unlikely that a clump is directly formed from gravitational instabilities in a galaxy center with such large velocity dispersion, one needs a feeding process to drive a large amount of gas to the center. The clump migration to the galactic center and the subsequent starburst there seem to be a promising mechanism in galactic bulge formation at .
Also, we obtain the structural parameters (effective radius and Srsic index) for 70 objects with . Seventy-four percent of the HAEs at seem to have disk-like morphologies according to their Srsic indices. The similarity of the size–mass relation for the majority of the star-forming galaxies at to the local relation may suggest that many galaxies have already obtained disks as extended as the local ones. However, it is notable that we observe two massive compact star-forming galaxies at . One has slightly smaller specific SFR than others, suggesting that star formation is just being quenched. In contrast, the other is an actively star-forming galaxy with a high specific SFR. Given their high stellar surface densities, these compact HAEs are likely to be the direct progenitors of compact quiescent galaxies at . Their Srsic indices of also support bulge-dominated morphologies.
They would then later evolve by minor mergers, particularly in terms of size, into massive quiescent galaxies by the present day. If these massive compact HAEs at are in the post-starburst or in the starburst phases due to gas-rich major mergers, they would be observed as slow rotator, early-type galaxies in the present-day Universe.
On the other hand, to account for the increase in the number density of quiescent galaxies from to , we consider another evolutionary path from high-redshift star-forming galaxies to local quiescent galaxies; these star-forming galaxies continuously grow both in size and in mass along the size–mass relation and develop large disks, and at some point they eventually stop their star-formation activity and directly evolve into large quiescent galaxies as latecomers. In our sample, we actually find a lot of massive HAEs following the local size–mass relation. The clump migration would be the preferred mechanism in this scenario to grow bulge component. They would end up with fast rotator, early-type galaxies at .
Our unique, unbiased sample of star-forming galaxies at and their morphological properties have revealed that these two evolutionary paths can successfully provide us with reasonable understanding of the overall evolution of massive quiescent galaxies from to .
In this work, we treat a clumpy galaxy as a single disk galaxy. However, it also resembles a merging system, and we are not sure of such a hypothesis with the current stellar continuum map alone. We need to investigate the kinematics of the HAEs by IFU spectroscopy at near-infrared with AO as well as CO spectroscopy in radio to reveal their physical states based on both internal velocity and spatial structures. We also note that our analyses do not fully consider the effects of AGNs since spectroscopic follow-up observations have been conducted only for a part of the HAEs. By performing a near-infrared spectroscopy on a complete, statistical sample of our HAEs, we must be able to understand how much AGN feedback actually contributes to the quenching of star-formation in massive galaxies at the peak epoch of their formation.
This paper is based on data collected at Subaru Telescope, which is operated by the National Astronomical Observatory of Japan. We thank the Subaru telescope staff for their help in the observation. We thank the anonymous referee who gave us many useful comments, which improved the paper. K.T. would also like to thank Dr. Kazuhiro Shimasaku, Professor Masashi Chiba, Dr. Nobunari Kashikawa, Dr. Kentaro Motohara, Dr. Masami Ouchi, and Professor Masanori Iye for useful discussions and comments. K.T. and Y.K. acknowledge the support from the Japan Society for the Promotion of Science (JSPS) through JSPS research fellowships for young scientists. T.K. acknowledges the financial support in part by a Grant-in-Aid for the Scientific Research (Nos. 18684004, 21340045, and 24244015) by the Japanese Ministry of Education, Culture, Sports, Science and Technology.
References
- Baldry et al. (2004) Baldry, I. K., Glazebrook, K., Brinkmann, J., et al. 2004, ApJ, 600, 681, 681
- Barden et al. (2012) Barden, M., Häußler, B., Peng, C. Y., McIntosh, D. H., & Guo, Y. 2012, MNRAS, 422, 449, 449
- Barnes & Hernquist (1996) Barnes, J. E., & Hernquist, L. 1996, ApJ, 471, 115, 115
- Barro et al. (2013) Barro, G., Faber, S. M., Pérez-González, P. G., et al. 2013, ApJ, 765, 104, 104
- Bezanson et al. (2009) Bezanson, R., van Dokkum, P. G., Tal, T., et al. 2009, ApJ, 697, 1290, 1290
- Bolzonella et al. (2000) Bolzonella, M., Miralles, J., & Pelló, R. 2000, A&A, 363, 476, 476
- Bournaud et al. (2011a) Bournaud, F., Dekel, A., Teyssier, R., et al. 2011a, ApJ, 741, L33, L33
- Bournaud & Elmegreen (2009) Bournaud, F., & Elmegreen, B. G. 2009, ApJ, 694, L158, L158
- Bournaud et al. (2007) Bournaud, F., Elmegreen, B. G., & Elmegreen, D. M. 2007, ApJ, 670, 237, 237
- Bournaud et al. (2011b) Bournaud, F., Chapon, D., Teyssier, R., et al. 2011b, ApJ, 730, 4, 4
- Brammer et al. (2011) Brammer, G. B., Whitaker, K. E., van Dokkum, P. G., et al. 2011, ApJ, 739, 24, 24
- Bruzual & Charlot (2003) Bruzual, G., & Charlot, S. 2003, MNRAS, 344, 1000, 1000
- Cappellari & Copin (2003) Cappellari, M., & Copin, Y. 2003, MNRAS, 342, 345, 345
- Cappellari et al. (2013) Cappellari, M., McDermid, R. M., Alatalo, K., et al. 2013, MNRAS, 432, 1862, 1862
- Ceverino et al. (2010) Ceverino, D., Dekel, A., & Bournaud, F. 2010, MNRAS, 404, 2151, 2151
- Conselice et al. (2003) Conselice, C. J., Chapman, S. C., & Windhorst, R. A. 2003, ApJ, 596, L5, L5
- Daddi et al. (2010) Daddi, E., Bournaud, F., Walter, F., et al. 2010, ApJ, 713, 686, 686
- Dekel & Birnboim (2006) Dekel, A., & Birnboim, Y. 2006, MNRAS, 368, 2, 2
- Dekel & Cox (2006) Dekel, A., & Cox, T. J. 2006, MNRAS, 370, 1445, 1445
- Dekel et al. (2009a) Dekel, A., Sari, R., & Ceverino, D. 2009a, ApJ, 703, 785, 785
- Dekel et al. (2009b) Dekel, A., Birnboim, Y., Engel, G., et al. 2009b, Nature, 457, 451, 451
- Di Matteo et al. (2005) Di Matteo, T., Springel, V., & Hernquist, L. 2005, Nature, 433, 604, 604
- Elmegreen & Elmegreen (2005) Elmegreen, B. G., & Elmegreen, D. M. 2005, ApJ, 627, 632, 632
- Elmegreen et al. (2009) Elmegreen, B. G., Elmegreen, D. M., Fernandez, M. X., & Lemonias, J. J. 2009, ApJ, 692, 12, 12
- Emsellem et al. (2011) Emsellem, E., Cappellari, M., Krajnović, D., et al. 2011, MNRAS, 414, 888, 888
- Förster Schreiber et al. (2011a) Förster Schreiber, N. M., Shapley, A. E., Erb, D. K., et al. 2011a, ApJ, 731, 65, 65
- Förster Schreiber et al. (2009) Förster Schreiber, N. M., Genzel, R., Bouché, N., et al. 2009, ApJ, 706, 1364, 1364
- Förster Schreiber et al. (2011b) Förster Schreiber, N. M., Shapley, A. E., Genzel, R., et al. 2011b, ApJ, 739, 45, 45
- Genel et al. (2012) Genel, S., Naab, T., Genzel, R., et al. 2012, ApJ, 745, 11, 11
- Genzel et al. (2006) Genzel, R., Tacconi, L. J., Eisenhauer, F., et al. 2006, Nature, 442, 786, 786
- Genzel et al. (2011) Genzel, R., Newman, S., Jones, T., et al. 2011, ApJ, 733, 101, 101
- Grogin et al. (2011) Grogin, N. A., Kocevski, D. D., Faber, S. M., et al. 2011, ApJS, 197, 35, 35
- Guo et al. (2012) Guo, Y., Giavalisco, M., Ferguson, H. C., Cassata, P., & Koekemoer, A. M. 2012, ApJ, 757, 120, 120
- Hayashi et al. (2012) Hayashi, M., Kodama, T., Tadaki, K.-i., Koyama, Y., & Tanaka, I. 2012, ApJ, 757, 15, 15
- Hopkins & Beacom (2006) Hopkins, A. M., & Beacom, J. F. 2006, ApJ, 651, 142, 142
- Hopkins et al. (2012) Hopkins, P. F., Kereš, D., Murray, N., Quataert, E., & Hernquist, L. 2012, MNRAS, 427, 968, 968
- Ichikawa et al. (2012) Ichikawa, T., Kajisawa, M., & Akhlaghi, M. 2012, MNRAS, 422, 1014, 1014
- Inoue & Saitoh (2012) Inoue, S., & Saitoh, T. R. 2012, MNRAS, 422, 1902, 1902
- Kennicutt (1998) Kennicutt, Jr., R. C. 1998, ARA&A, 36, 189, 189
- Kodama et al. (1999) Kodama, T., Bell, E. F., & Bower, R. G. 1999, MNRAS, 302, 152, 152
- Kodama & Bower (2003) Kodama, T., & Bower, R. 2003, MNRAS, 346, 1, 1
- Kodama et al. (2013) Kodama, T., Hayashi, M., Koyama, Y., et al. 2013, in IAU Symposium, Vol. 295, IAU Symposium, ed. D. Thomas, A. Pasquali, & I. Ferreras, 74–77
- Koekemoer et al. (2011) Koekemoer, A. M., Faber, S. M., Ferguson, H. C., et al. 2011, ApJS, 197, 36, 36
- Koyama et al. (2013) Koyama, Y., Kodama, T., Tadaki, K.-i., et al. 2013, MNRAS, 428, 1551, 1551
- Kriek et al. (2009) Kriek, M., van Dokkum, P. G., Labbé, I., et al. 2009, ApJ, 700, 221, 221
- Kriek et al. (2006) Kriek, M., van Dokkum, P. G., Franx, M., et al. 2006, ApJ, 649, L71, L71
- Law et al. (2009) Law, D. R., Steidel, C. C., Erb, D. K., et al. 2009, ApJ, 697, 2057, 2057
- Law et al. (2007) —. 2007, ApJ, 656, 1, 1
- Lawrence et al. (2007) Lawrence, A., Warren, S. J., Almaini, O., et al. 2007, MNRAS, 379, 1599, 1599
- Leja et al. (2013) Leja, J., van Dokkum, P., & Franx, M. 2013, ApJ, 766, 33, 33
- Livermore et al. (2012) Livermore, R. C., Jones, T., Richard, J., et al. 2012, MNRAS, 427, 688, 688
- Lotz et al. (2006) Lotz, J. M., Madau, P., Giavalisco, M., Primack, J., & Ferguson, H. C. 2006, ApJ, 636, 592, 592
- Naab et al. (2009) Naab, T., Johansson, P. H., & Ostriker, J. P. 2009, ApJ, 699, L178, L178
- Newman et al. (2012a) Newman, A. B., Ellis, R. S., Bundy, K., & Treu, T. 2012a, ApJ, 746, 162, 162
- Newman et al. (2012b) Newman, S. F., Shapiro Griffin, K., Genzel, R., et al. 2012b, ApJ, 752, 111, 111
- Newman et al. (2013) Newman, S. F., Genzel, R., Förster Schreiber, N. M., et al. 2013, ApJ, 767, 104, 104
- Oogi & Habe (2013) Oogi, T., & Habe, A. 2013, MNRAS, 428, 641, 641
- Patel et al. (2013) Patel, S. G., van Dokkum, P. G., Franx, M., et al. 2013, ApJ, 766, 15, 15
- Peng et al. (2010) Peng, C. Y., Ho, L. C., Impey, C. D., & Rix, H.-W. 2010, AJ, 139, 2097, 2097
- Rodighiero et al. (2011) Rodighiero, G., Daddi, E., Baronchelli, I., et al. 2011, ApJ, 739, L40, L40
- Salpeter (1955) Salpeter, E. E. 1955, ApJ, 121, 161, 161
- Sersic (1968) Sersic, J. L. 1968,
- Shen et al. (2003) Shen, S., Mo, H. J., White, S. D. M., et al. 2003, MNRAS, 343, 978, 978
- Simpson et al. (2012) Simpson, C., Rawlings, S., Ivison, R., et al. 2012, MNRAS, 421, 3060, 3060
- Stott et al. (2013) Stott, J. P., Sobral, D., Smail, I., et al. 2013, MNRAS, 430, 1158, 1158
- Swinbank et al. (2012) Swinbank, A. M., Sobral, D., Smail, I., et al. 2012, MNRAS, 426, 935, 935
- Tacconi et al. (2010) Tacconi, L. J., Genzel, R., Neri, R., et al. 2010, Nature, 463, 781, 781
- Tadaki et al. (2011) Tadaki, K.-I., Kodama, T., Koyama, Y., et al. 2011, PASJ, 63, 437, 437
- Tanaka et al. (2011) Tanaka, I., Breuck, C. D., Kurk, J. D., et al. 2011, PASJ, 63, 415, 415
- Targett et al. (2013) Targett, T. A., Dunlop, J. S., Cirasuolo, M., et al. 2013, MNRAS, 432, 2012, 2012
- Taylor et al. (2010) Taylor, E. N., Franx, M., Glazebrook, K., et al. 2010, ApJ, 720, 723, 723
- Toft et al. (2007) Toft, S., van Dokkum, P., Franx, M., et al. 2007, ApJ, 671, 285, 285
- Trujillo et al. (2007) Trujillo, I., Conselice, C. J., Bundy, K., et al. 2007, MNRAS, 382, 109, 109
- Trujillo et al. (2006) Trujillo, I., Feulner, G., Goranova, Y., et al. 2006, MNRAS, 373, L36, L36
- van der Wel et al. (2012) van der Wel, A., Bell, E. F., Häussler, B., et al. 2012, ApJS, 203, 24, 24
- van Dokkum et al. (2008) van Dokkum, P. G., Franx, M., Kriek, M., et al. 2008, ApJ, 677, L5, L5
- van Dokkum et al. (2010) van Dokkum, P. G., Whitaker, K. E., Brammer, G., et al. 2010, ApJ, 709, 1018, 1018
- Whitaker et al. (2012) Whitaker, K. E., Kriek, M., van Dokkum, P. G., et al. 2012, ApJ, 745, 179, 179
- Williams et al. (1994) Williams, J. P., de Geus, E. J., & Blitz, L. 1994, ApJ, 428, 693, 693
- Wuyts et al. (2009) Wuyts, S., Franx, M., Cox, T. J., et al. 2009, ApJ, 700, 799, 799
- Wuyts et al. (2012) Wuyts, S., Förster Schreiber, N. M., Genzel, R., et al. 2012, ApJ, 753, 114, 114
- Wuyts et al. (2013) Wuyts, S., Forster Schreiber, N. M., Nelson, E. J., et al. 2013, ArXiv e-prints, arXiv:1310.5702
- Yuma et al. (2012) Yuma, S., Ohta, K., & Yabe, K. 2012, ApJ, 761, 19, 19