Disorder Driven Metal-Insulator Transition in BaPb1-xBixO3 and Inference of Disorder-Free Critical Temperature
Abstract
We performed point-contact spectroscopy tunneling measurements on single crystal BaPb1-xBixO3 for , , , and at temperatures ranging from K and find a suppression in the density of states at low bias-voltages, which has not previously been reported. The classic square root dependence observed in the density of states fits within the theoretical framework of disordered metals, and we find that the correlation gap disappears around a critical concentration . We also report a linear dependence of the zero-temperature conductivity, , with concentration, where at . We conclude that a disorder driven metal-insulator transition occurs in this material before the onset of the charge disproportionated charge density wave insulator. We explore the possibility of a scaling theory being applicable for this material. In addition, we estimate the disorder-free critical temperature using theory developed by Belitz Belitz89 and Fukuyama et. al.Fukuyama84 and compare these results to Ba1-xKxBiO3.
pacs:
74.45.+cThe bismuthate superconductors (doped BaBiO3) were the first class of oxide superconductors to be discovered Sleight75 ; Cava88 . They exhibit moderately high superconducting transition temperatures (up to K in BaPb1-xBixO3 (BPBO) and K in BaKxBi1-xO3 (BKBO)), and they are another example of a high superconducting phase adjacent to a competing ordered phase, only in this case the ordered phase is in the charge sector Uchida87 ; Tarapheder96 . They were highly studied in the era before the discovery of the cuprate superconductors.
Still, despite this considerable effort, neither the electronic structure of these materials nor the ingredients of their superconductivity could be satisfactorily treated theoretically Meregalli98 ; Mattheiss83 ; Mattheiss85 . Simple valance arguments suggest that the parent compound BaBiO3 should be a half-filled band metal with Bi in a valence state, whereas in fact it is an insulator due to charge disproportionation (e.g. Bi BiBi5+) lending to a so-called charge disproportionated charge density wave (CD-CDW), which is a distinct form of CDW not associated with Fermi surface nesting. One can also think of the CD-CDW as arising from a negative-U on the Bi sites. Traditional density functional electronic structure calculations were not able to account for this CD-CDW state, and the most up to date calculations of the electron-phonon interaction parameter yield values that are too small to account for the observed high transition temperatures Meregalli98 .
Recently the theoretical situation has greatly improved. Franchini et. al. first showed that the insulating state (as well as the structure and lattice constants) of BaBiO3 could be understood within density functional theory if a new functional (the so-called HSE functional) was used Franchini09 ; Franchini10 . This functional is computationally more complex but incorporates better the Coulomb correlations present in the bismuthates. Using this approach, Yin et. al. showed that in the bismuthates was “dynamically” enhanced and that these larger values could account for the observed transition temperatures. In their work, to calculate , these authors used the strong-coupled McMillan formulation of the Eliashburg theory and their calculated values of and the renormalized Coulomb interaction parameter Yin11 ; Yin13 .
In this Letter, we show that the effects of disorder (localization) are another essential factor in understanding these materials that has not been appreciated previously. Specifically, we show that in BPBO there is a disorder-induced metal-insulator transition at a composition where is the critical concentration at which the CD-CDW state forms. For we also observe a reduction in the tunneling density of states at the Fermi level that is expected due to electron-electron interactions in the presence of disorder. When such disorder effects are present, one also expects a reduction of due to a disorder-enhanced , as first noted by Fukuyama et. al. Fukuyama84 .
Building on this fact, and using the most complete theory of the effects of disorder on , we show that it is possible to back out an estimate of the disorder-free transition temperature from our data. The result is that in the case of BPBO the maximum inferred disorder-free is around a factor of 2 higher than the experimental value at optimal doping. In the larger picture, we believe our results are relevant for determining the intrinsic in any material for which the resistivity (or for a film, the sheet resistance) is large enough that it is in the regime of localization effects and for which in the pairing interaction the Coulomb repulsion between the pairs is avoided by retardation.
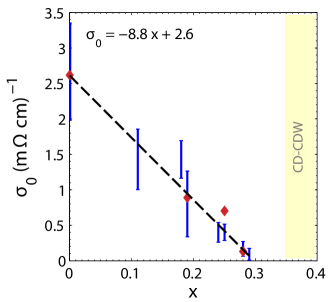
The existence of a metal-insulator transition is demonstrated in Fig. 1 where the zero-temperature conductivity is plotted as a function of composition. The conductivity decreases linearly to the critical value = 0.30 The blue lines are obtained from the four-point resistivity measurement shown in Fig. 2 of Ref. GiraldoGallo12 , where a linear extrapolation is made using points prior to the onset of . The variation is due to geometrical factors from four to five resistivity measurements per doping concentration. The red diamonds correspond to the zero temperature conductivity for the exact samples used in the tunneling measurements discussed below. Note that in the literature the best estimates of the concentration for the onset of the CD-CDW state is = 0.35 Uchida87 . (See yellow region in the figure.)
An example of our tunneling data are shown in Fig. 2. The data were obtained using point-contact spectroscopy (PCS) measurements on single-crystals of BaPb1-xBixO3 (BPBO) with doping concentrations , , , and , and grown in a method described in Ref. GiraldoGallo12 . Measurements were performed from temperatures ranging from K. The junctions were prepared by cleaving the sample in air and then bringing the sample in contact with the tip at room temperature. The apparatus was then inserted into a flow cryostat for measurements. In the superconducting range of compositions, superconducting densities of states were observed that are consistent with those reported in the past by many researchers Ekino89 ; Dynes91PRB ; Szabo97 ; Suzuki92 .
However, in Fig. 2, we focus on the behavior of the density of states above , which is a region where little attention has been given. A cusp is observed in the differential conductance measurement, as shown for example in the insert of Fig. 2, which shows the tunneling density of states at low bias-voltages for the sample with (i.e., BPO, which is not a superconductor). Similar cusps are seen for all concentrations including those that are superconducting. To our knowledge, this cusp has not been noted previously, where historically attention has been focused on the unexplained asymmetric v-shaped tunneling density of states at higher voltages Sharifi91 . On the other hand, the cusp we report is similar to that seen in amorphous Nb-Si alloys Hertel83 , which is one of the classic cases of a disorder driven (localization) metal-insulator transition. In plotting the data in Fig. 2 the data have been normalized to the differential conductance at 25 mV, which we take as a measure of the background density of states free of disorder effects. There is some arbitrariness in this choice due to the unexplained linear background at high bias voltages universally seen in bismuth tunneling data. On the other hand, examination of the insert in the figure indicates that the zero-bias anomaly of interest to us merges into the linear background in the vicinity of 25 mV.
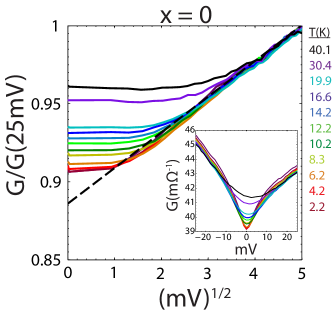
The theory of the reduction of the density of states due to disorder-enhanced Coulomb interactions is well established. In three dimensions, It predicts that , where is the density of states at zero temperature and is the correlation gap Altshuler79 . As shown in the main part of Fig. 2, our data follow this energy dependence very well. Here we have plotted the normalized tunneling density of states versus the square root of the bias voltage for various temperatures. From the fit to the data (dashed line in the figure), we can determine both the correlation gap (inverse slope) and the zero-temperature reduction in the density of states at zero-bias (zero voltage intercept).
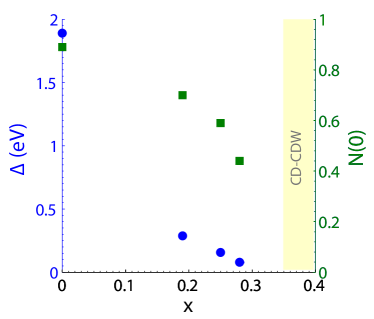
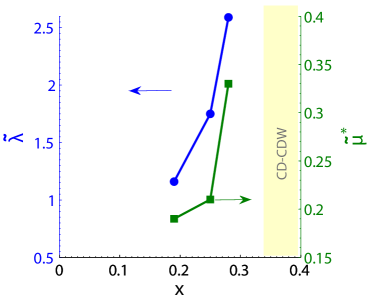
A similar procedure can be performed for the other concentrations, and the results are shown in Fig. 3. As the conductance is asymmetric, results differ between positive and negative bias-voltages. The differences are not large, however, and for clarity of presentation we show only the data for positive bias. The blue circles represent the correlation gap, , and the green squares represent the density of states at zero temperature and zero-bias voltage, . As is evident in the figure, the correlation gap nicely extrapolates to zero at =0.30, as determined from the transport data.
Having established the existence of a metal-insulator transition due to disorder, it is of interest to compare our results with McMillan’s scaling theory McMillan81 of such transitions that was developed to account for the disorder-driven metal-insulator transition seen in NbxSix Hertel83 . The scaling theory involves two critical exponents and . In terms of these exponents, the theory predicts for that , , and . Our transport and tunneling density of states data are nicely consistent with the first two predictions of the theory and yield a value . The fits for and as functions of are less satisfactory. The first yields and the second, .
Granted more data points would yield more accurate results. Also, as noted above, some uncertainty can be associated with the normalization procedure use in the tunneling data. In addition, we should note that the scaling theory is only valid around the critical region whereas we are including points at , which is relatively far from the critical concentration . And, as pointed out by Lee et. al. Lee82 ; Lee85 , while McMillan’s scaling theory is a good starting point for data analysis, there are some subtleties in his assumptions about the screening constant and conductivity being proportional to the single particle density of states, , rather than the change of density with chemical potential, . Last but not least, the theory does not consider what would happen when the metal-insulator transition is very near a CD-CDW transition. In short, we are entering unexplored territory.
Let us now turn to the issue of the reduction of due to disorder. From the work of Belitz Belitz89 , which is the latest word on this subject for three dimensional systems, we have a McMillan-like equation for valid for strong coupling and relatively strong disorder.
| (1) |
The actual theory uses the prefactor in front of the exponential, but as not enough information is known to determine , we fall back to an older form of the McMillan formulation.
Conveniently for our purposes, the disorder is parameterized by the fractional reduction of the density of states at the Fermi energy.
| (2) |
where is the density of states evaluated at a characteristic phonon frequency, and is the clean normal-metal DOS at the Fermi level. For simplicity we have taken .
enters the equation for the reduction of both explicitly as shown in the equation and implicitly through the disorder-dependent electron-phonon coupling and the disorder-dependent Coulomb pseudopotential .
In the theory of Belitz, both and also depend on the ratio between the Thomas Fermi screening wave number and the Fermi wavenumber, . We estimate these wave numbers using simple band relations and , where . Experimental results of the Debye temperature Itoh84 , the Fermi energy Tani80 , and the carrier density Thanh80 were used where there is a nice summary of these parameters for various concentrations shown in Table 1 of Ref. Kitazawa85 . The renormalized Coulomb interaction with no disorder is also estimated using the Morel-Anderson equation, with Morel62 . This procedure produces the value = 0.14.
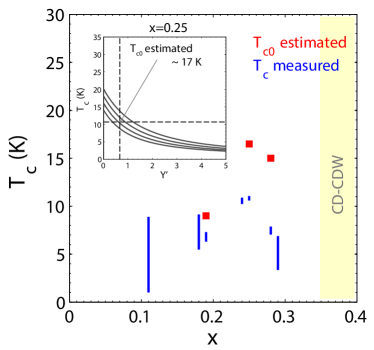
Using this theory, for an assumed value of (or equivalently ) and the calculated value of , we can graphically depict the dependence of on the disorder parameter for BPBO, as shown in the insert of Fig. 4 for . A family of curves exist for various starting points of . As the disorder parameter increases, is suppressed. We are able to triangulate which curve in the figure is relevant to our material as we measured , whose value is shown by the horizontal dashed line. We also determined the zero temperature DOS, , from our measurements, hence we know , which is shown by the vertical dashed line. The intersection of these two lines determines the curve relevant to our sample. If we trace the curve back to , then it determines the critical temperature with no disorder, K for this concentration.
A similar procedure to obtain the disorder free can be performed for the other two superconducting concentrations for which we obtained the zero temperature DOS. The estimated for , , and are , , and K respectively and are shown as red squares in Fig. 4. The blue lines in this figure shows the measured of four to five samples per composition and was determined from the criteria of vs. temperature. The ’s quoted in this figure are from samples of the same group from which we obtained our samples GiraldoGallo12 . One interesting feature of these data is that the disorder-free transition temperatures may not show a peak as a function of . Uncertainties in the input parameters change at most a few degrees and the uncertainty in is hard to assess in the absence of an understanding of the linear background. However, the trends observed as goes to should not be affected.
In Fig. 5 we show the corresponding disorder-dependent electron-phonon coupling (blue circles) and the disorder-dependent Coulomb pseudopotential (green squares) as a function of doping. We compare the disorder free , which is determined from Eq. 1 with and , and the disorder-dependent : , , and for , , and , respectively. Similarly, the relationship between the disorder-free and the disorder-dependent is , , and for , , and , respectively. These results are in accordance with the fact that disorder weakens screening, which effectively increases the Coulomb interactions and electron-phonon coupling. The results also suggest that and may be diverging as approaches . This possibility raises interesting theoretical questions.
It would be interesting to compare these results with BKBO, however, we would need tunneling measurements focusing on the low voltage behavior above , which are not present in the literature to our knowledge. But we can compare BPBO to BKBO if we use an earlier, less complete version of the effects of disorder on valid for weak coupling and weak disorder Fukuyama84 . In this theory, the parameter that characterizes the amount of disorder, , can be related to the diffusion constant, which in the dirty limit can be related to upper-critical field measurements (). Using upper-critical field measurements, we can again produce similar curves as in Fig. 4 to obtain , , , , , and for , , , , , and respectively. At some point we expect the theory of weak disorder and weak coupling to break down with increased concentration, , as a K is quite high. But the trend is the same as seen using the theory of Belitz.
Performing a similar analysis on the optimally doped BKBO, we find that the critical temperature does not change significantly. For the analysis, we used literature values of the upper critical field kOe/K and critical temperature K Batlogg88 , the effective mass Puchkov96 , and the Debye temperature K Ott89 . We took the Fermi energy to be eV and the renormalized Coulomb interaction . We find that while the measured critical temperature is K, the disorder-free K in the weak-coupling and weak-disorder regime. This shows that BKBO is relatively unaffected by disorder unlike BPBO.
The origin of disorder in BPBO is currently under investigation by the group of Fisher et. al. A likely reason for the disorder is due to structural effects in concert with chemical substitution. The implications of these results in understanding the superconductor-insulator transition with phase fluctuations vs. amplitude effects is currently being investigated.
In summary, we performed PCS measurements on BPBO at various temperatures and for several compositions. In addition to corroborating results of the superconducting gaps and normal state linear background, we find a disorder driven metal-insulator transition from the characteristic square-root dependence of the conductance at low bias-voltages where the correlation gap disappears around before the onset of the CD-CDW. The zero-temperature conductivity as a function of doping also indicates a metal-insulator transition with the same critical concentration of . We suggest that a scaling theory might be applied to BPBO, though McMillan’s scaling theory does not completely fit with our results. Finally, we estimated the disorder-free critical temperature in BPBO and find that disorder affects the of this material much more greatly than in BKBO. Our results reconcile the differences seen in the shape of the superconducting dome, as well as values, between BPBO and BKBO and provides a general phase diagram of this family of superconductors. We hope that our methodology will be useful when assessing the potential of disordered superconductors.
We thank Thomas Devereaux and Phil Wu for useful discussions. Support for this work came from the Air Force Office of Scientific Research MURI Contract FA9550-09-1-0583-P00006. KL further acknowledges support from the Lucent Bell Labs Graduate Fellowship.
References
- [1] D. Belitz. Phys. Rev. B, 40, 1989.
- [2] H. Fukuyama, H. Ebisawa, and S. Maekawa, 1984.
- [3] A.W. Sleight, J.L Gillson, and P.E. Bierstedt. Solid State Comm., 17, 1975.
- [4] R.J. Cava, B. Batlogg, J.J. Krajewski, R. Farrow, L.W. Rupp Jr, A.E. White, K. Short, W.F Peck, and T. Kometani. Nature, 332, 1988.
- [5] S. Uchida, K. Kitazawa, and S. Tanaka. Phase Transitions, 8, 1987.
- [6] A. Tarapheder. Int. J. Mod. Phys. B, 10, 1996.
- [7] V. Meregalli and S.Y. Savrasov. Phys. Rev. B, 57, 1998.
- [8] L.F. Mattheiss and D.R. Hamann. Phys. Rev. B, 24, 1985.
- [9] L.F. Mattheiss. Jap. J. Appl. Phys. Supplement 24-2, 28, 1983.
- [10] C. Franchini, G. Kresse, and R. Podloucky. Phys. Rev. Lett., 102, 2009.
- [11] C. Franchini, A. Sanna, M. Marsmann, and G. Kresse. Phys. Rev. B, 81, 2010.
- [12] Z.P. Yin, A. Kutepov, and G. Kotliar. arXiv:1110.5751, 2011.
- [13] Z.P. Yin, A. Kutepov, and G. Kotliar. Phys. Rev. X, 3, 2013.
- [14] P. Giraldo-Gallo, H. Lee, Y. Zhang, M.J Kramer, M.R. Beasley, T.H Geballe, and I.R. Fisher. Phys. Rev. B, 85, 2012.
- [15] Toshikazu Ekino and Jun Akimitsu. J. Phys. Soc. Japan, 58, 1989.
- [16] F. Sharifi, A. Pargellis, R.C. Dynes, B. Miller, E.S. Hellman, J. Rosamilia, and E.H. Hartford Jr. Phys. Rev. B, 44, 1991.
- [17] P. Szabó, P. Samuely, A.G.M. Jansen, P. Wyder, J. Marcus, T. Klein, and C. Escribe-Filippini. J. Of Low Temp Phys., 106, 1997.
- [18] Morio Suzuki, Kazunori Komorita, Hiroshi Nakano, and Leo Rinderer. J. Phys. Soc. Japan, 61, 1992.
- [19] F. Sharifi, A. Pargellis, and R.C. Dynes. Phys. Rev. Lett., 67, 1991.
- [20] G. Hertel, D.J. Bishop, E.G. Spencer, J.M Rowell, and R.C. Dynes. Phys. Rev. Lett., 50, 1983.
- [21] B.L Altshuler and A.G. Aronov. Solid State Comm., 30, 1979.
- [22] W.L. McMillan. Phys. Rev. B, 24, 1981.
- [23] P.A. Lee. Phys. Rev. B, 26, 1982.
- [24] Patrick A. Lee and T.V. Ramakrishnan. Rev. Mod. Phys., 57, 1985.
- [25] T. Itoh, K. Kitazawa, and S. Tanaka. J. Phys. Soc. Japan, 53, 1984.
- [26] T. Tani, T. Itoh, and S. Tanaka. J. Phys. Soc. Jpn. Suppl. A, 49.
- [27] T.D. Thanh, A. Koma, and S. Tanaka. Appl. Phys., 22, 1980.
- [28] K. Kitazawa, M. Naito, T. Itoh, and S. Tanaka. J. Phys. Soc. Jpn., 54, 1985.
- [29] P. Morel and P.W. Anderson. Phys. Rev. B, 12, 1962.
- [30] B. Batlogg, R.J. Cava, L.W. Rupp Jr., A.M. Mujsce, J.J. Krajewski, J.P. Remeika, and W.F. Peck Jr. Phys. Rev. Lett., 61, 1988.
- [31] A.V. Puchkov, T. Timusk, M.A. Karlow, S.L. Cooper, P.D. Han, and D.A. Payne. Phys. Rev. B, 54, 1996.
- [32] K.C. Ott, M.F. Hundley, G.H. Kwei, M.P. Maley, M.E. McHenry, E.J. Peterson, J.D. Thompson, and J.O. Willis. Mat. Res. Sco. Symp. Proc., 156, 1989.