Long-term variability of AGN at hard X-rays
Abstract
Aims. Variability at all observed wavelengths is a distinctive property of active galactic nuclei (AGN). Hard X-rays provide us with a view of the innermost regions of AGN, mostly unbiased by absorption along the line of sight. Characterizing the intrinsic hard X-ray variability of a large AGN sample and comparing it to the results obtained at lower X-ray energies can significantly contribute to our understanding of the mechanisms underlying the high-energy radiation.
Methods. Swift/BAT provides us with the unique opportunity to follow, on time scales of days to years and with a regular sampling, the 14–195 keV emission of the largest AGN sample available up to date for this kind of investigation. As a continuation of an early work on the first 9 months of BAT data, we study the amplitude of the variations, and their dependence on sub-class and on energy, for a sample of 110 radio quiet and radio loud AGN selected from the BAT 58-month survey.
Results. About 80% of the AGN in the sample are found to exhibit significant variability on months to years time scales, radio loud sources being the most variable, and Seyfert 1.5-2 galaxies being slightly more variable than Seyfert 1, while absorbed and unabsorbed objects show similar timing properties. The amplitude of the variations and their energy dependence are incompatible with variability being driven at hard X-rays by changes of the absorption column density. In general, the variations in the 14–24 and 35–100 keV bands are well correlated, suggesting a common origin of the variability across the BAT energy band. However, radio quiet AGN display on average 10% larger variations at 14–24 keV than at 35–100 keV, and a softer-when-brighter behavior for most of the Seyfert galaxies with detectable spectral variability on month time scale. In addition, sources with harder spectra are found to be more variable than softer ones, opposite to what it is observed below 10 keV. These properties are generally consistent with a variable, in flux and shape, power law continuum, pivoting at energies , to which a constant reflection component is superposed. When the same time scales are considered, the timing properties of AGN at hard X-rays are comparable to those at lower energies, with at least some of the differences possibly ascribable to components contributing differently in the two energy domains (e.g., reflection, absorption).
Key Words.:
Galaxies: active – Galaxies: Seyfert – X-rays: galaxies – surveys1 Introduction
Besides mapping the innermost regions of active galactic nuclei (AGN), the hardest X-rays present the further advantage of not being affected by absorption, provided that the hydrogen column density along the line of sight is lower than a few . Hence, hard X-rays can be effectively used to study the intrinsic properties of AGN emission, testing the validity of unification models that in first approximation explain the differences between the different AGN classes as a function of the viewing angle (e.g., Beckmann & Shrader 2012). In radio quiet AGN, the hard X-ray emission is postulated to originate in a two phase medium, where the soft disk photons are Comptonized by electrons in a hot plasma above the disk (Haardt & Maraschi, 1993). In radio loud objects, an additional contribution from inverse Compton scattering from relativistic electrons in the jet as well as synchrotron radiation can dominate the X-ray output.
Moreover, AGN are known to exhibit variability at all observed frequencies, whose study can provide important information about the physics, the structure and the dynamics of the emitting source. In the softer X-ray domain (), extensive variability studies have been carried out, especially in the recent years thanks to the numerous monitoring campaigns with RXTE and XMM-Newton, covering from hour to year time scales. Many important results have been obtained with these observations, as for instance the complex correlation of the X-rays with the emission at other wavelengths (e.g., McHardy et al. 2007; Soldi et al. 2008; Bell et al. 2011; Mehdipour et al. 2011; Chatterjee et al. 2011) in particular in the optical-UV band (e.g., Shemmer et al. 2003; Uttley 2005; Arévalo et al. 2008b; Breedt et al. 2010); the study of X-ray lag spectra (e.g., Arévalo et al. 2008a; Zoghbi et al. 2010; De Marco et al. 2013); the correlations between variability properties and black hole mass (e.g., Czerny et al. 2001; Lu & Yu 2001; Uttley et al. 2002; Papadakis 2004) and accretion rate (McHardy et al., 2006; Körding et al., 2007). See McHardy (2010) for a review on X-ray variability and its scaling from stellar to super-massive black holes. On the other hand, the large majority of the hard X-ray variability studies performed in the last years focused on the spectral variability of AGN at different flux levels for single bright sources or for small samples of selected objects, thanks to pointed observations of the BeppoSAX (e.g., Petrucci et al. 2000; Nicastro et al. 2000; de Rosa et al. 2007), INTEGRAL (e.g., Pian et al. 2006, 2011; Beckmann et al. 2008; Lubiński et al. 2010; Soldi et al. 2011a; Petrucci et al. 2013) and Suzaku (e.g., Reeves et al. 2007; Itoh et al. 2008; Terashima et al. 2009; Fukazawa et al. 2011; Reis et al. 2012) satellites. These X-ray studies suggest different origins for the observed variability, as for example changes of the amount of absorption or of its ionisation, fluctuations in the seed photon flux, intrinsic modifications of the corona properties or geometry (or of the jet parameters, in case of radio loud AGN), a variable contribution of different spectral components, with at least some of these scenarios being driven by accretion rate variations.
However, with the only exception being the CGRO/BATSE instrument, detecting only a handful of AGN (Harmon et al., 2004), hard X-ray, long-term monitoring has not been possible until recent years, because of the observing strategy of the hard X-ray satellites and the limited size of the field of view of their instruments. Furthermore, last generation and future hard-X-ray telescopes such as NuSTAR will have small fields of view and relatively inflexible scheduling capabilities, so future studies may tend to be limited to either short time scales or in the number of observed objects. Since November 2004, the Burst Alert Telescope (BAT, Barthelmy et al. 2005) instrument on board the Swift satellite (Gehrels et al., 2004) has been observing the sky in the 14–195 keV energy range. Thanks to its large field of view of and to Swift’s observing strategy, the BAT has been monitoring a large number of hard X-ray sources (Cusumano et al., 2010; Baumgartner et al., 2013), providing for the first time a long-term and sufficiently sampled data set. Swift/BAT light curves on different time scales, energy bands and extracted with different methods are provided through the hard X-ray transient monitoring pages111http://swift.gsfc.nasa.gov/docs/swift/results/transients (Krimm et al., 2013), and for the BAT 58-month hard X-ray survey222http://swift.gsfc.nasa.gov/docs/swift/results/bs58mon/ including more than 1000 objects, about 60% of which are AGN. The latter has been recently updated to cover 70 months of observations (Baumgartner et al., 2013).
A first study of the variability of hard X-ray selected AGN using BAT data has been presented by
Beckmann et al. (2007a). It included 44 AGN detected with high significance over the first 9 months of BAT observations. The variability study
in the 14–195 keV band has been performed using a maximum likelihood estimator and the structure function analysis. Among the main results of this work,
Seyfert 2/obscured objects were found to be more variable than Seyfert 1/unobscured ones, and an anti-correlation has been detected
between variability and luminosity.
Preliminary studies of the 5 years BAT observations but with limited numbers of AGN have been presented by Soldi et al. (2010), Ricci et al. (2011a)
and Caballero-Garcia et al. (2012). In particular the latter study focused on 5 bright AGN, detecting spectral variability in three of them, consistent
with the electron plasma temperature decreasing with increasing flux, within the Comptonization scenario.
Shimizu & Mushotzky (2013, hereafter SM13) have calculated for the first time the power density spectra (PDS) of 30 AGN at hard X-rays (all these objects are also included in our study), using BAT 14–150 keV data covering time scales from one week to a few years (). All but one PDS were found to be well fitted by a simple power law with slope , similarly to the PDS measured in the 2–10 keV domain at time frequencies lower than a break frequency . In fact, the PDS of AGN in the 2–10 keV domain has a characteristic power law shape with index for long time scales, steepening to for times scales shorter than a source-specific break time (Uttley 2005; González-Martín & Vaughan 2012), which is found to scale with black hole mass and accretion rate following the relation described by McHardy et al. (2006). The lack of correlations between variability and luminosity, and variability and black hole mass in the sample presented by Shimizu & Mushotzky (2013) has, therefore, been ascribed to the long time scales probed by this study. No decisive evidence was found to determine whether or not AGN long-term variability is energy dependent.
We present here our variability analysis of the largest AGN sample with a sufficient hard X-ray monitoring to perform this kind of study. Our analysis provides an orthogonal approach to that presented by SM13, as we consider the frequency-independent variations of the full long-term light curves, and therefore we are able to extend our study to a much larger AGN sample, while for the PDS analysis a high signal-to-noise ratio is required, thus limiting the use of this technique to the 30 objects already presented by SM13. Furthermore, we are also able to investigate the dependence of variability on energy in the hard X-ray band.
A description of the AGN light curves in the BAT 58-month survey is presented in Sect. 2, together with the estimate of the systematic uncertainties. In Sect. 3 the maximum likelihood estimator for variability is introduced and the selected sample of 110 AGN is described. The correlation analysis between variability and the AGN fundamental parameters is detailed in Sect. 4, while Sect. 5 presents the study of spectral variability within the BAT energy range. We discuss our results (Sect. 6) with particular emphasis on the comparison between hard X-ray and soft X-ray variability, since this can provide important insights on the mechanisms responsible for the observed emission across the high-energy spectrum. A summary of our conclusions is given in Sect. 7.
Considering the importance of the analysed time scales in the results presented here, we will generally refer to long time scales (and low time frequencies) for variability studies considered to sample the PDS above the break , and to short time scales (and high time frequencies) below the break. In the following we use a CDM cosmology with , and .
2 Swift/BAT light curves analysis
Among the 1092 sources detected in the BAT 58-month survey, 625 are AGN. We exclude from this list the 6 pairs of AGN whose sky positions are too close to safely avoid contamination of the light curves, i.e., objects with BAT coordinates within 2 arcmin from each other. For these 613 AGN we retrieved the publicly available light curves covering the time from the beginning of the mission up to May 2010, therefore including up to 66 months of data333We note that even though 58 months of BAT data were used for source detection, the light curves used in this work extend beyond this data set, i.e. up to 66 months.. The light curves have been extracted from the snapshot (i.e. a single Swift pointing lasting about 20 minutes) images corrected for off-axis effects. The images were created in 8 energy bands, i.e. 14–20, 20–24, 24–35, 35–50, 50–75, 75–100, 100–150, 150–195 keV. In order to convert count rates in the total 14–195 keV band to fluxes, we assume a Crab-like spectrum (; Tueller et al. 2010) with a flux of corresponding to a count rate of (average from the Crab snapshot light curve). The complete description of the BAT data analysis and light curve extraction is provided in Tueller et al. (2010) and Baumgartner et al. (2013).
The reference light curves used for our analysis are obtained from the combined 14–195 keV light curves first rebinned to 30 days and then filtered to exclude points with exposure time shorter than one day, and data points with error bars larger than . To derive this value, the histogram of the flux uncertainties for all light curves was built in logarithmic space, and the histogram peak and minimum identified. The value (i.e., as far above the peak of the distribution as the minimum is below) is considered to mark the beginning of the high-value tail of the distribution of flux uncertainties and, therefore, is used as the cut-off value, .
2.1 Light curve systematic errors
Residual systematic uncertainties can affect the light curves and need to be taken into account before a variability analysis can be performed. Among them, the most important contributions come from a component which is proportional to the source flux, a component that can be derived from empty sky positions, and a term due to summing up energy and time bins that are somehow correlated. is estimated using the Crab light curve under the assumption that it is constant. Fitting the Crab orbital light curve with a constant, a systematic error needs to be added in order to obtain a reduced equal to 1. A further source of uncertainty is expected following the finding of long-term variability in the Crab light curve (up to 7% on year time scale; Wilson-Hodge et al. 2011), therefore, the value of the term is likely to be overestimated here. Due to the difficulty of disentangling the systematic component from the intrinsic Crab variability, we prefer to choose a conservative approach and to adopt the 0.06 value. In any case, even when reducing this term to 0.01, the amplitude of the variations increases on average by only 2–3%, largely within the estimated uncertainties on the variability estimator (see Sect. 3.1).
The component is estimated by constructing orbital light curves from blank sky positions and building the histogram of all the resulting significances. By selecting sky positions with no sources, a Gaussian distribution centered on zero for the significances is expected. Any significant deviation from a zero mean value or from a width equal to 1 would point towards systematic uncertainties. Indeed the statistical errors need to be increased by in order to obtain a Gaussian fit to the histogram of significances with width equal to 1.
Finally, from the comparison between the 14–195 keV monthly light curves extracted from the 1-month integrated mosaic images and the monthly light curves obtained by rebinning the orbital light curves and summing up 8 energy bands over the full 14–195 keV range, we estimate that an additional statistical error contribution, , is needed to take into account the effects of correlated energy and time bins. The final statistical plus systematic error is given by .
In Fig. 1 five example light curves are presented with different signal-to-noise ratios and variability.

3 Hard X-ray variability properties
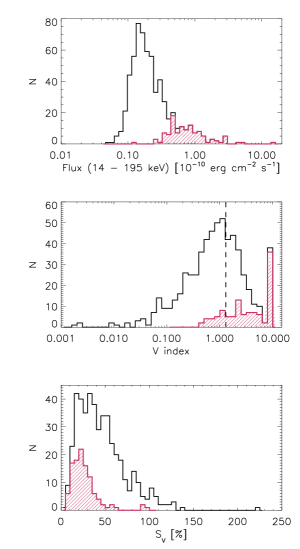
As an initial estimate of the variability of our AGN sample, we fit the 30-day binned light curves of the 613 AGN with a constant function, and apply a test. The variability index is defined as , where is the null hypothesis probability to obtain such a if the source were constant. For 36% of the light curves in the sample the fit to a constant intensity source results in (i.e., ; Paolillo et al. 2004; Lanzuisi et al. 2013), indicating that these objects exhibit significant variability (Fig. 2). In particular, 34% of the Seyfert galaxies are found to be variable against the 44% of the radio loud population. Among Seyfert galaxies, about 41% of type-2 objects show variability, contrary to only 29% of the type-1 objects.
3.1 Amplitude of the variations
Several methods can be used to quantify the amplitude of the variations in a light curve, e.g., excess variance or fractional variability amplitude (Vaughan et al., 2003; Ponti et al., 2004; Soldi et al., 2008). Almaini et al. (2000) proposed a numerical approach arguing that this is a more appropriate method in presence of non uniform measurement uncertainties, while recently Allevato et al. (2013) showed that it provides results equivalent to the normalized excess variance. The Almaini method is based on a maximum-likelihood estimate of the parameter, representing the variability of the light curve and which, in the case of constant measurement uncertainties (), reduces to the excess variance (). The parameter is defined so as to satisfy the following equation (see Almaini et al. 2000 and Beckmann et al. 2007a for more details):
| (1) |
where is the mean value of the light curve with measurement uncertainties . The maximum-likelihood estimator has been successfully used also in, e.g., Mateos et al. (2007) and in Chitnis et al. (2009). For continuity and comparison with Beckmann et al. (2007a), we choose to apply here the Almaini method. Unlike the original prescription, we use the weighted rather than the arithmetic mean to compute , because it provides in general more stable results, being less sensitive to the presence of outlier points. Yet, we verified that equivalent results are obtained in the two cases when analysing the final AGN sample presented here.
In order to compare the variability of different objects, we renormalize to the average flux of the source, obtaining the variability estimator (Fig. 2). Therefore, measures the amplitude of the intrinsic variability of a light curve, corrected by measurement uncertainties, renormalized to the average flux and in percentage units. Differently from Beckmann et al. (2007a), the systematic uncertainties deduced from the Crab and blank sky positions have already been included in the orbital light curves and therefore, no further correction to is required.
In computing the uncertainty is determined with a bootstrap technique (Simpson & Mayer-Hasselwander, 1986). For each object, 100,000 light curves are randomly drawn from the original one, with the same total number of points and allowing the same data point to be drawn more than once. The variability estimator is then computed for each simulated light curve and its frequency distribution built. The 15.9th and 84.1th percentiles of this distribution are taken as an estimate of the 1 confidence intervals (see also Vaughan et al. 2003). Due to the stochastic nature of variability, a further source of uncertainty is introduced by the uneven sampling of the light curves. This contribution can be understood as the dispersion of values measured on the same light curve on which different samplings are applied. We estimate this contribution with the bootstrap method but this time using the initial, unfiltered light curves (i.e., all having regular 30-day sampling). For each object, 10,000 light curves with points are randomly drawn from the original one, where is the number of points of the filtered light curve, and where every data point cannot be drawn more than once. The 15.9th and 84.1th percentiles of the frequency distribution are taken as an estimate of the 1 confidence intervals. The final uncertainty on is obtained by combining in quadrature and .
3.2 Sample selection
The final sample of 110 AGN is selected based on the following two criteria: 1) the average value of the signal-to-noise ratio of the points in the light curve is larger than 2; 2) can be measured for the given 30-day binned, filtered light curve, i.e., the uncertainties are smaller than the measurable intrinsic variability. The first criterion is essentially (but not exactly) equivalent to using a flux threshold of or a signal-to-noise ratio over the full light curve larger than 15, and it selects 115 sources (Fig. 2). The second criterion excludes only 5 additional sources. The filtering applied to the light curves (see Sect. 2) excludes no more than 22% (10% on average) of the data for the objects in the selected sample.444The values of computed on the filtered and unfiltered light curves are well compatible with an average scatter of for the selected sample, well within the estimated uncertainties on . On the other hand, for the BAT AGN excluded from the analysis the scatter is on average 4 times larger, further justifying our choice to limit the analysis to a sample of light curves for which the variability measurement is not so strongly influenced by single data points. The resulting sample is composed of 88 Seyfert galaxies (36 Seyfert 1, 17 of intermediate type, 32 Seyfert 2, and 3 Narrow Line Seyfert 1), 9 radio galaxies and 13 blazars. These sources cover a range of 14–195 keV fluxes between and (Fig. 2) and redshifts up to (see Fig. 1 in Soldi et al. 2012 for the redshift distribution of the sample). The non-blazar objects belong to the local AGN population with redshifts up to and an average value of (Table 1).
In Table Long-term variability of AGN at hard X-rays the values of are reported for the 110 AGN selected for the variability amplitude analysis. The blazar population shows a larger average variability () compared to the radio quiet objects (). A Kolmogorov-Smirnov test provides a probability that the blazar and Seyfert samples are not drawn from the same parent population. Yet, extreme cases of high variability are present in both the blazar and Seyfert classes. An average variability is in fact detected in the two gamma-ray bright blazars QSO B0033595 and Mrk 421 and in the Seyfert 2 galaxy 2MASX J044409032813003.
The radio galaxies present an intermediate behavior between blazars and Seyferts, with . Within the Seyfert class, intermediate and type 2 objects () are found to be only slightly more variable than type 1 (), and a KS-test probability indicates that the Seyfert 1 and Seyfert 1.5–2 samples could be drawn from the same parent distribution. Furthermore, no difference is found in the average variability of absorbed and unabsorbed Seyfert galaxies ( being the dividing line), with and .
The average properties of the different AGN classes are summarized in Table 1.
3.3 Black hole mass, hydrogen column density and Eddington ratio
In order to test the dependence of variability on different AGN parameters, we collected from the literature the values of black hole masses and hydrogen column density for our sample. The masses have been calculated with different methods, and when not available in the literature, the uncertainties on the values were estimated from the typical accuracy provided by the method following Beckmann et al. (2009). Out of the 110 objects, 92 have mass estimates (only an upper limit for MR 2251178; Table Long-term variability of AGN at hard X-rays), 86 have values, and for 23 only upper limits could be found.
For 63 objects (56 Seyferts, 4 radio galaxies and 3 blazars) we collected the bolometric luminosities from the literature, selecting those estimated from the fitting of the spectral energy distributions (Woo & Urry 2002; Vasudevan & Fabian 2007, 2009; Vasudevan et al. 2009, 2010; Table Long-term variability of AGN at hard X-rays). In order to estimate the bolometric luminosity from the X-ray one, constant corrections (Winter et al., 2009; Beckmann et al., 2009), and corrections depending on the luminosity (Marconi et al., 2004), on the Eddington ratio (Vasudevan & Fabian, 2007), on the spectral shape (Fabian et al., 2009), or on the intrinsic absorption (Vasudevan et al., 2010) have been proposed, but all fail to reproduce the large scatter of bolometric versus X-ray luminosity. However, in order to extend the sample for which we are able to compute the Eddington ratio, we also considered two of those bolometric corrections. The first one follows Beckmann et al. (2009), i.e., assumes that the bolometric luminosity is 2 times larger than the 1–200 keV luminosity, where for a simple power law spectrum with photon index . The second one is based on the relation provided by Marconi et al. (2004) to compute using a luminosity-dependent bolometric correction. Since these corrections allow to have estimates of for additional 29 objects (19 Seyfert) and they trace sufficiently well the bolometric luminosities computed from the SED fitting for our sample, we consider throughout the paper but compare the results to those obtained with X-ray based estimates on a larger sample. The Eddington ratio is then computed as , where .
4 Correlation analysis
In order to test for the dependence of the hard X-ray variability on the properties of the selected objects, we correlate the variability estimator with the X-ray luminosity , black hole mass , Eddington ratio , intrinsic hydrogen column density and spectral shape . We exclude from the correlation analysis the radio loud sources in order to have a uniform, local Seyfert sample for which it is not necessary to correct variability and luminosity for redshift and beaming effects, and for which the hard X-ray emission is dominated by accretion processes, with no jet contribution. In addition, the results for the Seyfert sample will be easily comparable to previous studies also focusing on radio quiet objects.
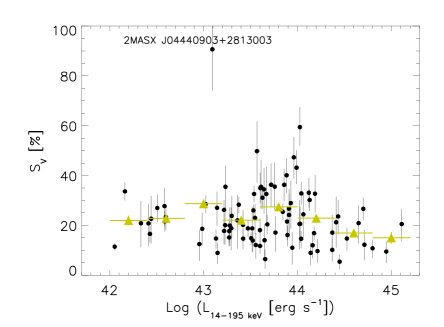
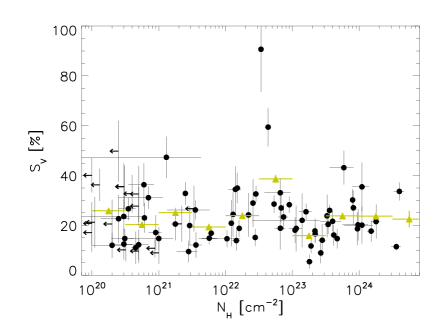
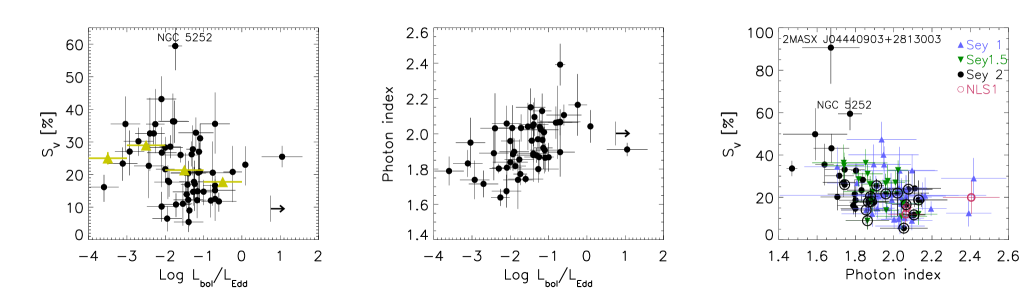
We do not find any significant correlation of with luminosity (Fig. 3) nor with absorption (Fig. 4). Variability appears to be marginally anti-correlated with Eddington ratio when using to compute , with a Spearman ranking correlation coefficient of corresponding to a probability for chance occurrence of (Fig. 5, left panel). However, the correlation disappears when using a larger sample and the X-ray based bolometric corrections to estimate . When fitting the versus Eddington ratio relation with a power law model, we find , which steepens to when excluding the 3 sources at super-Eddington rates.
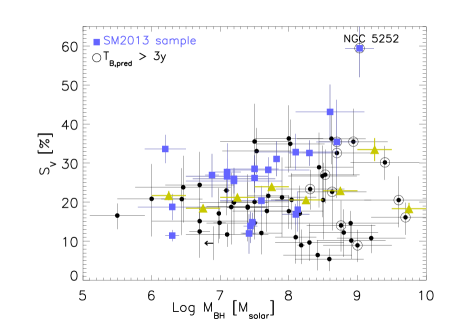
Unlike what is observed in the 2–10 keV band, we do not detect any anti-correlation between the 14–195 keV variability and the black hole mass (, ; Fig. 6). This is in agreement with what was found by Shimizu & Mushotzky (2013) on a smaller sample (squares in Fig. 6). On the other hand, Caballero-Garcia et al. (2012) reported a trend of decreasing variability with increasing black hole mass for the 5 brightest Seyfert galaxies at hard X-rays, with 20–50 keV BAT light curves rebinned to 2 days. However, when computing for the 2-days binned, 14–195 keV light curves as presented in our work for the same 5 sources, and applying a Spearman rank correlation test (more robust than the linear/Pearson correlation one; e.g., Press et al. 2007), we do not find any anti-correlation between variability and black hole mass (, ).
The lack of a anti-correlation is most likely due to the fact that the BAT survey samples time scales longer than the power density spectrum (PDS) break, . In fact, the X-ray PDS of AGN has a characteristic power law shape with index for long time scales and for times scales shorter than a source-dependent break time (typically of the order of hours to weeks; Uttley 2005; Arévalo et al. 2008a; Markowitz 2009, 2010; González-Martín & Vaughan 2012), which is found to scale with black hole mass and bolometric luminosity following the relation described by McHardy et al. (2006). This implies a scaling of the variability amplitude with the same AGN properties when time scales of the order or shorter than are considered. Above 15 keV the PDS obtained with BAT data on time scales of weeks to years show for 29 out of 30 objects a single power law with index (SM13), consistent with the 2–10 keV results and providing an upper limit of 26 days for the hard X-ray of these objects. However, if one assumed that is energy independent and can be estimated using the McHardy et al. (2006) relation, one would find that for 12 Seyferts in our sample is predicted to be larger than 3 years. This suggests the possibility that for those AGN BAT has measured the variability at frequencies above the PDS break, and that therefore a scaling of variability with black hole mass should be expected555For the majority of the objects in the SM13 sample (20 out of 23) is of the order or lower than 30 days, consistent with no detected by SM13 in the BAT time frequency range.. Yet, no correlation is detected (empty circles in Fig. 6). Recently, based on the 0.2–10 keV PDS analysis of 104 AGN and on the detection of a break in 15 of them, González-Martín & Vaughan (2012) recomputed the relation finding a weaker dependence on than in the McHardy et al. (2006) formulation. Therefore, considering the large uncertainties on the mass determination and bolometric luminosity estimate, and on the relation, it is not possible to derive from the above arguments whether or not this relation is also valid at hard X-rays.
5 Spectral variability
5.1 Variability, photon index and Eddington ratio
A significant anti-correlation is found between variability and photon index for Seyfert galaxies, in the sense that AGN with harder spectra are more variable (, , Fig. 5 right panel). The photon index used here is the result of a simple power law fit to the BAT spectrum. Even when excluding the objects with for which absorption might start to have a noticeable influence on the hard X-ray spectrum, the anti-correlation is still significant ().
A correlation is also identified between photon index and Eddington ratio (, ; Fig. 5 middle panel), similar to what is observed in the 2–10 keV band on year time scales (Sobolewska & Papadakis, 2009). The best fit to the data with a power law model results in ( when considering only sources with ). The correlation is significant also when using the X-ray bolometric corrections to compute . This relation has been suggested to origin from the geometry of the accretion flow, with stronger accreting objects having accretion disks whose inner radius is closer to the innermost circular stable orbit and therefore can cool more efficiently the hot corona, resulting in softer X-ray spectra (Sobolewska & Papadakis, 2009).
The marginal anti-correlation between variability and Eddington ratio (Fig. 5, left panel) could therefore be induced by the combination of the and ones ( for the total Seyfert sample).
5.2 Variability in the 14–24 and 35–100 keV bands
In order to compare the variability at different energies, we use the 30-day binned light curves in the 14–24 and 35–100 keV bands (see Table Long-term variability of AGN at hard X-rays). These energy bands have been selected to provide comparable significance for a typical hard X-ray AGN spectrum with power law shape and photon index .
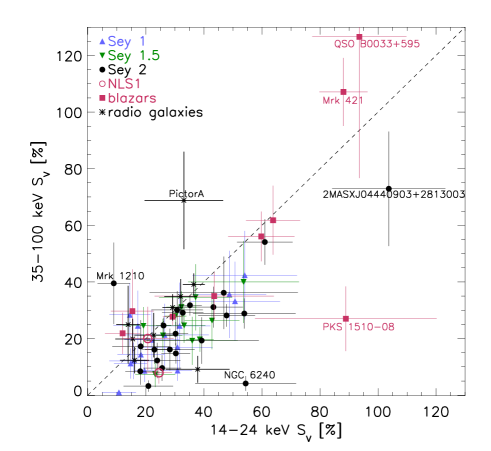
For a sample of 68 AGN (50 Seyferts, 9 radio galaxies, 9 blazars), we are able to estimate for the two selected bands (Fig. 7). In general, the variations are well correlated between the two bands (, ). However, there is an average 10% shift of the Seyfert population towards higher amplitude of the variations at lower energies, aside from a very few exceptions. A Kolmogorov-Smirnov test indicates a probability that the variations in the two energy bands are different for the 50 Seyferts in this subsample. This is also true when separating the sample into the 13 unabsorbed () and 26 absorbed objects: absorbed and unabsorbed sources show the same average variability amplitude, with the lower energy band presenting larger variability (, , , ). On the other hand, on average the 18 radio loud AGN do not display a significant dependence of variability on energy.
It is important to stress that the 14–24 and 35–100 keV bands have been selected specifically to have similar signal-to-noise ratio (SNR) for a typical AGN spectrum, therefore excluding the possibility that the behavior observed could be due to a bias introduced by the different uncertainties in the two bands. In fact, on average the difference between the SNR in the low- and high-energy band is 3% for the total sample ( for the Seyferts and 11% for the radio loud sources), with about half of the sample having a larger SNR in the high-energy band.
When testing the possibility that the additional variability in the lower energy band could be ascribed to variations of the intrinsic absorption, we find that large and frequent variations would be needed. In fact, if we consider a simple power law spectrum () with full-coverage absorption, variations of the order of would be necessary to produce flux variations of and . This would imply a 10% difference between the low- and high-energy flux variations within two observations and correspond to a contribution to the variability in the full band. However, in order to measure an increase in by 10% given our sampling baseline and rate, unrealistic large ( at least up to ) and frequent (on average over 50% of the light curve points) variations in the absorbing column would be required, and would imply even larger variations in the energy band . Even though variable absorbers are indeed common (Risaliti et al., 2002), such extreme variations are very rarely observed (see e.g., NGC 1365, Risaliti et al. 2007).
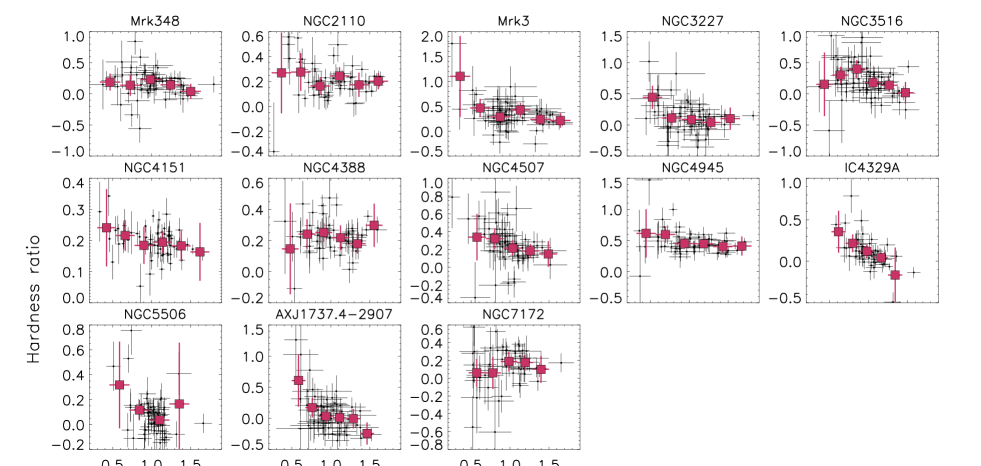
5.3 Hardness ratio versus flux
In order to compare the spectral variability within the single sources, for each object we compute the hardness ratio on month time scale, defined as:
| (2) |
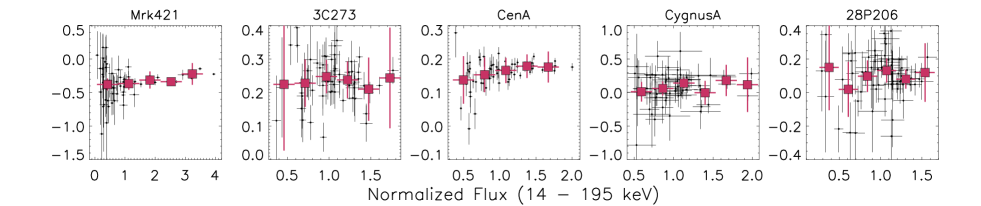
The dependence of on time is then fitted with a constant function, a test is applied, and the corresponding variability index is computed (as defined in Sect. 3). Based on this, we select a subsample of 18 objects for which , as those presenting spectral variability. These are mostly the brightest objects in the sample, with a few exceptions (e.g. MCG0523016, Circinus galaxy). The relatively low fraction of sources showing significant spectral variability is in agreement with the results presented by Mateos et al. (2007) who found spectral variability to be less common than flux variability on long time scales in the 0.2-12 keV band. In Fig. 8 the hardness ratios as a function of flux (normalized to the mean flux of each object) are presented. For 8 Seyferts there is a clear trend of spectral softening when the source brightens (Mrk 3, NGC 3516, NGC 4151, NGC 4507, NGC 4945, IC 4329A, NGC 5506, AX J1737.42907), while for the other radio quiet objects no significant correlation is detected. Our results are in agreement with those reported by Caballero-Garcia et al. (2012) for NGC 4945, NGC 2110 and IC 4329, while different trends are observed for NGC 4388 and NGC 4151. This is possibly due to the different energy bands used to compute (20–50 and 50–100 keV in Caballero-Garcia et al. 2012).
There is no correlation between flux and spectral variations for radio loud objects, with the exception of Mrk 421 and Cen A, which exhibit a marginal spectral hardening with increasing flux. Cen A has been observed to present a harder-when-brighter spectrum also during Suzaku observations (Fukazawa et al., 2011). This behavior has been interpreted as due to the increased contribution in the brighter state of a hard tail produced in the jet.
6 Discussion
6.1 Variability of the different AGN classes
Radio loud objects show larger amplitudes of the variations compared to Seyfert galaxies, as expected if their hard X-ray emission is dominated by the extreme processes taking place in a relativistic jet (e.g., Lichti et al. 2008), while hard X-ray emission from Seyfert galaxies is instead dominated by thermal Comptonization. This is even more evident considering that the variability of higher redshift blazars (4 out of 13 objects have ) will actually increase when taking into account the effect of cosmological time dilation. Among radio loud objects, the radio galaxies seem to show rather intermediate variability amplitudes between the blazars and the radio quiet class, in agreement with the idea that the jet and the coronal emissions are probably both contributing. This makes it difficult to disentangle the relative importance of these components in the hard X-ray spectra of radio galaxies, as for example shown in Centaurus A (Beckmann et al., 2011), 3C 111 (de Jong et al., 2012), as well as in other radio galaxies (Grandi et al., 2006).
Among Seyfert galaxies, there are indications for type 1.5–2 objects to be slightly more variable than type 1, as found already at hard X-rays in Beckmann et al. (2007a). A similar behavior has been reported by Saxton et al. (2011) when studying long-term X-ray variability properties of a sample of more than 1000 AGN detected by ROSAT and within the XMM-Newton slew survey. Following their study, the Seyfert 2 class has the highest fraction of sources with large variability in the 0.2–2 keV range, but it is not clear if the observed variability is due to changes in the line-of-sight column density, or it is rather intrinsic to the central engine. On the other hand, while in Beckmann et al. (2007a) there was a tentative trend of more absorbed sources being more variable, here we do not observe any correlation between variability and absorption column density. Therefore, the global properties of variability as a function of AGN class point to a general agreement with the basic formulation of AGN unification models, in which the differences are driven in first approximation only by AGN orientation and by the presence or absence of a relativistic jet.
Within our sample, there are 3 NLS1 galaxies, a class which is known to show peculiar characteristics in the soft X-ray domain, like a steep spectral continuum, and strong and fast variability. Most of these distinctive properties of NLS1s have been interpreted in the context of relatively small black hole masses undergoing rapid evolution, powered by higher accretion rates than their broad line equivalent (Peterson et al., 2000). The average hard X-ray photon index of the NLS1 in our sample is indeed slightly larger than for the rest of the Seyfert class (, ), as derived also from INTEGRAL observations on 14 NLS1s (Ricci et al., 2011b; Panessa et al., 2011). On the other hand, the average variability amplitude is consistent with what is observed for broad line Seyfert 1 (). Even though our NLS1 sample is too small to draw any firm conclusion, the discrepancy between the soft and hard X-rays results could be due to the different time scales probed in these studies: while NLS1s do show strong variability on short time scales, on long time scales above the PDS time break, their timing characteristics do not differ significantly from those of the general type-1 Seyfert population. This is in agreement with Saxton et al. (2011), who found substantially the same long-term variability in narrow and broad line Seyfert 1 within their 0.2–2 keV survey study.
6.2 Long-term variability, luminosity and black hole mass
Due to the rather long time-scales probed by BAT, the anti-correlations of variability with luminosity (Barr & Mushotzky, 1986; Green et al., 1993; Papadakis, 2004) and with black hole mass (Papadakis & McHardy, 1995; Zhou et al., 2010; Kelly et al., 2011, 2013; Ponti et al., 2012) often observed below 10 keV on short time scales are not detected in our hard X-ray study (Figs. 3 and 6). This is in agreement with results obtained in the soft X-ray band when year time scales are investigated. For example, Saxton et al. (2011) did not find any relation between long-term variability and luminosity when studying a 0.2–2 keV AGN sample, and argued that this is expected since the sampled time scales are substantially longer than the typical PDS break times of AGN. Moreover, Markowitz & Edelson (2004) analysed a sample of 27 AGN with ASCA and RXTE data in the 2–12 keV energy range. Even though they do detect anti-correlations between variability and luminosity and variability and black hole mass on day time scales, the significance of these relations decreases when studying longer time scales (a month to years) as well as the slope of the linear fit to the data approaches zero, indicating that on long time scales there is no anti-correlation observed. Zhang (2011) used RXTE/ASM data, monitoring 27 AGN for about 14 years in the 1.5–12 keV band. The excess variance computed on the 300-day binned light curves does not correlate with the black hole mass. The author argues that this points to AGN being in a high/soft state rather than in a low/hard state, based on an analogy with Galactic black holes (GBH) when solely their timing behavior is considered. In fact, PDS of GBHs in low/hard state are observed to present a second break at even lower time frequencies, and therefore if a similar behavior has to be expected from AGN, a mass dependence of the excess variance should be observed also on long time scales, which is instead not detected.
Finally, considering that the BAT PDS on long time scales appear to have a slope consistent with (SM13), computed in this time frequency range is proportional to the PDS normalization. Therefore, the lack of correlation between and and indicates that the PDS normalization does not seem to scale with black hole mass nor luminosity. Moreover, the average variability for Seyfert galaxies is with 68% of the objects having values in the range . The total variability range is smaller by a factor of with respect to the range measured on shorter time scales by Ponti et al. (2012) in the 2–10 keV energy band. This suggests that the BAT , and therefore the normalization of the PDS on long time scales, could be very similar in all local Seyfert galaxies.
6.3 Spectral variability
A significant correlation is detected between variability in the 14–24 and 35–100 keV energy ranges, with Seyfert galaxies being on average more variable in the lower energy band (Fig. 7). The detected correlation suggests that the same process is likely to be at the origin of the variability in the two bands. Moreover, the presence of such large average variations, even in the 35–100 keV range, is incompatible with hard X-ray variability being entirely due to variations of the hydrogen column density along the line of sight. In fact, as an indication, a variation of would imply only a 3% variation of the 35–100 keV flux. Yet, a limited fraction of the additional variability observed at lower (14–24 keV) energies could be due to absorption variations.
Several studies have detected decreasing variability with increasing X-ray energies in the 0.2–12 keV band, either through excess variance or PDS amplitude (e.g., Nandra 2001; McHardy et al. 2004; Markowitz & Edelson 2004; Ponti 2007; Ponti et al. 2012), and both on short () and long time scales (). The same finding extends to hard X-ray energies, with the 14–24 keV band showing on average larger variations than the 35–100 keV one in Seyfert galaxies. A similar result has been obtained by Chitnis et al. (2009) when comparing the 1.5–12 keV RXTE/ASM variability to that measured in the 14–195 keV band by BAT. Shimizu & Mushotzky (2013) did not detect an energy dependence of the PDS parameters for the 3 Seyferts for which this investigation was possible, but the corresponding excess variance (computed using the PDS parameters) decreases through the 14–24, 24–50 and 50–150 keV bands they studied. If for observations below 10 keV changes of the amount of the absorbing material or of its ionisation could play a role (Risaliti et al., 2002; Ponti et al., 2012), in the BAT band such mechanisms are unlikely to be able to fully explain the observed properties.
The variations could instead originate directly at the X-ray source. For example, if a power law spectrum pivots at energies keV, the 14–24 keV flux would be expected to vary more strongly than the 35–100 keV one (Gierliński & Zdziarski, 2005). If we assume a standard Comptonization model based on a two-phase accretion disk (Haardt & Maraschi, 1993), the hard X-ray variability could be driven by changes of the seed photon flux (Nandra et al., 2000; Arévalo et al., 2005) or by physical variations in the corona (temperature and optical depth; Nicastro et al. 2000; Lubiński et al. 2010). Petrucci et al. (2000) point out that in order to have a pivoting point at high energies an increase of the cooling is required rather than a decrease of the heating, that would instead determine a low-energy pivoting point.
In addition, the superposition of two components, one constant (e.g., the reflected continuum) and the other one variable (for example the Comptonized continuum) could further contribute to the observed spectral variations (Shih et al., 2002; Markowitz & Edelson, 2004; Ponti et al., 2006; Papadakis et al., 2009; Sobolewska & Papadakis, 2009). In the 14–24 keV and 35–100 keV bands the contribution of reflection to the observed flux is about 30–40% for a reflection fraction and typical AGN spectra with , , and a high-energy cut-off at . For such spectra, a larger contribution from reflection is measured in the total 35–100 keV flux compared to the 14–24 keV one, but only by a few percents. Therefore, reflection alone cannot fully explain the difference observed in the two hard X-ray bands, even though a contribution from it is expected.
The scenario of a pivoting spectrum superposed to a constant reflection is in general also consistent with a steepening of the hard X-ray spectrum when the source brightens. This is indeed observed for the majority of the Seyferts in our sample that show some spectral variability (Fig. 8) and follows an established trend observed in the X-ray emission of numerous local radio quiet AGN (Markowitz & Edelson, 2004; Sobolewska & Papadakis, 2009; Caballero-Garcia et al., 2012) and also in higher-redshift objects (Paolillo et al., 2004). Within the Comptonization frame, the softer-when-brighter behavior can be understood if an increase of the seed photon power illuminating the corona determines a more efficient cooling of the hot electrons, with a resulting drop of the coronal temperature, which causes the X-ray spectrum to steepen.
The correlation between Eddington ratio and photon index is another known property of AGN samples below 10 keV (Sobolewska & Papadakis, 2009) and it is confirmed by our study at hard X-rays (Fig. 5, middle panel), in agreement with Middleton et al. (2008) who suggested this relation to explain possible differences in hard X-ray spectral slopes for different AGN classes.
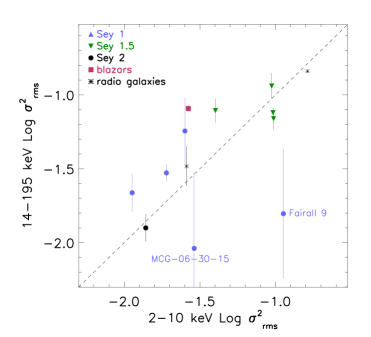
A different behavior arises when comparing the hard X-ray to the soft X-ray variability. We collected from the literature the PDS parameters for 13 AGN in our sample, i.e., those objects with measured soft X-ray PDS and with detected frequency break (González-Martín & Vaughan 2012, SM13, and references therein). We compare the normalized excess variance in the 14–195 keV band to the 2–10 keV one, computed by extrapolating the soft X-ray PDS to low frequencies in order to cover the same time-scales as the BAT data set, i.e. between and . The variability amplitude at hard X-rays is found to be equal or larger than that in the soft X-rays (Fig. 9). This is consistent with what has been found by Caballero-Garcia et al. (2012) and Shimizu & Mushotzky (2013), yet it is surprising, as it seems to be an opposite trend to those observed within the soft and hard X-rays bands alone. One reason could be that, when extrapolating the 2–10 keV PDS to year time-scales, the uncertainties on the measurement of the PDS slope introduce a large scatter in the estimated excess variance. Indeed, for 6 out of 13 objects the low-frequency PDS slope has been fixed to (from González-Martín & Vaughan 2012). Slightly steeper slopes by would imply a comparable or larger variability at soft rather than at hard X-rays.
If instead the hard X-rays are indeed more variable than the soft X-rays on long time scales, this might indicate an even more complex dependence of variability with energy. The difference between soft and hard X-ray variability could be, for example, related to the size of the emitting region. If the high-energy plasma is located inside the accretion disk or above its inner part (Zdziarski et al., 1999; Lubiński et al., 2010), while the low-energy emitting region is associated to some outflow from the disk or a second plasma with lower temperature (Petrucci et al., 2013), then the high-energy emission could be more variable than the lower-energy emission. However, the change in relative dominance of the two components would have to happen exactly at energies of 10–15 keV. In addition, it would be necessary to explain why within the soft and hard X-ray bands this trend is inverted, with the higher-energy emission being in general less variable than the lower-energy emission.
6.3.1 Variability and photon index anti-correlation
Another interesting difference compared to the lower energies and lower time frequencies is the trend of harder sources being more variable at hard X-rays (Fig. 5, right panel). In fact, several papers report the opposite trend of softer sources being more variable on time scales of the order or below a day, even though with different degrees of confidence. O’Neill et al. (2005) found a marginal correlation between photon index and excess variance, while Green et al. (1993) and Grupe et al. (2001) found a more significant correlation in the 1–8 keV (EXOSAT) and 0.2–2 keV band (ROSAT), respectively. One has to keep in mind though that a contribution from absorption variations could be important in the ROSAT data. The largest soft X-ray sample for this kind of study has been presented by Ponti et al. (2012). They confirm the correlation between excess variance and photon index, which they ascribe to the the fact that accretion rate correlates with both variability and photon index in their sample. On the contrary, at hard X-rays and low time frequency, it seems more likely that the correlation between accretion rate and photon index and the anti-correlation between photon index and variability are at the origin of the marginal anti-correlation between accretion rate and variability (Fig. 5).
The photon index versus variability anti-correlation is instead commonly observed in Galactic black holes (GBH), which show larger variability during the hard state, i.e., when the corona rather than the accretion disk emission is believed to dominate the X-ray spectrum (e.g., Muñoz-Darias et al. 2011). Moreover, a decreasing variability with the softening of the spectrum is detected in the so-called hard-intermediate state, when the less variable accretion disk component starts contributing to the X-ray spectrum of GBHs (Belloni et al., 2011). This might indicate that the larger variability in the harder BAT sources could be associated to their stronger Comptonization.
The anti-correlation between variability and photon index in our sample could be, at least partly, induced by the effect of different reflection fractions. On one hand, if one assumes that the bulk of reflection is mostly constant, objects with larger reflection would be expected to be less variable. Constant or slowly variable reflection components observed in a number of objects have been explained either due to a distant reflector, with light travel time damping out variability (e.g., Miller et al. 2008, Bianchi et al. 2009), or as a consequence of strong gravitational light bending in the close vicinity of the black hole (e.g., Miniutti & Fabian 2004, Ponti et al. 2006, Miniutti et al. 2007). On the other hand, there are indications that objects with larger reflection have softer X-ray spectra. In fact, Zdziarski et al. (1999) reported a strong correlation indicating that intrinsically softer sources have larger reflection fractions, possibly due to the reflector being also the source of seed photons for the Comptonization emission. In addition to this effect, when fitting with a simple power law model spectra with different reflection strengths and the same intrinsic continuum, the measured photon index in the 14–195 keV band results steeper for larger reflection, with (depending on the intrinsic continuum shape and on the position of the high-energy spectral turnover) for a reflection fraction changing from 0 to 2. Reflection fractions might be the result of peculiar geometries (causing, e.g., high covering factors; Malzac 2001), of light bending effects in the vicinity of the black hole (Miniutti & Fabian, 2004), or of a variable continuum combined with a delayed answer of the reflected component, due to the distance of the reflector (Malzac & Petrucci, 2002).
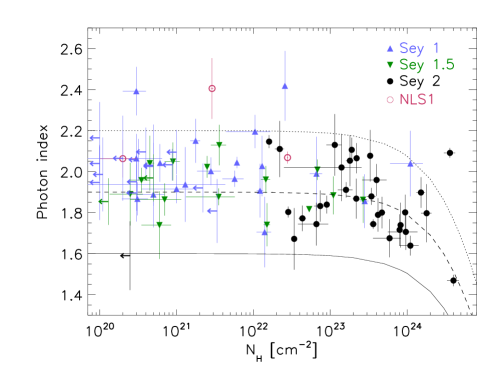
When the accretion disk is considered as the main reflector, a larger reflection component is expected from face-on compared to edge-on AGN. Indeed, when dividing our sample into the different AGN classes, Seyfert 1 appear at the higher end of the photon index distribution, consistent with larger reflection being associated to softer spectra. Furthermore, Ricci et al. (2011b) and Vasudevan et al. (2013) have recently shown that objects with absorption in the range present a stronger reflection component than those at lower . When looking at the distribution of photon indexes as a function of , sources in the range have a softer spectrum than the rest of the Seyfert 2 population and comparable to the average Seyfert 1 one (Fig. 10), possibly pointing out a stronger reflection component. We note that the photon index drop at cannot be simply explained by the fact that our fitting does not take into account absorption. In fact, when simulating absorbed spectra and fitting them with a simple power law, the measured photon index decreases much less dramatically as a function of then observed in the data (see lines in Fig. 10).
However, caution should be used considering that for highly absorbed sources simple absorption models fail to correctly reproduce the spectra in presence of large reprocessed emission (Lubinski et al. in preparation, Yaqoob 2012, Braito et al. 2013), and that stacked spectra might be influenced by the effects of combining objects with different spectral shapes contributing with varying weight to the different energy bands. In addition, the validity of the correlation reported by Zdziarski et al. (1999) is still debated. Some later studies confirmed this relation (Mattson et al., 2007; Dadina, 2008; Winter et al., 2012) whereas others did not (Molina et al., 2009; de Rosa et al., 2012), pointing out the difficulty in disentangling a real physical relation from the degeneracies between photon index, reflection and high-energy cut-off in the commonly used X-ray fitting models (Mattson et al., 2007; Winter et al., 2012).
An alternative explanation could come from a similar trend observed in NGC 7469 (Nandra & Papadakis, 2001), which presented a higher excess variance when the spectrum of the source
was harder. Nandra & Papadakis (2001) suggest that this and other timing properties of this AGN could be explained if the inner regions of the corona are hotter than the outer ones.
The hard X-ray emission would then be produced in the innermost parts of the corona and therefore, be more variable and on shorter time scales than the soft X-ray one,
produced in the larger and cooler outer zone.
However, these results are based on a 30 days long observation at 15 keV, hence the time scales and energies are different than those of our work.
Similarly, in the model first proposed by Lyubarskii (1997) and then reconsidered by others (Churazov et al., 2001; Arévalo & Uttley, 2006), different variability patterns at different
energies and on different time scales are explained with accretion disk fluctuations propagating inward and illuminating a corona with emissivity gradient,
which would therefore modulate the X-ray source.
7 Conclusions
We have characterized the 14–195 keV variability of the largest sample of hard X-ray selected AGN provided by Swift/BAT up to date. The amplitude of the variations has been quantified and their dependence on energy and on basic AGN properties, such as black hole mass, luminosity, Eddington ratio and intrinsic absorption, has been investigated. The average characteristics of hard X-ray variability are in general agreement with the unified models, indicating larger variability in jetted sources and no clear dependence of the variations on AGN orientation. The amplitude of the hard X-ray variations and its spectral properties indicate that variability cannot be driven by absorption variations. On the other hand for radio quiet AGN it is rather consistent with changes of a power law continuum over a constant component, with the power law pivoting around . Such variations of the continuum emission would be achieved for example with a change in the corona temperature, determining a shift of the high-energy cut-off at hard X-rays, either due to intrinsic coronal variations or to a change in the seed photon flux.
In general, variability at hard X-rays has very similar properties to that in the softer X-ray band, when similar time scales are compared, compatible with variability being driven by the same mechanism across the full X-ray band. However, some discrepancies, like AGN with harder spectra being more variable and the apparent lower variability in the 2–10 keV band, could be ascribed to additional components in either band (e.g., reflection, absorption), and in any case could provide interesting insights on the intrinsic differences of the emission in the soft and hard X-ray bands, as for example concerning the emitting regions and their sizes.
The lack of dependence of the long-term variability on black hole mass and luminosity, and the relatively narrow range of variability measured in Seyfert galaxies suggest that the normalization of the X-ray power spectrum is independent on black hole mass and luminosity and might have a similar value for all local Seyfert galaxies.
Thanks to the Swift/BAT on-going observations it will be possible to further extend the studied time scales and increase the available AGN sample, obtaining the best hard X-ray AGN variability sample for some time to go. At the same time, pointed observations with Suzaku, INTEGRAL and NuSTAR will continue to investigate the spectral variability in bright and well studied AGN as already successfully done in a number of sources (Reeves et al., 2007; Itoh et al., 2008; Terashima et al., 2009; Fukazawa et al., 2011; Beckmann et al., 2007b; Soldi et al., 2010, 2011b; Lubiński et al., 2010).
Acknowledgements.
The authors thank Jerome Rodriguez for useful discussions on Galactic black holes, and the anonymous referee for the valuable suggestions that helped to improve this paper. SS acknowledges the Centre National d’Etudes Spatiales (CNES) for financial support. GP acknowledges support via an EU Marie Curie Intra-European fellowship under contract no. FP-PEOPLE-2012-IEF-331095. This work has been partly supported by the LabEx UnivEarthS666http://www.univearths.fr/en project “Impact of black holes on their environment”, and by the Polish NCN grants N N203 581240 and 2012/04/M/ST9/00780. This article commemorates our colleague Jack Tueller who passed away during the study.References
- Allevato et al. (2013) Allevato, V., Paolillo, M., Papadakis, I., & Pinto, C. 2013, ApJ, 771, 9
- Almaini et al. (2000) Almaini, O., Lawrence, A., Shanks, T., et al. 2000, MNRAS, 315, 325
- Arévalo et al. (2008a) Arévalo, P., McHardy, I. M., & Summons, D. P. 2008a, MNRAS, 388, 211
- Arévalo et al. (2005) Arévalo, P., Papadakis, I., Kuhlbrodt, B., & Brinkmann, W. 2005, A&A, 430, 435
- Arévalo & Uttley (2006) Arévalo, P. & Uttley, P. 2006, MNRAS, 367, 801
- Arévalo et al. (2008b) Arévalo, P., Uttley, P., Kaspi, S., et al. 2008b, MNRAS, 389, 1479
- Barr & Mushotzky (1986) Barr, P. & Mushotzky, R. F. 1986, Nature, 320, 421
- Barthelmy et al. (2005) Barthelmy, S. D., Barbier, L. M., Cummings, J. R., et al. 2005, Space Sci. Rev., 120, 143
- Baumgartner et al. (2013) Baumgartner, W. H., Tueller, J., Markwardt, C. B., et al. 2013, ApJS, 207, 19
- Beckmann et al. (2007a) Beckmann, V., Barthelmy, S. D., Courvoisier, T. J.-L., et al. 2007a, A&A, 475
- Beckmann et al. (2008) Beckmann, V., Courvoisier, T. J.-L., Gehrels, N., et al. 2008, A&A, 492, 93
- Beckmann et al. (2007b) Beckmann, V., Gehrels, N., & Tueller, J. 2007b, ApJ, 666, 122
- Beckmann et al. (2011) Beckmann, V., Jean, P., Lubiński, P., Soldi, S., & Terrier, R. 2011, A&A, 531, A70
- Beckmann & Shrader (2012) Beckmann, V. & Shrader, C. R. 2012, Active Galactic Nuclei, Wiley–VCH
- Beckmann et al. (2009) Beckmann, V., Soldi, S., Ricci, C., et al. 2009, A&A, 505, 417
- Bell et al. (2011) Bell, M. E., Tzioumis, T., Uttley, P., et al. 2011, MNRAS, 411, 402
- Belloni et al. (2011) Belloni, T. M., Motta, S. E., & Muñoz-Darias, T. 2011, Bulletin of the Astronomical Society of India, 39, 409
- Bian & Gu (2007) Bian, W. & Gu, Q. 2007, ApJ, 657, 159
- Bianchi et al. (2009) Bianchi, S., Piconcelli, E., Chiaberge, M., et al. 2009, ApJ, 695, 781
- Braito et al. (2013) Braito, V., Ballo, L., Reeves, J. N., et al. 2013, MNRAS, 428, 2516
- Breedt et al. (2010) Breedt, E., McHardy, I. M., Arévalo, P., et al. 2010, MNRAS, 403, 605
- Caballero-Garcia et al. (2012) Caballero-Garcia, M. D., Papadakis, I. E., Nicastro, F., & Ajello, M. 2012, A&A, 537, A87
- Chatterjee et al. (2011) Chatterjee, R., Marscher, A. P., Jorstad, S. G., et al. 2011, ApJ, 734, 43
- Chitnis et al. (2009) Chitnis, V. R., Pendharkar, J. K., Bose, D., et al. 2009, ApJ, 698, 1207
- Churazov et al. (2001) Churazov, E., Gilfanov, M., & Revnivtsev, M. 2001, MNRAS, 321, 759
- Cusumano et al. (2010) Cusumano, G., La Parola, V., Segreto, A., et al. 2010, A&A, 524, A64
- Czerny et al. (2001) Czerny, B., Nikołajuk, M., Piasecki, M., & Kuraszkiewicz, J. 2001, MNRAS, 325, 865
- Dadina (2008) Dadina, M. 2008, A&A, 485, 417
- de Jong et al. (2012) de Jong, S., Beckmann, V., & Mattana, F. 2012, A&A, 545, A90
- De Marco et al. (2013) De Marco, B., Ponti, G., Cappi, M., et al. 2013, MNRAS, 431, 2441
- de Rosa et al. (2012) de Rosa, A., Panessa, F., Bassani, L., et al. 2012, MNRAS, 420, 2087
- de Rosa et al. (2007) de Rosa, A., Piro, L., Perola, G. C., et al. 2007, A&A, 463, 903
- Denney et al. (2010) Denney, K. D., Peterson, B. M., Pogge, R. W., et al. 2010, ApJ, 721, 715
- Fabian et al. (2009) Fabian, A. C., Vasudevan, R. V., Mushotzky, R. F., Winter, L. M., & Reynolds, C. S. 2009, MNRAS, 394, L89
- Fukazawa et al. (2011) Fukazawa, Y., Hiragi, K., Yamazaki, S., et al. 2011, ApJ, 743, 124
- Gehrels et al. (2004) Gehrels, N., Chincarini, G., Giommi, P., et al. 2004, ApJ, 611, 1005
- Gierliński & Zdziarski (2005) Gierliński, M. & Zdziarski, A. A. 2005, MNRAS, 363, 1349
- González-Martín & Vaughan (2012) González-Martín, O. & Vaughan, S. 2012, A&A, 544, A80
- Grandi et al. (2006) Grandi, P., Malaguti, G., & Fiocchi, M. 2006, ApJ, 642, 113
- Green et al. (1993) Green, A. R., McHardy, I. M., & Lehto, H. J. 1993, MNRAS, 265, 664
- Greenhill et al. (2003) Greenhill, L. J., Booth, R. S., Ellingsen, S. P., et al. 2003, ApJ, 590, 162
- Grier et al. (2012) Grier, C. J., Peterson, B. M., Pogge, R. W., et al. 2012, ApJ, 755, 60
- Grupe et al. (2001) Grupe, D., Thomas, H.-C., & Beuermann, K. 2001, A&A, 367, 470
- Haardt & Maraschi (1993) Haardt, F. & Maraschi, L. 1993, ApJ, 413, 507
- Harmon et al. (2004) Harmon, B. A., Wilson, C. A., Fishman, G. J., et al. 2004, ApJS, 154, 585
- Itoh et al. (2008) Itoh, T., Done, C., Makishima, K., et al. 2008, PASJ, 60, 251
- Kaspi et al. (2007) Kaspi, S., Brandt, W. N., Maoz, D., et al. 2007, ApJ, 659, 997
- Kelly et al. (2011) Kelly, B. C., Sobolewska, M., & Siemiginowska, A. 2011, ApJ, 730, 52
- Kelly et al. (2013) Kelly, B. C., Treu, T., Malkan, M., Pancoast, A., & Woo, J.-H. 2013, arXiv:1307.5253
- Körding et al. (2007) Körding, E. G., Migliari, S., Fender, R., et al. 2007, MNRAS, 380, 301
- Krimm et al. (2013) Krimm, H. A., Holland, S. T., Corbet, R. H. D., et al. 2013, ApJS, 209, 14
- Lanzuisi et al. (2013) Lanzuisi, G., Ponti, G., Salvato, M., et al. 2013, submitted to A&A
- Lichti et al. (2008) Lichti, G. G., Bottacini, E., Ajello, M., et al. 2008, A&A, 486, 721
- Lu & Yu (2001) Lu, Y. & Yu, Q. 2001, MNRAS, 324, 653
- Lubiński et al. (2010) Lubiński, P., Zdziarski, A. A., Walter, R., et al. 2010, MNRAS, 408, 1851
- Lyubarskii (1997) Lyubarskii, Y. E. 1997, MNRAS, 292, 679
- Malizia et al. (2008) Malizia, A., Bassani, L., Bird, A. J., et al. 2008, MNRAS, 389, 1360
- Malzac (2001) Malzac, J. 2001, MNRAS, 325, 1625
- Malzac & Petrucci (2002) Malzac, J. & Petrucci, P.-O. 2002, MNRAS, 336, 1209
- Marconi et al. (2004) Marconi, A., Risaliti, G., Gilli, R., et al. 2004, MNRAS, 351, 169
- Markowitz (2009) Markowitz, A. 2009, ApJ, 698, 1740
- Markowitz (2010) Markowitz, A. 2010, ApJ, 724, 26
- Markowitz & Edelson (2004) Markowitz, A. & Edelson, R. 2004, ApJ, 617, 939
- Mateos et al. (2007) Mateos, S., Barcons, X., Carrera, F. J., et al. 2007, A&A, 473, 105
- Mattson et al. (2007) Mattson, B. J., Weaver, K. A., & Reynolds, C. S. 2007, ApJ, 664, 101
- McHardy (2010) McHardy, I. 2010, in Lecture Notes in Physics, Berlin Springer Verlag, ed. T. Belloni, Vol. 794, 203, arXiv:0909.2579
- McHardy et al. (2007) McHardy, I., Lawson, A., Newsam, A., et al. 2007, MNRAS, 375, 1521
- McHardy et al. (2006) McHardy, I. M., Koerding, E., Knigge, C., Uttley, P., & Fender, R. P. 2006, Nature, 444, 730
- McHardy et al. (2004) McHardy, I. M., Papadakis, I. E., Uttley, P., Page, M. J., & Mason, K. O. 2004, MNRAS, 348, 783
- Mehdipour et al. (2011) Mehdipour, M., Branduardi-Raymont, G., Kaastra, J. S., et al. 2011, A&A, 534, A39
- Middleton et al. (2008) Middleton, M., Done, C., & Schurch, N. 2008, MNRAS, 383, 1501
- Miller et al. (2008) Miller, L., Turner, T. J., & Reeves, J. N. 2008, A&A, 483, 437
- Miniutti & Fabian (2004) Miniutti, G. & Fabian, A. C. 2004, MNRAS, 349, 1435
- Miniutti et al. (2007) Miniutti, G., Fabian, A. C., Anabuki, N., et al. 2007, PASJ, 59, 315
- Molina et al. (2009) Molina, M., Bassani, L., Malizia, A., et al. 2009, MNRAS, 399, 1293
- Muñoz-Darias et al. (2011) Muñoz-Darias, T., Motta, S., & Belloni, T. M. 2011, MNRAS, 410, 679
- Nandra (2001) Nandra, K. 2001, in Astronomical Society of the Pacific Conference Series, Vol. 224, Probing the Physics of Active Galactic Nuclei, ed. B. M. Peterson, R. W. Pogge, & R. S. Polidan, 167
- Nandra et al. (2000) Nandra, K., Le, T., George, I. M., et al. 2000, ApJ, 544, 734
- Nandra & Papadakis (2001) Nandra, K. & Papadakis, I. E. 2001, ApJ, 554, 710
- Nicastro et al. (2000) Nicastro, F., Piro, L., De Rosa, A., et al. 2000, ApJ, 536, 718
- Nikolajuk et al. (2004) Nikolajuk, M., Papadakis, I. E., & Czerny, B. 2004, MNRAS, 350, L26
- O’Neill et al. (2005) O’Neill, P. M., Nandra, K., Papadakis, I. E., & Turner, T. J. 2005, MNRAS, 358, 1405
- Padovani & Rafanelli (1988) Padovani, P. & Rafanelli, P. 1988, A&A, 205, 53
- Panessa et al. (2011) Panessa, F., de Rosa, A., Bassani, L., et al. 2011, MNRAS, 417, 2426
- Paolillo et al. (2004) Paolillo, M., Schreier, E. J., Giacconi, R., Koekemoer, A. M., & Grogin, N. A. 2004, ApJ, 611, 93
- Papadakis (2004) Papadakis, I. E. 2004, MNRAS, 348, 207
- Papadakis & McHardy (1995) Papadakis, I. E. & McHardy, I. M. 1995, MNRAS, 273, 923
- Papadakis et al. (2009) Papadakis, I. E., Sobolewska, M., Arevalo, P., et al. 2009, A&A, 494, 905
- Peterson et al. (2000) Peterson, B. M., McHardy, I. M., Wilkes, B. J., et al. 2000, ApJ, 542, 161
- Petrucci et al. (2000) Petrucci, P. O., Haardt, F., Maraschi, L., et al. 2000, ApJ, 540, 131
- Petrucci et al. (2013) Petrucci, P.-O., Paltani, S., Malzac, J., et al. 2013, A&A, 549, A73
- Pian et al. (2006) Pian, E., Foschini, L., Beckmann, V., et al. 2006, A&A, 449, L21
- Pian et al. (2011) Pian, E., Ubertini, P., Bazzano, A., et al. 2011, A&A, 526, A125
- Ponti (2007) Ponti, G. 2007, PhD thesis, Università di Bologna
- Ponti et al. (2004) Ponti, G., Cappi, M., Dadina, M., & Malaguti, G. 2004, A&A, 417, 451
- Ponti et al. (2006) Ponti, G., Miniutti, G., Cappi, M., et al. 2006, MNRAS, 368, 903
- Ponti et al. (2012) Ponti, G., Papadakis, I., Bianchi, S., et al. 2012, A&A, 542, A83
- Press et al. (2007) Press, W. H., Teukolsky, S. A., Vetterling, W. T., & Flannery, B. P. 2007, Numerical recipes: The art of scientific computing
- Reeves et al. (2007) Reeves, J. N., Awaki, H., Dewangan, G. C., et al. 2007, PASJ, 59, 301
- Reis et al. (2012) Reis, R. C., Fabian, A. C., Reynolds, C. S., et al. 2012, ApJ, 745, 93
- Ricci et al. (2011a) Ricci, C., Paltani, S., Soldi, S., & Courvoisier, T. J. L. 2011a, in Fast X-ray Timing and Spectroscopy at Extreme Count Rates (HTRS 2011), arXiv:1106.3997
- Ricci et al. (2011b) Ricci, C., Walter, R., Courvoisier, T. J.-L., & Paltani, S. 2011b, A&A, 532, A102
- Risaliti et al. (2007) Risaliti, G., Elvis, M., Fabbiano, G., et al. 2007, ApJ, 659, L111
- Risaliti et al. (2002) Risaliti, G., Elvis, M., & Nicastro, F. 2002, ApJ, 571, 234
- Saxton et al. (2011) Saxton, R., Read, A., Esquej, P., Miniutti, G., & Alvarez, E. 2011, in Narrow-Line Seyfert 1 Galaxies and their Place in the Universe
- Shemmer et al. (2003) Shemmer, O., Uttley, P., Netzer, H., & McHardy, I. M. 2003, MNRAS, 343, 1341
- Shih et al. (2002) Shih, D. C., Iwasawa, K., & Fabian, A. C. 2002, MNRAS, 333, 687
- Shimizu & Mushotzky (2013) Shimizu, T. T. & Mushotzky, R. F. 2013, ApJ, 770, 60, SM13
- Simpson & Mayer-Hasselwander (1986) Simpson, G. & Mayer-Hasselwander, H. 1986, A&A, 162, 340
- Sobolewska & Papadakis (2009) Sobolewska, M. A. & Papadakis, I. E. 2009, MNRAS, 399, 1597
- Soldi et al. (2012) Soldi, S., Baumgartner, W., Beckmann, V., et al. 2012, in Proceedings of ”An INTEGRAL view of the high-energy sky (the first 10 years)” (INTEGRAL 2012)
- Soldi et al. (2011a) Soldi, S., Beckmann, V., Gehrels, N., de Jong, S., & Lubiński, P. 2011a, in Narrow-Line Seyfert 1 Galaxies and their Place in the Universe, arXiv:1105.5993
- Soldi et al. (2011b) Soldi, S., Beckmann, V., Gehrels, N., et al. 2011b, in proceedings of the 8th INTEGRAL Workshop “The Restless Gamma-ray Universe”, arXiv:1102.4959
- Soldi et al. (2010) Soldi, S., Ponti, G., Beckmann, V., & Lubinski, P. 2010, in proceedings of the “The Extreme sky: Sampling the Universe above 10 keV” conference, arXiv:1001.4348
- Soldi et al. (2008) Soldi, S., Türler, M., Paltani, S., et al. 2008, A&A, 486, 411
- Stalin et al. (2011) Stalin, C. S., Jeyakumar, S., Coziol, R., Pawase, R. S., & Thakur, S. S. 2011, MNRAS, 416, 225
- Terashima et al. (2009) Terashima, Y., Gallo, L. C., Inoue, H., et al. 2009, PASJ, 61, 299
- Tueller et al. (2010) Tueller, J., Baumgartner, W. H., Markwardt, C. B., et al. 2010, ApJS, 186, 378
- Uttley (2005) Uttley, P. 2005, in proceedings of the “AGN Variability from X-Rays to Radio Waves” conference, arXiv:0501157
- Uttley et al. (2002) Uttley, P., McHardy, I. M., & Papadakis, I. E. 2002, MNRAS, 332, 231
- Vasudevan & Fabian (2007) Vasudevan, R. V. & Fabian, A. C. 2007, MNRAS, 381, 1235
- Vasudevan & Fabian (2009) Vasudevan, R. V. & Fabian, A. C. 2009, MNRAS, 392, 1124
- Vasudevan et al. (2010) Vasudevan, R. V., Fabian, A. C., Gandhi, P., Winter, L. M., & Mushotzky, R. F. 2010, MNRAS, 402, 1081
- Vasudevan et al. (2013) Vasudevan, R. V., Mushotzky, R. F., & Gandhi, P. 2013, ApJ, 770, L37
- Vasudevan et al. (2009) Vasudevan, R. V., Mushotzky, R. F., Winter, L. M., & Fabian, A. C. 2009, MNRAS, 399, 1553
- Vaughan et al. (2003) Vaughan, S., Edelson, R., Warwick, R. S., & Uttley, P. 2003, MNRAS, 345, 1271
- Wilson-Hodge et al. (2011) Wilson-Hodge, C. A., Cherry, M. L., Case, G. L., et al. 2011, ApJ, 727, L40
- Winter et al. (2009) Winter, L. M., Mushotzky, R. F., Reynolds, C. S., & Tueller, J. 2009, ApJ, 690, 1322
- Winter et al. (2012) Winter, L. M., Veilleux, S., McKernan, B., & Kallman, T. R. 2012, ApJ, 745, 107
- Woo & Urry (2002) Woo, J.-H. & Urry, C. M. 2002, ApJ, 579, 530
- Yaqoob (2012) Yaqoob, T. 2012, MNRAS, 423, 3360
- Zdziarski et al. (1999) Zdziarski, A. A., Lubiński, P., & Smith, D. A. 1999, MNRAS, 303, L11
- Zhang (2011) Zhang, Y.-H. 2011, ApJ, 726, 21
- Zhou et al. (2010) Zhou, X.-L., Zhang, S.-N., Wang, D.-X., & Zhu, L. 2010, ApJ, 710, 16
- Zoghbi et al. (2010) Zoghbi, A., Fabian, A. C., Uttley, P., et al. 2010, MNRAS, 401, 2419
| Type | ||||||
|---|---|---|---|---|---|---|
| [] | [%] | [%] | [%] | |||
| Sey 1 | 0.033 (36) | 6.4 0.8 | 2.01 0.02 | 16.5 0.9 | 21 2 (15) | 13 2 |
| Sey 1.5 | 0.017 (17) | 10 2 | 1.92 0.03 | 24 1 | 32 2 (11) | 23 2 |
| Sey 2 | 0.016 (32) | 10 1 | 1.86 0.03 | 19.9 0.7 | 28 1 (22) | 16.2 0.9 |
| NLS1 | 0.019 (3) | 11 6 | 2.2 0.1 | 15 3 | 24 4 (2) | 9 4 |
| unabs Sey | 0.031 (41) | 6.7 0.7 | 2.00 0.02 | 18.5 0.8 | 25 2 (23) | 17 2 |
| abs Sey | 0.016 (46) | 10 1 | 1.90 0.03 | 19.7 0.6 | 28 1 (26) | 16.4 0.8 |
| CT Sey | 0.011 (6) | 13 4 | 1.8 0.1 | 16 1 | 37 6 (4) | 9 1 |
| all Sey | 0.023 (88) | 8.5 0.8 | 1.95 0.02 | 19.3 0.5 | 26.9 0.9 (50) | 16.7 0.7 |
| radio galaxies | 0.033 (9) | 22 12 | 2.1 0.2 | 24 1 | 26 2 (9) | 26 2 |
| blazars/quasars | 0.855 (13) | 7 3 | 2.0 0.2 | 33 2 | 36 2 (9) | 35 2 |
longtablel c c c c c c c
Variability estimator , black hole mass and bolometric luminosity for the selected Swift/BAT AGN sample.
Source name Type
[ c/s/det] [%] [%] [%] [] []
\endfirstheadcontinued.
Source name Type
[ c/s/det] [%] [%] [%] [] []
\endhead\endfootQSO B0033595 BLLac 0.60
… …
NGC 235A Sey1 0.74
…
Mrk 348 Sey2 2.56
46.4f
Fairall 9 Sey1 0.84
44.9o
NGC 526A Sey1.5 0.91
…
NGC 612 NLRG 0.76
…
ESO 297018 Sey2 1.01
44.2j
NGC 788 Sey2 1.19
44.3f
LEDA 138501 Sey1 0.88
… …
NGC 931 Sey1.5 1.07
44.5f
HB89 0241622 Sey1 1.38
… …
NGC 1142 Sey2 1.31
44.8j
NGC 1275 RG 1.65
45.0f
NGC 1365 Sey1.8 1.09
43.8j
ESO 548G081 Sey1 0.68
44.0j
3C 111.0 RG 1.91
…
3C 120 RG 1.56
45.3f
UGC 03142 Sey1 0.77
… …
2MASX J044409032813003 Sey2 0.81
… …
1RXS J045205.0493248 Sey1 1.03
45.0d
2MASX J050545752351139 Sey2 0.87
…
IRAS 050781626 Sey1.5 1.50
…
Ark 120 Sey1 1.07
44.9f
ESO 36218 Sey1.5 0.76
…
PICTOR A BLRG 0.63
…
PKS 052136 BLLac 0.52
…
PKS 0548322 BLLac 0.55
…
NGC 2110 Sey2 4.77
44.1f
MCG 0811011 Sey1.5 2.15
45.0j
2MASX J055802063820043 Sey1 0.60
…
IRAS 055892828 Sey1 1.14
… 44.7d
Mrk 3 Sey2 1.86
44.5f
Mrk 6 Sey1.5 0.93
44.3j
Mrk 79 Sey1.2 0.75
44.6f
2MASS J075941813843560 Sey1.2 0.82
…
Mrk 1210 Sey2 0.91
…
Fairall 272 Sey2 0.64
…
…
HB89 0836710 blazar 0.90
…
MCG 0124012 Sey2 0.70
…
MCG 0422042 Sey1.2 0.63
44.5d
Mrk 110 NLS1 0.94
44.7f
MCG 0523016 Sey2 3.44
…
NGC 3081 Sey2 1.28
…
NGC 3227 Sey1.5 1.81
43.9f
NGC 3281 Sey2 1.37
44.2j
Mrk 421 BLLac 3.17
…
NGC 3516 Sey1.5 1.77
44.3f
NGC 3783 Sey1 2.84
44.4f
UGC 06728 Sey1.2 0.51
44.3d
2MASX J114540451827149 Sey1 0.86
…
LEDA 38038 Sey2 0.85
… …
NGC 4151 Sey1.5 8.06
43.7f
NGC 4388 Sey2 4.01
43.7j
3C 273 quasar 6.23
47.1o
NGC 4507 Sey2 2.85
44.3j
ESO 506G027 Sey2 1.28
44.6j
NGC 4593 Sey1 1.40
44.1f
WKK 1263 Sey1.5 0.72
44.3d
SBS 1301540 Sey1 0.52
44.9d
NGC 4945 Sey2 3.48
…
ESO 323077 Sey1.2 0.73
…
Cen A RG 20.40
…
MCG 0630015 Sey1.2 1.26
44.1d
NGC 5252 Sey2 1.65
45.4f
4U 134460 Sey1.5 1.67
44.1j
IC 4329A Sey1.2 4.82
44.8f
Mrk 279 Sey1.5 0.63
45.0o
Circinus Galaxy Sey2 4.54
…
NGC 5506 NLS1 4.12
44.1j
NGC 5548 Sey1.5 1.19
44.8f
ESO 511G030 Sey1 0.76
44.4j
NGC 5728 Sey2 1.35
43.7j
Mrk 841 Sey1 0.64
45.8f
PKS 151008 quasar 0.83
46.4f
VII Zw 653 Sey1.2 0.87
…
…
Mrk 1498 Sey1.9 0.74
45.3j
2MASX J164815233035037 Sey1 0.77
… …
NGC 6240 Sey2 1.06
… …
Mrk 501 BLLac 0.89
…
1RXS J165605.6520345 Sey1.2 0.69
…
2MASS J165616773302127 blazar 0.87
… …
NGC 6300 Sey2 1.65
42.9j
AX J1737.42907 Sey1 1.96
…
IC 4709 Sey2 0.66
… …
PKS 183021 FSRQ 1.04
… …
3C 382 Sey1 1.47
45.6o
ESO 103035 Sey2 1.88
44.6j
3C 390.3 BLRG 1.69
44.9f
Fairall 51 Sey1 0.70
…
NGC 6814 Sey1.5 1.19
43.9f
Cygnus A RG 2.13
45.7j
QSO B1959650 BLLac 0.69
…
MCG 0448002 Sey2 1.13
… …
4C 74.26 Sey1 0.87
46.2f
Mrk 509 Sey1.2 1.60
45.0f
IC 5063 Sey2 1.07
44.5f
2MASX J211401288204483 Sey1 0.55
45.5j
28P 206 RG 3.20
… …
SWIFT J212745.6565636 NLS1 0.73
…
6dF J2132022334254 Sey1 0.72
… …
PKS 2149306 FSRQ 1.07
… …
NGC 7172 Sey2 2.63
43.8j
NGC 7213 Sey1.5 0.68
44.3f
NGC 7314 Sey1 0.80
43.0j
3C 454.3 FSRQ 1.74
47.3f
MR 2251178 Sey1 1.67
45.8o
NGC 7469 Sey1 1.10
45.3f
Mrk 926 Sey1.5 1.81
…
NGC 7582 Sey2 1.21
43.3j
NGC 7603 Sey1.5 0.82
44.7f
888The variability estimator is computed in the 14–195 keV (), 14–24 keV (), and 35–100 keV ()
bands. is the average count rate in the full 14–195 keV band. The bolometric luminosities have been estimated from the fitting of the spectral energy
distribution (see Sect. 3.3).
a Winter et al. (2009);
b Beckmann et al. (2009) and references therein;
c Grier et al. (2012);
d Vasudevan et al. (2009);
e Stalin et al. (2011);
f Woo & Urry (2002);
g Bian & Gu (2007);
h Kaspi et al. (2007);
i Denney et al. (2010);
j Vasudevan et al. (2010);
k Nikolajuk et al. (2004);
l Greenhill et al. (2003);
m Padovani & Rafanelli (1988);
n Malizia et al. (2008);
o Vasudevan & Fabian (2007).