New Results from the T2K Experiment: Observation of Appearance in a Beam
Abstract:
The T2K Experiment has observed the appearance of electron neutrinos in a muon-neutrino beam. Twenty eight neutrino candidates pass the selection cuts with a predicted background of 4.640.53 events, which corresponds to a 6.8 exclusion of . When comparing the hypothesis to the best fit of the full electron momentum and angle distribution, is excluded at 7.5 for and . In addition, results from the T2K disappearance analysis have also been updated to improve the treatment of full 3-flavor oscillations.
The phenomenon of neutrino oscillation has been well established experimentally. However, the explicit transformation of one neutrino flavor to another particular flavor has never before been conclusively observed. Using a dataset corresponding to 6.39 protons on target (POT), the T2K experiment has made the first observation of neutrino appearance via the oscillation channel.
The T2K neutrino beam is generated using a 30 GeV proton beam produced at J-PARC. Charged pions and kaons are produced in interactions of the beam with a graphite target that is embedded within the first of three magnetic focusing horns, and are then allowed to decay in a 100 m drift volume to produce the neutrino beam. The results presented in this update were made possible due to the efforts of the J-PARC accelerator division and the operators of the neutrino beamline. In 2013, stable running at 220 kW was achieved, including a world-record 1.2 protons per pulse, which allowed T2K to more than double the 3.01 POT used in the previous T2K appearance measurement [1].
T2K measures the unoscillated neutrino flux at a near detector complex (ND280) located 280 m downstream of the neutrino production target. Since the previous T2K electron appearance measurement [1], the calibration, reconstruction, Monte Carlo simulation (MC), and analysis of the near detector data have all been significantly improved. Many of these improvements affect the matching of tracks found in the ND280 time projection chambers (TPCs) to hits in the Fine-Grained Detectors (FGDs), which serve as the neutrino targets. If the matching terminates prematurely for an external track passing through the FGD, the track will be incorrectly reconstructed as having originated within the FGD. This out-of-fiducial-volume background was the largest detector systematic uncertainty in many of the muon momentum bins in the previous analysis.
To mitigate these issues, a more precise treatment of the detector material was implemented, as well as an improved treatment of high-angle tracks. Improvements were made to the TPC reconstruction to reduce the sensitivity to delta rays, which can induce spurious rotations in the reconstructed TPC trajectories. Improvements to the reconstruction to handle variations in the TPC drift velocity were introduced, and the monitoring and stability of the drift velocity were enhanced. These improvements reduced the systematic uncertainty associated with out-of-fiducial-volume events from the 1-3% range, depending on the muon momentum, to below 1% for all momenta above 400 MeV/c. Below 400 MeV/c, these events remain the dominant detector systematic uncertainty, but the size of the error is reduced relative to the previous analysis. Above 400 MeV/c, the largest detector uncertainty is due to uncertainties in pion hadronic interaction cross sections.
The charged-current (CC) interactions used to constrain the neutrino energy spectrum and cross section parameters are selected using the same criteria as the previous T2K analysis [1]. The muon is identified as the highest-momentum, negative-curvature track that emerges from the FGD fiducial volume and has an energy deposit in the TPC immediately downstream of the FGD that is consistent with a muon. Tracks found in the TPC upstream of the FGD are used to veto external backgrounds.
The previous analysis divided the CC sample into a ”CCQE-like” sample and a ”CCnonQE-like” sample. The CCQE-like sample was the subset of the CC sample which contained only a single TPC-FGD track and no late time energy deposit in FGD1 consistent with an electron from a decay chain. All other CC events were placed in the CCnonQE-like sample. These two samples were then simultaneously fit to the data. With the addition of the Run 3 data, this previous near detector analysis was limited by systematic uncertainties. Run 3 increased the POT for which near detector data were collected from 0.96 to 2.56. However, these additional data only provided a reduction in the uncertainty in the far detector event rate prediction from 5.7% to 4.7% for sin of 0.1. In particular, the fit had limited ability to constrain the cross section parameters associated with CC interactions, since the CCnonQE-like sample had a CC purity of only 29%.
To improve the near detector constraint, the current analysis now incorporates three samples: CC0, CC1, and CCother. These samples are defined based on the number of pions found in the final state. A can be identified in one of three ways: a TPC2+FGD1 track with a TPC charge deposition consistent with a pion, a late-time energy deposit consistent with a decay electron in FGD1, or a track fully contained within FGD1 with an FGD charge deposition consistent with a pion. To tag a , only negative curvature TPC2+FGD1 tracks are used, since fully-contained FGD1 tracks do not allow for sign selection. A is identified if there exists a track in TPC2 with a charge deposition consistent with an electron. Events containing no pions are placed in the CC0 sample, events with exactly one and no or are classified as CC1, and all other CC events are placed in the CCother sample. With these criteria, the resulting purities of the CC0, CC1, and CCother samples are 72.6%, 49.4%, and 73.8%, respectively.
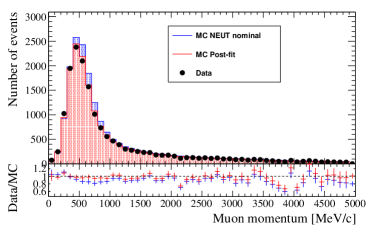
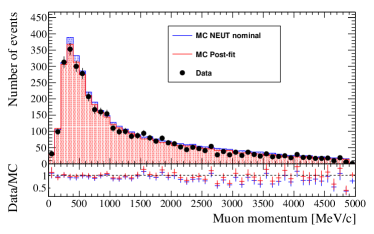
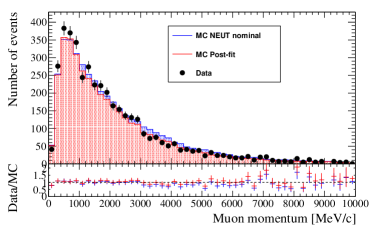
When the near detector constraint is extracted using the same Run 1-3 data as the previous analysis, but with the new CC0, CC1, and CCother samples, the uncertainty on the far detector event rate is reduced from 4.7% to 3.5% for sin of 0.1, sin of 1.0, and of 0. Adding the Run 4 data further reduces the far detector event rate uncertainty to 3.0%. The momentum distributions for each of the three event samples before and after the near detector constraint is applied are shown in Figure 1.
The analysis of the data from the T2K far detector, Super-Kamiokande, has also been improved. A new method for reconstructing particle kinematics has been used for the first time in this analysis. This new algorithm is a maximum likelihood fit, based on the mathematical formalism developed by MiniBooNE [2], that calculates charge and time probability density functions (PDFs) for every photomulitplier tube (PMT) for any given choice of the initial particle parameters. These PDFs are calculated by integrating the light contributed by each segment of the particle trajectory. Particle identification is achieved by separately performing a fit for several different particle hypotheses, and then comparing the resulting best-fit likelihood values. Multiple-particle fit hypotheses, such as the two-photon fit, are constructed by combining the charge and time PDFs for each particle in the final state. Combined charge PDFs are created by summing the charge contributions from each particle, and the combined time PDFs are the weighted average of the individual particle PDFs based on the distance to the PMT. By using the same likelihood framework for both single- and multiple-particle final states, the resulting fit likelihoods can be directly compared to determine the final event topology.
Most of the event selection continues to use the previously-existing Super-K reconstruction, and is unchanged relative to the previous T2K result [1]. Events with entering or exiting particles are vetoed by requiring less than 16 hits in all hit clusters in the outer-detector, and the reconstructed vertex in the inner-detector is required to be at least 2 m from the nearest wall. For the selection, only events with a single, electron-like ring with an energy greater than 100 MeV are accepted, and events with late-time signals consistent with a stopped muon or pion decay are rejected to further reduce -induced background.
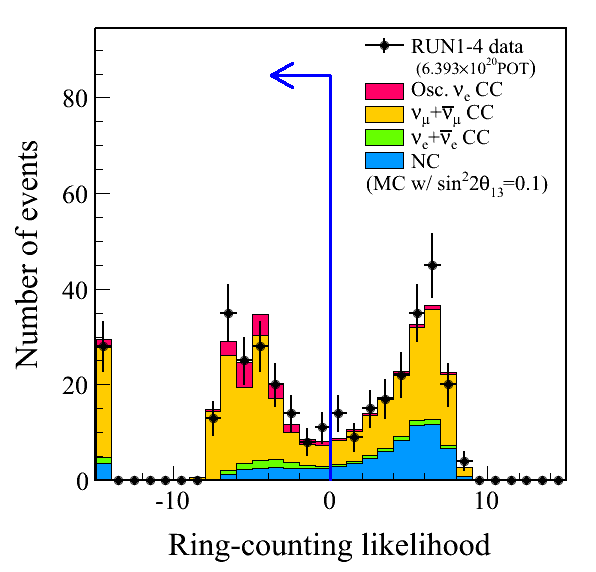
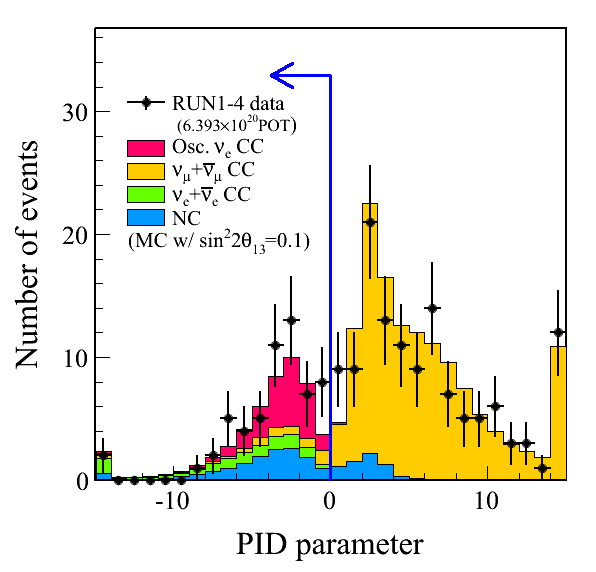
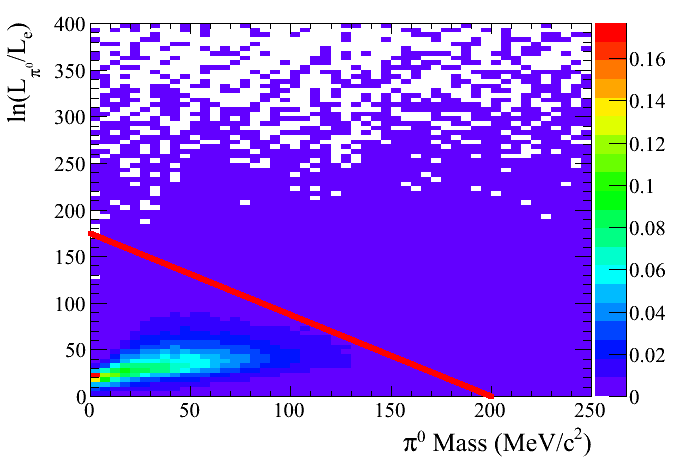
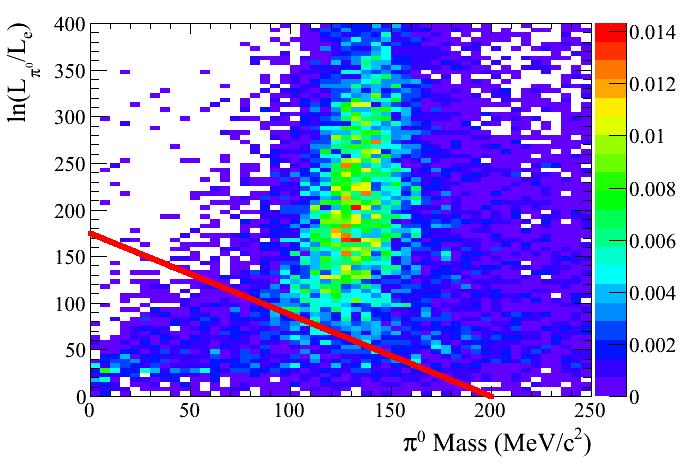
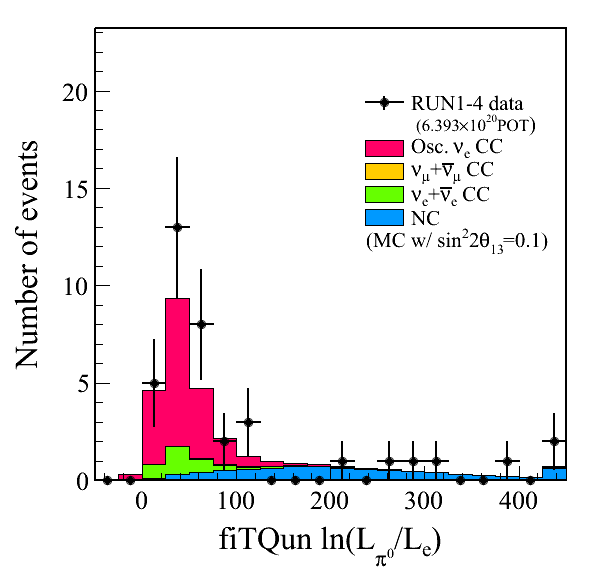
The final step in the event selection now uses the new reconstruction algorithm to remove additional background. The cut uses two variables: the reconstructed two-photon mass from the fit, and the ratio of the best-fit likelihoods from the fit and the single-ring electron-hypothesis fit, . The distributions of both the signal CC- and the background containing a are shown in Figure 3. A linear cut in this two-dimensional space, defined as (MeV/c2), is used to select the signal. This cut removes 70% of the background that was allowed in the previous analysis with only a 2% decrease in the signal efficiency. This improvement to the background rejections improves the sensitivity for rejecting from 5.0 to 5.5. The final event sample contains 28 events in the data with a predicted background of events and an expected signal sample of for sin, sin, , and normal neutrino mass hierarchy.
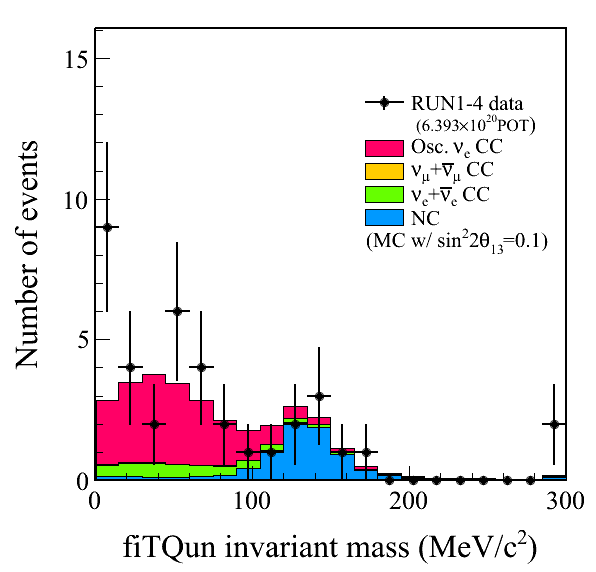
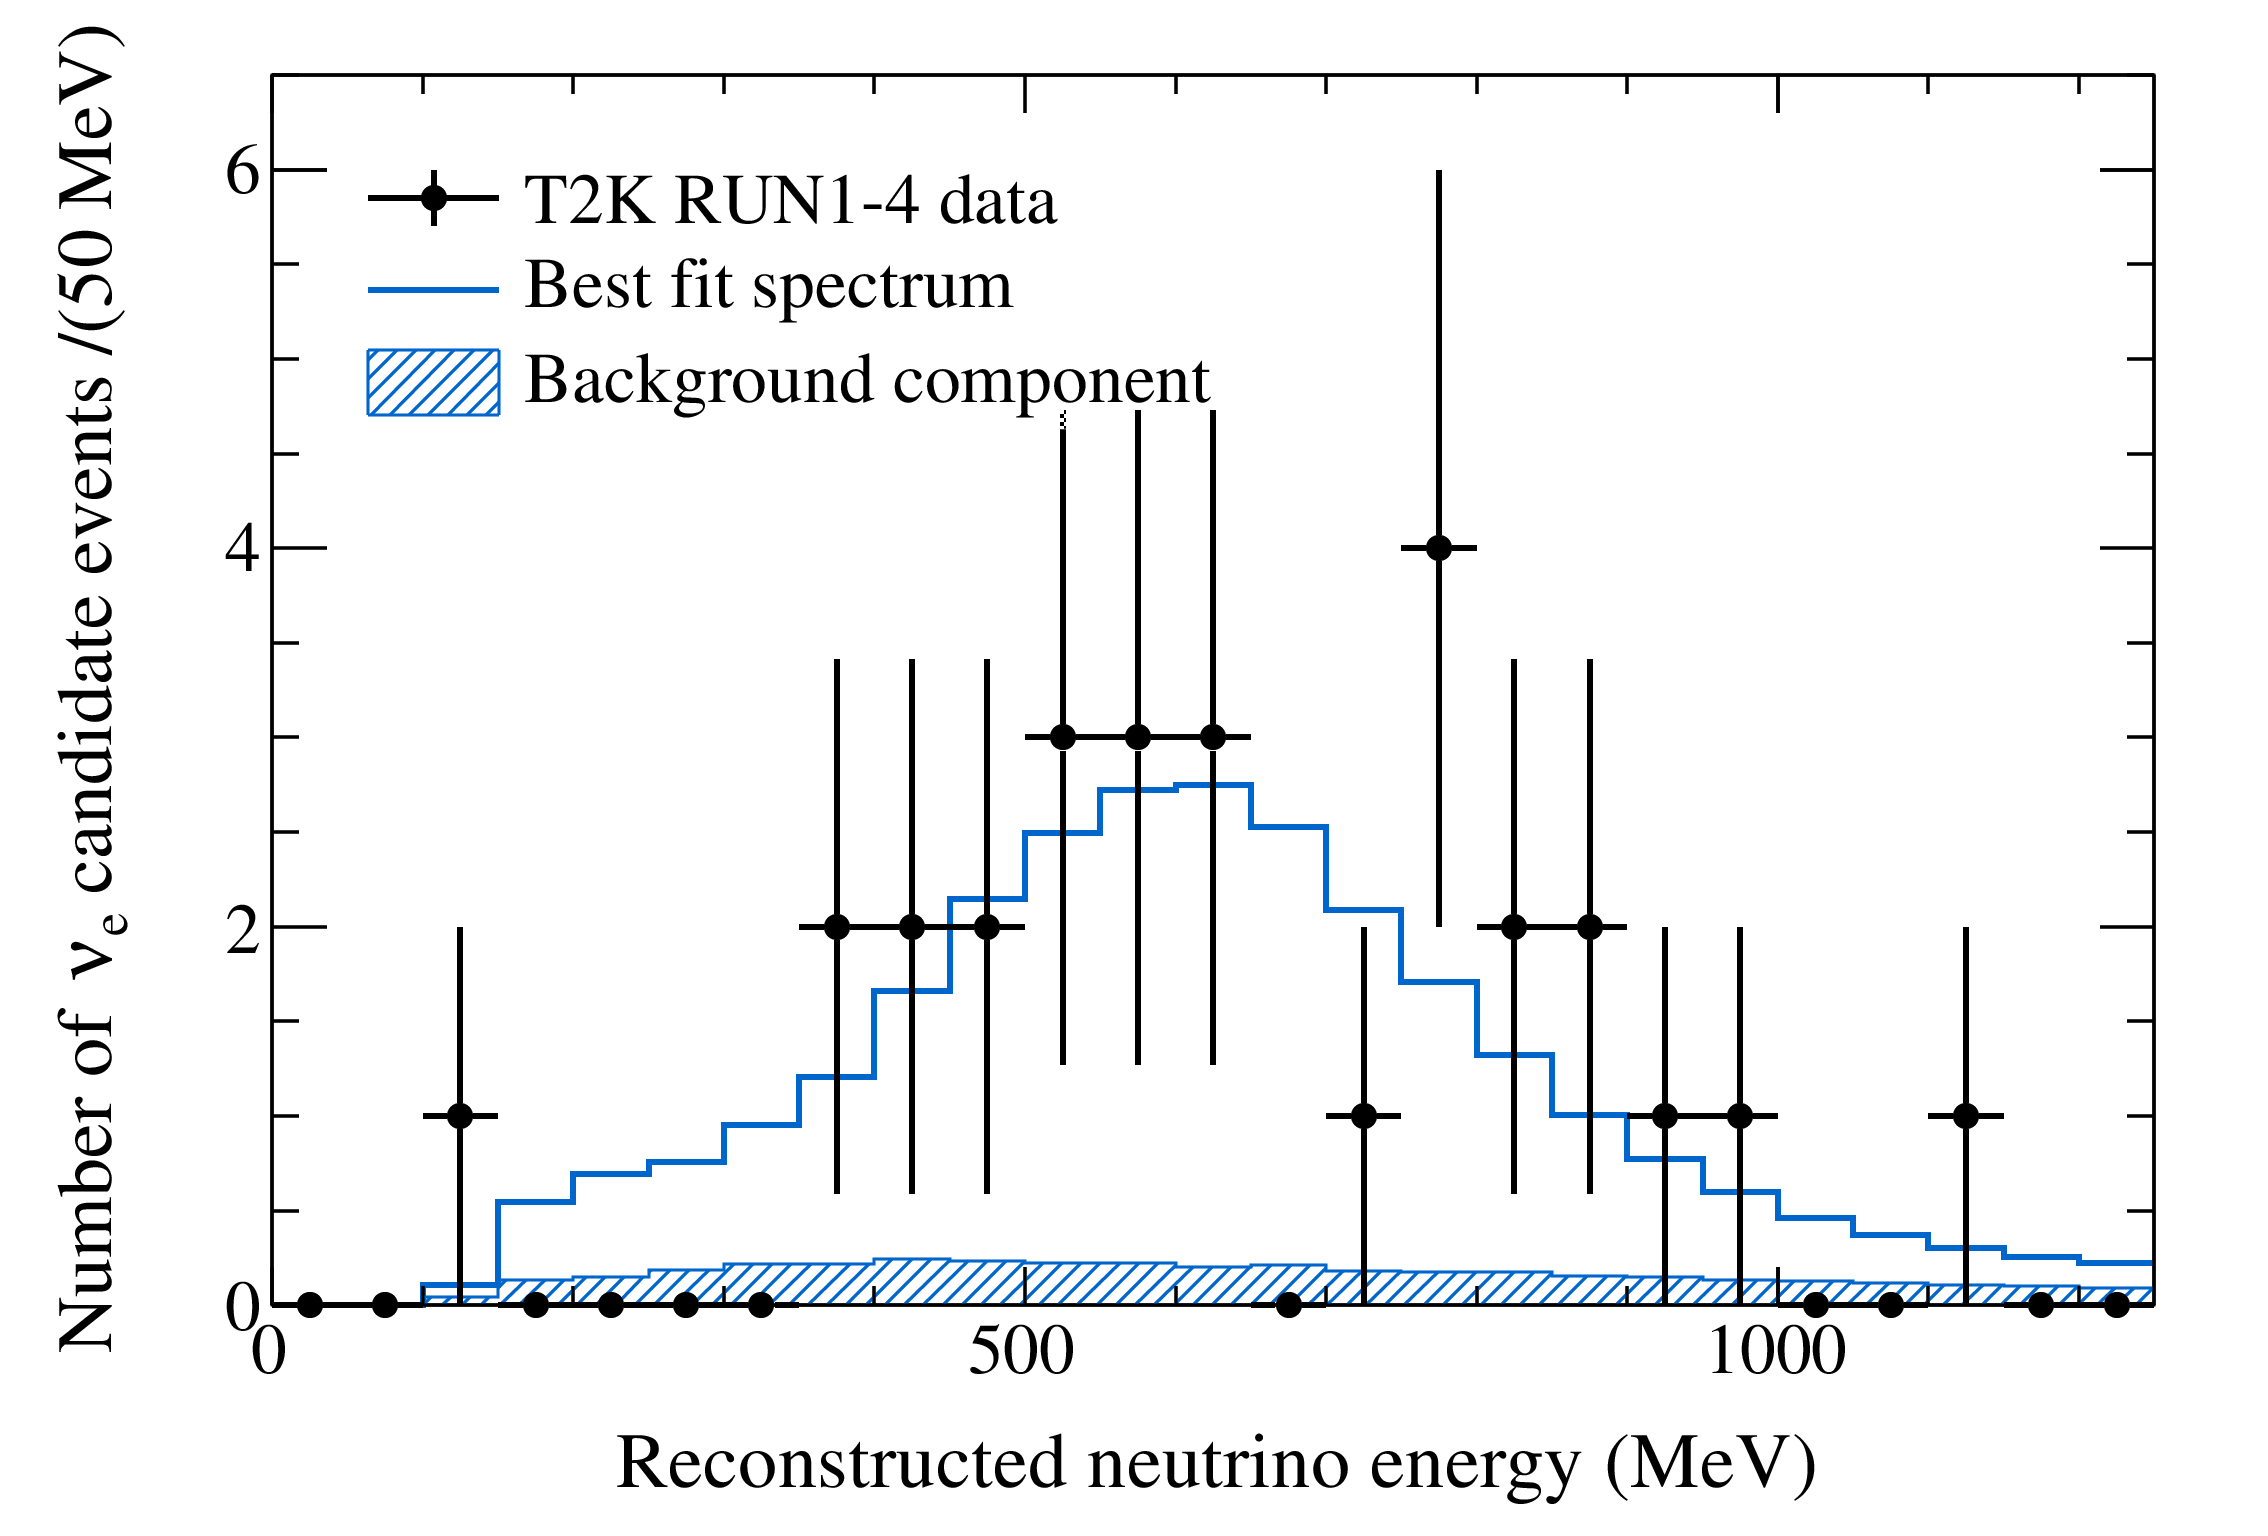
To extract measurements of the oscillations parameters, the final data sample is separately fit in both the one-dimensional neutrino energy distribution and the two-dimensional distribution of electron angle and electron momentum. Figure 4 shows the selected data sample in both of these distributions compared to the best-fit MC in each case.

In the fits presented here is treated as a free parameter with all other oscillation parameters fixed to allow for more straightfoward comparisons with previous T2K results, and to reduce the dependence of these results on the current uncertainties in the other oscillation parameters, which are expected to be improved in the near future. Figure 5 shows the allowed region of sin for various fixed values of with sin, [4], sin, [5]. If is fixed to zero, the significance of non-zero , calculated via either the difference of log-likelihood values between the best fit and or by generating a large number of toy experiments assuming , is 7.5. The significance of non-zero stays above 7 for all choices of and all choices of sin within its current uncertainty. The effect of variations in is also shown in Figure 5 by shifting sin to values near the currently allowed 90% C.L. limits.
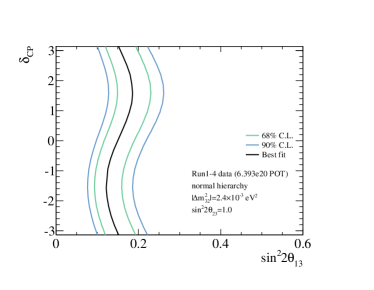
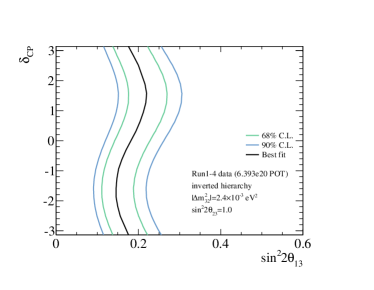


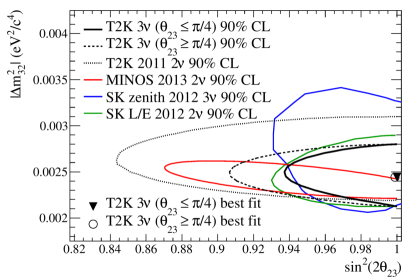
Finally, the T2K -disappearance analysis results have been updated to better characterize the effect of full 3-flavor neutrino oscillations. In the previous 2-flavor approximation, the measured contours in vs sin were independent of whether was above or below radians. However, in a full 3-flavor treatment, particularly now that is known to be large, the size of the contour changes significantly depending on the octant. To illustrate this effect, Figure 6 shows vs sin contours have been made separately for and . In the time since this presentation was given, T2K has published a more complete treatment of this effect in which the best-fit regions are reported in terms of sin rather than sin [5].
References
- [1] K. Abe et al. (T2K Collaboration), Phys.Rev. D88, 032002 (2013).
- [2] R. B. Patterson et al., Nucl.Instrum.Meth. A608 (2009) 206-224
- [3] J. Beringer et al. (Particle Data Group), Phys.Rev. D86, 010001 (2012).
- [4] G. Fogli et al., Phys.Rev. D84, 053007 (2011).
- [5] K. Abe et al. (T2K Collaboration), arXiv:1308.0465, Accepted by Phys.Rev.Lett. (2013).
- [6] Y. Itow, Nuclear Physics B, Proceedings Supplements 235, 79 (2013) the XXV International Conference on Neutrino Physics and Astrophysics.
- [7] P. Adamson et al. (MINOS Collaboration), Phys. Rev. Lett. 110, 251801 (2013).
- [8] K. Abe et al. (T2K Collaboration), Phys. Rev. D 85, 031103(R) (2012).