Survivability of dust in tokamaks: dust transport in the divertor sheath
Abstract
The survivability of dust being transported in the magnetized sheath near the divertor plate of a tokamak and its impact on the desired balance of erosion and redeposition for a steady-state reactor are investigated. Two different divertor scenarios are considered. The first is characterized by an energy flux perpendicular to the plate MW/m2 typical of current short-pulse tokamaks. The second has MW/m2 and is relevant to long-pulse machines like ITER or DEMO.
It is shown that micrometer dust particles can survive rather easily near the plates of a divertor plasma with MW/m2 because thermal radiation provides adequate cooling for the dust particle. On the other hand, the survivability of micrometer dust particles near the divertor plates is drastically reduced when MW/m2. Micrometer dust particles redeposit their material non-locally, leading to a net poloidal mass migration across the divertor. Smaller particles (with radius m) cannot survive near the divertor and redeposit their material locally. Bigger particle (with radius m) can instead survive partially and move outside the divertor strike points, thus causing a net loss of divertor material to dust accumulation inside the chamber and some non-local redeposition. The implications of these results for ITER are discussed.
I Introduction
Burning plasmas ( 10 keV or K) in a DT (deuterium-tritium) fusion reactor generate intense thermal/particle (up to tens of MW/m2) and 14 MeV neutron fluxes that ultimately must interact with a material boundary. Plasma facing components (PFCs) must absorb and survive the enormous power and particle flux, while maintaining structural integrity and thermo-mechanical properties under tens of dpa neutron damage. While the liquid metal wall concept is currently under intensive studies, a solid wall remains the front-runner in fusion reactor PFC design. The top consensus material for a solid PFC is tungsten Suzuki et al. (2003); Ihli et al. (2006) due to its low sputtering yield, high thermal conductivity, and high melting temperature. The ion bombardment flux to the PFC in the divertor region is about m-2s-1 of eV deuterium and tritium, and m-2s-1 of eV helium. Without redeposition, the first wall of a tokamak would be etched away rather quickly. For instance, gross erosion at the limiter tip of TEXTOR was estimated at one meter per run year Winter (2000). Indeed, steady-state fusion reactors rely on a near perfect local balance between erosion and redeposition everywhere on PFCs. The conventional picture is that wall materials are eroded (e.g. via sputtering) and released to the plasma as atoms and molecules, which are ionized via charge exchange and collisional impact ionization, and then brought back to the wall surface to redeposit by the plasma flow. Plasma-material interaction (PMI) studies have been focused on understanding the impurity (wall material) neutral and ion transport and finding ways to manipulate redeposition profiles to match the local erosion rate Rudakov et al. (2007).
It is well known, however, that PMI can also create mobilizable solid particulates or dust (from current carbon-based tokamaks, the dust production rate relative to gross erosion is estimated around 10-15 Grisolia et al. (2009)), whose role in affecting the required local balance between erosion and redeposition is particularly important for a solid tungsten PFC. This is a far greater challenge, as impurity neutrals can be ionized near the wall and hence promptly sent back to the wall, but solid dust particles can traverse long distances in the plasma chamber Krasheninnikov et al. (2004). The dust particles either stay as dust as plentifully collected on all existing short-pulse tokamaks (causing safety issues for fusion reactors) or redeposit non-locally, which leads to large net local erosion and thus causes a point failure on the PFC. For a tungsten PFC, physical and chemical sputtering produce relatively modest erosion. Instead, helium and hydrogen ion fluxes, coupled with a high wall temperature, cause blistering Shu et al. (2007), the formation of pits, holes, and bubbles Nishijima et al. (2003, 2004), and micron-in-length nano-fuzz Baldwin and Doerner (2008), which are sources for erosion in the form of dust particles.
Dust particles are normally not a concern in current short-pulse tokamaks where the energy fluxes to the walls are relatively moderate (a reference number is MW/m2), although occasionally a big chunk of material released by the wall can trigger a disruption Krasheninnikov et al. (2011). However, long-pulse machines like ITER or DEMO are characterized by much higher energy fluxes ( MW/m2), stronger plasma-material interaction and are estimated to produce hundreds kg of dust. Indeed, dust safety limits are in place for ITER, setting the maximum amount of dust that can be present at any given time in the vessel to avoid a shutdown. The most stringent constraint is set by dust on hot surfaces: for a design with carbon, the maximum amount is 6 kg of carbon, 6 kg of tungsten and 6 kg of beryllium, while for a design involving only metallic materials the limit is 11 kg of beryllium and 77 kg of tungsten. Interestingly, Roth et al. Roth et al. (2009) estimated dust production for ITER relevant conditions and concluded that in a design with carbon the dust limit on hot surfaces could be reached in a few tens of discharges. These estimates, however, are based on engineering extrapolations and do not take into account the physics of dust-plasma interaction and dust transport in the chamber. Therefore, a natural question is whether dust particles can survive in the plasma environment of long-pulse machines like ITER and if indeed many kg of dust can be accumulated in such machines. Obviously this is another facet of the PMI problem: large quantities of dust present in the machine imply a net loss of wall materials and potentially areas of net local erosion.
In order to provide some insight on the issue of dust survivability and its impact on the PMI problem, in this paper we study dust transport in the divertor sheath-presheath of a tokamak. We emphasize an intuitively obvious fact that dust particles must stay in proximity of the walls, where the energy fluxes are lower, to be able to survive in long-pulse tokamaks like ITER. This aspect differentiates our study from other studies of dust transport in tokamaks which are more focused on the equally important problem of core contamination Krasheninnikov et al. (2004); Pigarov et al. (2005); Smirnov et al. (2007); Martin et al. (2008); Bacharis et al. (2010); Ratynskaia et al. (In Press) and therefore investigate dust transport outside the sheath-presheath.
Our paper is organized as follows. In Sec. II, we introduce the dust transport equations used in this study. The model consists of dust charging, heating, mass loss equations and the dust equation of motion, in the framework of the Orbital Motion Limited (OML) theory. The dust transport model is coupled with a model of the plasma sheath-presheath near the divertor plate, which we discuss in Sec. III. This model is based on the Braginskii fluid equations Braginskii (1965) and, unlike conventional sheath models, features an equation for the conservation of energy, such that the plasma profiles vary consistently with the plasma flow acceleration towards the plate. In Sec. IV we present simulations of dust transport in the divertor sheath-presheath, comparing and contrasting the dynamics and survivability of dust particles in an environment characterized by MW/m2 relative to MW/m2. Dust survivability depends on the competition between cooling and heating. Thermal radiation is the main cooling mechanism and is limited by the sublimation/evaporation temperature of the dust material, . For tungsten, the evaporation temperature is K and MW/m2. On the other hand, the heating energy flux associated with electron collection scales as . For an electron temperature eV, MW/m2. Thus, one expects that dust particles have a better chance of survival in current short-pulse tokamaks ( MW/m2, m-3) where , than in long pulse-tokamaks ( MW/m2, m-3), where . Our simulations confirm this qualitative picture and place constraints on the dust size needed for survival: While in the lower energy flux environment typical of current short-pulse tokamaks micrometer dust particles can quite easily survive near the divertor plates because of adequate cooling by thermal radiation, for MW/m2 they do not survive and redeposit their material non-locally. Bigger particles (of radius m), on the other hand, can survive partially, thereby causing a net loss of divertor material. The conclusions and the implications for long-pulse machines like ITER or DEMO are presented in Sec. V.
II Dust transport model
We now discuss the model for dust transport in a plasma. As soon as the dust particle meets the plasma, it begins to charge by collection of background plasma and electron emission Shukla and Mamun (2001). The subsequent dust dynamics is governed primarily by the electrostatic and drag forces. Therefore our model couples the equation of motion for the dust grain to a model for dust grain charging. Furthermore, since the dust-plasma interaction can result in significant heat and mass sublimation/evaporation of the dust particle, the model also includes a dust heating equation and an equation for dust mass loss. We proceed to describe each component of the model separately.
II.1 Dust charging equation
For dust charging, we follow the OML approach Mott-Smith and Langmuir (1926) and consider dust collection of background plasma particles and electron emission due to thermionic emission and due to secondary emission caused by the impact of energetic plasma particles. The equation for the evolution of the dust charge ( is the elementary charge) is
| (1) |
where represents the various collection and emission currents defined below. The dust charge is related to the dust surface potential by
| (2) |
with the permittivity of vacuum, the dust radius, the dust potential, and the screening length near the grain. In this study, we assume when , where the linearized Debye length is given by [with the electron and ion Debye lengths defined by , and are the local electron (ion) temperature and density], while for we use . This is a rough attempt to take into account the results of Ref. Daugherty et al. (1992), showing that the screening length increases with the dust radius. In Eq. (1), the ion collection current is
| (3) |
where is the ion mass,
| (4) |
and
| (5) |
The ion thermal velocity is , while and are the ion and dust flow, respectively. The electron collection current is
| (6) |
with the electron mass. From Eq. (3), one can notice that the ion collection current accounts for the fact that the ions have a finite mean velocity, since such velocity can be comparable to the ion thermal speed in the sheath-presheath. The secondary emission current due to electron impact (ion impact is usually neglected since it becomes important for ion energies above keV) is given by Shukla and Mamun (2001)
| (7) |
where is the kinetic energy of the incident electron, is the temperature of the secondary emitted electrons, the secondary emission yield is given by the Sternglass formula Bruining (1954)
| (8) |
with and parameters that depend on the dust material ( and eV for silicates), and
| (9) |
is the distribution function of the incident electrons. The thermionic current is given by the Richardson-Dushman formula Ashcroft and Mermin (1976); Sodha and Guha (1971)
| (10) |
where is the dust surface temperature, is Planck’s constant, and the thermionic work function of the dust material. We note that, for a positively charged grain, the OML formulas do not take into account the fact that a potential well can form near the grain, as shown in Refs. Delzanno et al. (2004, 2005).
II.2 Dust equation of motion
The dust charging model is coupled to the equation of motion of the dust grain
| (11) |
where is the dust mass ( is the dust density), and are the local electric and magnetic field, and g is gravity ( m/s2). We note that in Eq. (11) we do not include the rocket force which can be present when the dust particle is losing mass, thus implicitly assuming that the dust material is lost with zero velocity relative to the dust particle.
The ion drag force can be calculated in the framework of the OML theory. It is normally divided between the contribution to the drag by the ions that are directly collected by the dust grain (labeled as ), and the scattering part due to the Coulomb interaction between the dust grains and the ions (not collected by the grain) orbiting in the dust grain sheath (labeled as ). For a negatively charged grain, the drag collection is given by
| (12) |
while for a positively charged grain it is given by
| (13) |
In Eqs. (12) and (13) we have defined . For the orbital part of the ion drag force, we follow the model described in Refs. Pigarov et al. (2005); Smirnov et al. (2007). That is, for both negatively and positively charged grains, we have
| (14) |
where the Chandrasekhar function is . For a negatively charged grain, the Coulomb logarithm is calculated as
| (15) |
with the impact parameter , the screening length and used in Ref. Pigarov et al. (2005); Smirnov et al. (2007) to fit PIC simulation results obtained by Hutchinson Hutchinson (2003). For a positively charged grain, the Coulomb logarithm is given by Khrapak and Morfill (2004)
| (16) |
In the sheath-presheath of a tokamak, an estimate of the forces acting on the micrometer dust grains indicates that the electrostatic force and the ion drag are dominant, while the magnetic part of the Lorentz force and gravity are negligible Krasheninnikov et al. (2004); Tang and Delzanno (2010). Gravity becomes important for bigger dust grains of radius m.
II.3 Dust heating equation
As the dust grain interacts with the plasma, it can heat up substantially. This gives rise to a considerable thermionic emission current, which changes the dust floating potential and affects the current collection and the drag forces on the grain, and, if conditions for evaporation/sublimation are met, can lead to mass loss. We consider the following dust heating equation
| (17) |
where is the specific heat capacity of the grain, assumed to be constant. In Eq. (17), the energy fluxes associated with the background plasma collection and electron emission are calculated from OML theory. The energy flux resulting from ion collection is
| (18) | |||||
where
| (19) |
For electron collection and thermionic/secondary emission we have
| (20) |
The thermal radiation flux is given by the Stefan-Boltzmann law
| (21) |
where is the emissivity of the dust material (which depends on dust size and temperature), is the Stefan-Boltzmann constant and is the wall temperature. Finally, since the dust grain acts as a site where electrons and ions can recombine and a neutral atom or molecule can be released, we account for the energy flux associated with such process (see the discussion in Refs. Martin et al. (2008); Bacharis et al. (2010))
| (22) |
Equation (22) assumes that hydrogen/deuterium molecules are released.
II.4 Dust mass loss equation
When conditions for evaporation or sublimation are met, the dust grain loses mass according to the following equation
| (23) |
where is the net energy flux on the grain (sum of all the energy fluxes described above), and is the latent heat for the relevant phase change. We note that Eq. (23) is applied only for , since would correspond to the grain collecting mass. For a spherical dust grain and assuming isotropic mass loss, Eq. (23) becomes an equation for the evolution of the dust radius:
| (24) |
Equations (1), (11), (17) and (24) constitute the model that will be used in the Sec. IV to study dust transport in the magnetized sheath-presheath of the divertor. Overall this model is quite similar to other models of dust transport in a plasma, including the ones that are currently used for tokamak applications Ticos et al. (2006); Pigarov et al. (2005); Smirnov et al. (2007); Martin et al. (2008); Bacharis et al. (2010); Ratynskaia et al. (In Press).
III One-dimensional model of the magnetized sheath-presheath
The model of dust transport described in the previous section is coupled to a model for the local conditions of the background plasma and electromagnetic field. Since we are interested in dust transport near the walls, where chances of survival are maximized, we develop a model for the magnetized sheath-presheath near the divertor plates. We consider a system where a plasma interacts with a planar divertor plate lying horizontally. We use Cartesian geometry , where is the direction perpendicular to the plate. A stationary magnetic field is present, with and the angles relative to the plate and a reference magnetic field. The system is one-dimensional and all the quantities depend only on . Since we consider , the direction corresponds to the toroidal direction of a tokamak, while is the poloidal direction.
The goal of this section is to build a sheath-presheath model within the framework of a fluid model for the plasma that includes an energy equation. In order to do this, we start from the Braginskii equations for a collisional plasma consisting of electrons and singly charged ions Braginskii (1965). The electron and ion collisional times are defined as
| (25) |
where . The Coulomb logarithm is a very slowly varying function of density and temperature and it will be assumed constant in the sheath-presheath model.
We consider the steady-state Braginskii equations in the magnetized limit corresponding to , with the electron (ion) cyclotron frequency given by . Neglecting terms due to the stress-tensor, these equations, in normalized units to be described below, are:
| (26) | |||
| (27) | |||
| (28) | |||
| (29) | |||
| (30) | |||
| (31) |
for the electron density , velocity field and pressure and similarly for the ions. Moreover, the electric field is obtained by Poisson’s equation
| (32) |
Equations (26)-(32) have been written according to the following normalization: , , , , , , , , where , and () are some reference density and electron (ion) temperature. We have defined the ion sound speed as , the ion gyroradius as , and . We note that in the continuity equations (26) and (29) we have included a source term due to ionization. We assume a constant ionization frequency, , implying that we are implicitly assuming a stationary and uniform background of neutrals. We have not attempted to model accurately the rather complex energetics of the ionization process. For this, we have simply introduced two fictitious temperatures, and , which can be varied parametrically. We also note that the form of the terms proportional to in the momentum and energy equations is due to the fact that these equations are written in non-conservative form.
In Eqs. (26)-(31), the collisional term in the momentum equations, , is composed of the friction force due to the relative motion between electrons and ions and of the thermal force:
| (33) |
where and refer to the direction parallel and perpendicular to the magnetic field and is the unit vector along . The electron and ion heat fluxes are given, respectively, by
| (34) |
and
| (35) |
where the thermal conductivities are
| (36) | |||
| (37) |
The heat generated by the electrons in collisions with the ions is
| (38) |
while the heat acquired by the ions is
| (39) |
The important point is that model (26)-(32) features an equation for the conservation of the energy flux. By introducing the convective energy fluxes as
| (40) |
and starting from the conservative form of the energy equations (28) and (31), it is easy to show that
| (41) |
We further manipulate Eqs. (26)-(32) by exploiting
| (42) |
(where the Coulomb logarithm is evaluated with the reference normalization parameters) and similarly for the ions and keeping only the zeroth and first order terms in . The resulting equations are
| (43) | |||
| (44) | |||
| (45) | |||
| (46) | |||
| (47) | |||
| (48) | |||
| (49) |
Equations (43)-(49) are the sheath-presheath model focus of this paper. Very often in the literature a distinction is made between the sheath and the presheath. The presheath is essentially a quasi-neutral region where a weak electric field is setup to accelerate the ions to the sound speed at the entrance of sheath. This is known as Bohm’s condition for the existence of a stationary (non-oscillatory) sheath. When a magnetic field is present (and the ions are fully magnetized), the presheath can be further divided into the regular presheath and the magnetic presheath (or Chodura layer). The transition between presheath and Chodura layer is reached when the parallel flow becomes sonic Chodura (1982). The sheath, on the other hand, is a region of strong non-neutrality in the plasma, characterized by a strong electric field. Thus, the physical picture of the magnetized sheath is the following: in the presheath, the ion flow is accelerated to the sound speed parallel to the magnetic field; in the Chodura layer, the ion flow is deflected from parallel to the magnetic field to perpendicular to the wall (and equal to the sound speed); in the sheath, a strong electric field is created to equalize the plasma currents to the wall.
We solve Eqs. (43)-(49) numerically as a set of ordinary differential equations (ODEs) by specifying the boundary conditions upstream (here upstream is relative to the position of the plate). We use the following upstream boundary conditions: zero particle flux (implying zero convective energy flux) and a finite conductive heat flux (namely a finite temperature gradient) for both electrons and ions, which is used to set the desired total energy flux in the direction perpendicular to the plate (labeled ). We note that in principle one can integrate the system of ODEs indefinitely starting from upstream. Some conditions is therefore needed to stop the integration and determine the plate position and the system size. In our study this condition is given by the electron velocity perpendicular to the plate equal to the local electron thermal velocity, since this corresponds to a singularity of the sheath-presheath model, as done in Ref. Duarte and Clemente (2011).
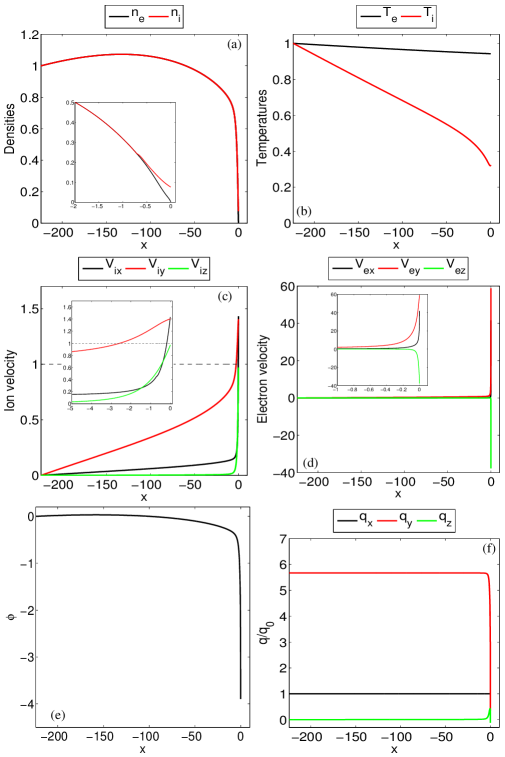
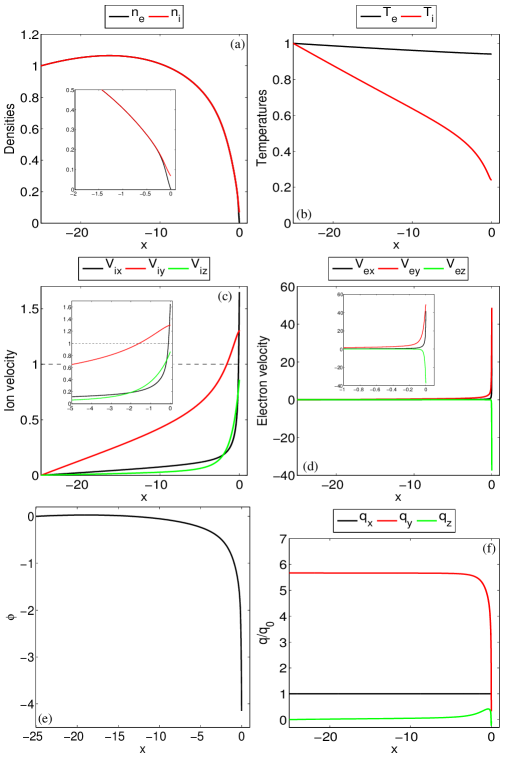
For the results presented in this paper, we consider a deuterium plasma and a magnetic field of magnitude T, with angles relative to the plate . We also set . The conductive heat flux upstream is , while for the ions , and we adjust to have an ion temperature profile which is monotonically decreasing towards the plate. The ionization rate is . In order to study dust transport in regimes that are relevant to current short-pulse and next generation long-pulse tokamaks, we consider two classes of equilibria. The first is characterized by an energy flux perpendicular to the divertor plate MW/m2 in a plasma with upstream plasma density part/m3 and temperature eV, and is plotted in Fig. 1. The second equilibrium has an energy flux perpendicular to the wall MW/m2 in a plasma with part/m3 and eV, and is plotted in Fig. 2. Qualitatively the two profiles are very similar, the most obvious difference being the system size: in Fig. 1 and in Fig. 2. This difference is due to the ionization rate, which sets the presheath width, and is times higher in Fig. 2. We note that, for these parameters, the system size is comparable to the ion collision mean free path (, and for Figs. 1 and 2, respectively) and smaller than the ionization mean free path (, and ). Figures 1 and 2 show the typical behavior of the magnetized sheath outlined above: the density decreases significantly towards the plate (a) while the plasma is accelerated, and the ion velocity parallel to the magnetic field (which in practice coincides with ) becomes sonic before the velocity perpendicular to the plate does, marking the formation of the Chodura layer and of the sheath. In Fig. 1 the width of the Chodura layer is while the sheath width is . For the parameters of Fig. 2 we have and . We note that the electron velocity (d) becomes much higher than sonic in the sheath. This is just a consequence of how we determine the plate position from the upstream conditions (therefore, for dust transport, we still use Eq. (6), without accounting for the electron drift velocity). An important aspect in Figs. 1 and 2 is that the plasma temperature decreases towards the plate. This is due to the finite thermal conductivity of the plasma (particularly for the ions) and the fact that the heat flux must decrease while the plasma is accelerated and the convective energy flux increases. Indeed Figs. 1 and 2 (f) show that the total energy flux parallel to the plate is conserved. The important observation is that the upstream energy flux is large and mostly parallel to the magnetic field (), but it decreases substantially in the Chodura layer and the sheath. Thus, dust particles have a much better chance for survival in this environment if they can remain confined near the walls.
IV Dust transport simulations
In this section we study dust transport in the magnetized sheath-presheath discussed in Sect. III. We inject dust particles at the divertor plate with injection velocity m/s and follow their dynamics. The small injection velocity is motivated by our focus on dust survivability and PMI: in order to withstand the harsh tokamak environment, dust particles must necessarily move in proximity of the divertor plates/walls, where the energy fluxes are lower. A large injection velocity perpendicular to the plate, as considered in other studies Krasheninnikov et al. (2004); Smirnov et al. (2007), will eject the dust particle outside the sheath-presheath, where for MW/m2 it is likely to sublimate or evaporate due to higher energy fluxes, and eventually redeposit non-locally. The actual dust injection velocity in tokamaks is mostly an open question (although it has been measured around m/s during disruptive events Yu et al. (2009)), reflecting the fact the dust generation mechanisms (particularly for tungsten-based machines) are still poorly understood, and requires further experimental studies. In general, for the parameters typical of long-pulse machines considered here, a micrometer tungsten particle with injection velocity of a few remains confined in the sheath/Chodura layer, implying that our results are relevant to regimes that are not characterized by fast and localized heat loads to the wall.
The physics of dust transport in the magnetized sheath is dominated by the electrostatic and ion drag forces, and can be described in the following terms Tang and Delzanno (2010): as the dust particle is released into the plasma, it becomes charged and feels the effect of the electrostatic force. For a negatively charged dust grain, the electrostatic force is directed away from the plate, since the plate is negatively charged, and is stronger in the sheath. At the same time the plasma flow exerts a drag force on the grain that tends to bring it back to the plate. The ion drag is stronger away from the plate, where the plasma density is higher. Therefore, in the direction perpendicular to the plate these two forces can balance and there can be an equilibrium position somewhere in the sheath-presheath. Such equilibrium position depends on the dust radius, with smaller particles having equilibrium positions further away from the plate Tang and Delzanno (2010). Thus, the dynamics perpendicular to the plate involves oscillatory motion around the equilibrium position and bouncing on the plate. We note that for a positively charged grain there is no equilibrium position as both forces point towards the plate. In our simulations, however, the dust particle can become positively charged only after an initial transient and the bouncing motion continues because of the dust inertia. In the direction parallel to the plate, on the other hand, the ion drag force is unbalanced and the dust particle can travel long distances and be accelerated to large velocities Krasheninnikov et al. (2004).
In order to characterize dust survivability and its impact on PMI, we consider a reference divertor whose poloidal width is cm, as done in Ref. Tang and Delzanno (2010). When a dust particle moves poloidally to a distance greater than , it moves outside the divertor strike points to regions of the tokamak where the plasma is more benign. Therefore we conclude that it survives, giving rise to a net loss of divertor material. When the poloidal transit distance is less than , the dust particle does not survive and redeposits its material. In this case, when the characteristic poloidal distance traveled by the dust before destruction is less or comparable to the gyroradius of a tungsten atom sputtered by the wall and promptly ionized ( m for T and a characteristic speed of a few eV), we conclude that redeposition is local. Otherwise redeposition is non-local.
The dust parameters used in the simulations are mostly those used in DTOKS Martin et al. (2008); Bacharis et al. (2010), apart for tungsten’s specific heat capacity where we choose J/kg K to account for the increase at higher temperatures relative to the value of J/kg K at room temperature and for tungsten emissivity, which is obtained by fitting the results of Ref. Rosenberg et al. (2008) for m. We use a piece-wise linear fit of the dust temperature dependence between K and K, and assume that emissivity remains constant for K. We do not model the dust size dependence of emissivity, which affects the thermal radiation flux when the dust radius is reduced by evaporation. Considering that above K emissivity increases while the dust radius deacreases, this implies that our results are conservative in terms of dust survival. The dust parameters are reported in Table 1 for clarity. In addition, the temperature of the secondary emitted electrons is eV and the wall temperature is K. We also assume that collisions with the divertor plate are elastic. We consider particles of different size centered around m, which is the characteristic size of the dust collected in current tokamaks Wang et al. (2008). In the event of significant sublimation or evaporation, we end the simulations when the dust radius reaches nm, which is the limit where a continuous charging theory like OML begins to break down.
| Property | Carbon | Tungsten |
|---|---|---|
| Density (kg/m3) | ||
| Specific heat capacity (J/kg/K) | ||
| Melting temperature (K) | ||
| Sublimation temperature (K) | ||
| Evaporation temperature (K) | ||
| Latent heat of fusion (J/kg) | ||
| Latent heat of sublimation (J/kg) | ||
| Latent heat of evaporation (J/kg) | ||
| Thermionic work function (eV) | ||
| (eV) | ||
| Emissivity | see text |
IV.1 Micrometer carbon dust particle transport in the magnetized sheath with MW/m2
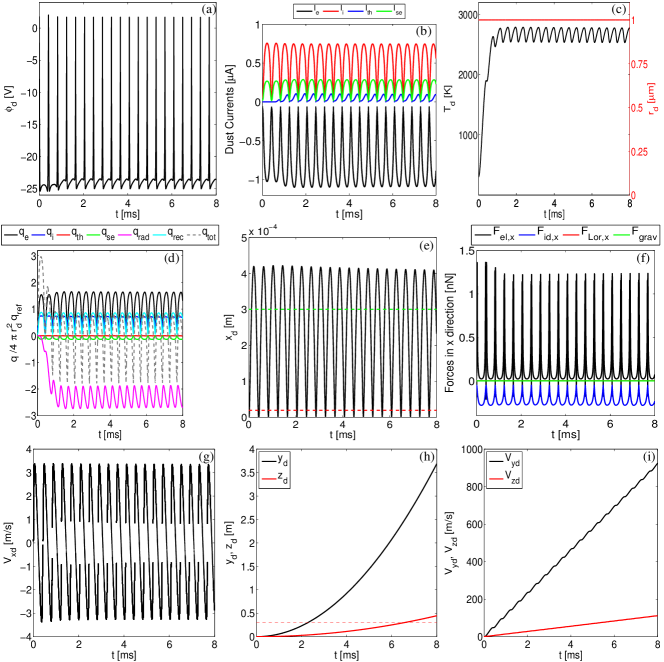
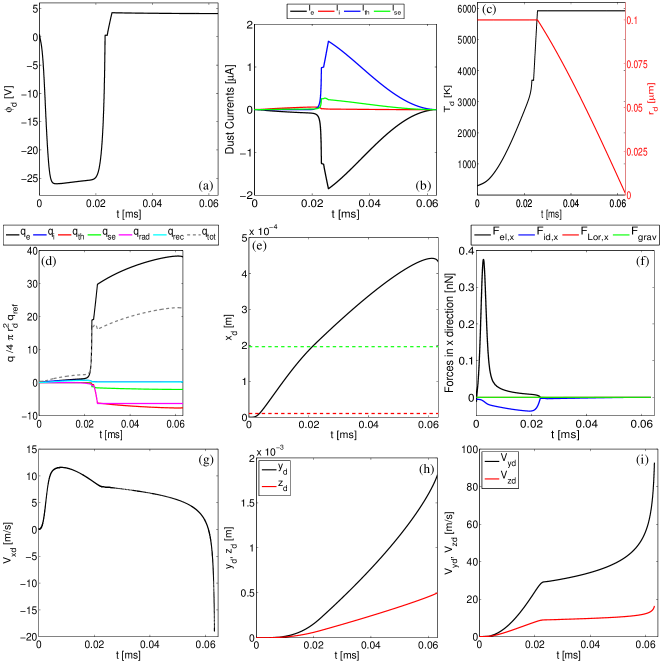
Figure 3 shows the evolution of model quantities for a simulation of dust transport for a m particle. The total energy flux in the direction perpendicular to the plate is MW/m2 and we use carbon dust, therefore this case is representative of what a micrometer dust particle can experience in present-day short-pulse tokamaks, and allows us to make contact with some results reported in the literature. The case of tungsten dust for the same reference parameters is qualitatively similar and leads to the same conclusions (not shown).
As the dust particle is released from the plate, there is a very rapid transient (on a time scale of tens of ns) during which the dust charges due to the absorption of background plasma particles. It is interesting to note that in this particular instance the initial rapid charging transient leads to a positively charged dust V. This is because very close to the plate the electron density is much smaller than the ion density: . However, the initial injection velocity is sufficient to move the dust towards regions of higher electron density, where it quickly charges negatively and is then pushed away from the plate by the electrostatic force. Figure 3 (a) shows that the dust potential then oscillates between V (away from the plate) and V (at the plate). Figure 3 (b) shows the dust currents as a function of time. One can see that the electron current is balanced by the ion and secondary electron emission currents, while the thermionic current is less important (particularly for ms). We note, however, that the oscillations in the dust potential lose their initial symmetry precisely due to the contribution of thermionic emission. In general the plasma currents are stronger away from the plate, when the plasma density is higher. Figure 3 (c) shows the time evolution of the dust temperature and dust radius, while Fig. 3 (d) shows the energy fluxes from the various sources described in Sec. II, normalized to the reference value MW/m2. The dust temperature rises to about K within the first ms, mainly due to the energy fluxes associated with the background plasma and with the recombination of electrons and ions on the dust grain surface. As the dust temperature rises, dust particle cooling due to thermal radiation becomes important. Similarly to the dust currents in Fig. 3 (b), when the dust particle moves away from the plate the plasma has a significantly higher density and delivers a net positive energy flux to the dust. On the other hand, the energy flux from the background plasma becomes rather small in the sheath and the dust can cool by thermal radiation. Thus the dust temperature saturates, reaching a maximum value of K well below the sublimation temperature. Consistently, the dust particle does not lose any mass and its radius remains constant at m, as shown in Fig. 3 (c).
Figure 3 (e) shows the bouncing motion perpendicular to the plate that was discussed above. One can see that the dust particle travels outside the Chodura layer, with a maximum excursion of about . The forces in the direction perpendicular to the plate are shown in Fig. 3 (f), indicating that indeed the electrostatic and ion drag forces are dominant in different parts of the sheath-presheath. Figure 3 (g) shows the dust velocity normal to the plate. It oscillates between m/s, indicating that the electrostatic force has accelerated the particle well beyond the initial injection velocity of m/s.
Figure 3 (h) shows the toroidal () and poloidal () distances traveled by the dust particle. At the end of the simulation, the dust particles has moved m toroidally and cm poloidally, which is larger than our reference poloidal divertor width cm. Thus, a dust particle such as the one in Fig. 3, introduced for instance at the one edge of the divertor, could travel poloidally across the whole divertor and reach regions of the tokamak where the plasma is more benign. Figure 3 (i) shows that the dust particle can be accelerated to velocities of the order of several hundred m/s, particularly in the toroidal direction. This result is consistent with earlier simulation results by Krasheninnikov and collaborators Krasheninnikov et al. (2004); Smirnov et al. (2007), and with experimental evidence of dust motion recorded from fast cameras in various tokamaks Rudakov et al. (2009). Interestingly, the fact that dust particles can travel long distances and experience a large number of collisions with the plate has been advocated by Krasheninnikov et al. as a mechanism to redirect dust motion towards the core, with important implications from the point of view of core contamination Krasheninnikov et al. (2004). Key to this idea is the fact that the wall or divertor plates are characterized by some level of surface roughness, whose characteristic length scale must be comparable with the dust grain radius to be effective.
In summary, for parameters relevant to current short-pulse tokamaks ( MW/m2), we have confirmed that micrometer dust particles born with small injection speeds remain confined to the sheath-presheath, are accelerated to high toroidal speeds, and can travel long distances in the tokamak chamber. These particles can survive near the walls rather easily, because they can cool efficiently via thermal radiation.
IV.2 Tungsten dust particle transport in the magnetized sheath with MW/m2
Next, we study dust transport in the divertor sheath-presheath with MW/m2. Since this case is relevant to long-pulse machines like ITER or DEMO, we only consider tungsten dust.
IV.2.1 Micrometer dust particle
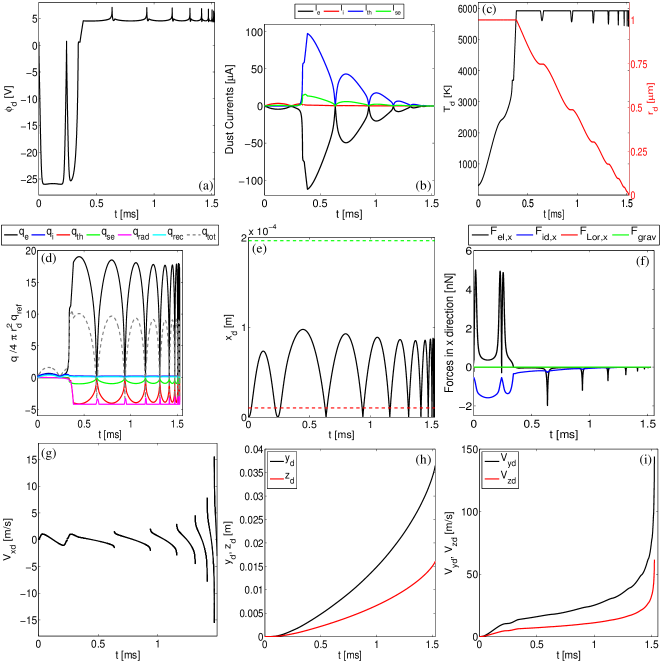
Figure 4 shows the evolution of model quantities for a simulation of a micrometer dust particle. Let us compare the dynamics of Fig. 4 with that of Fig. 3. Figure 4 (a) shows the evolution of the dust potential. The initial dynamics is qualitatively similar to that of Fig. 3 (a), with the dust charging to a positive potential V within ns, and then reaching V as it travels away from the plate. However, during the second bounce on the plate, the evolution of the dust potential is very different from that in the first bounce. This symmetry is broken by the fact that the dust temperature has already reached conditions that lead to a very strong thermionic emission current, as it can be seen in Fig. 4 (b). Unlike the case of Fig. 3 (b), where the balance between the dust currents is mainly due to the background electrons and ions collection for the entire simulation, in Fig. 4 (b), after ms, this balance is mainly due to the background and thermionic emission electrons, with a relatively small contribution from the secondary emitted electrons and practically none from the ion current. It is also worth emphasizing that thermionic emission induces a large spike in the electron collection current, which peaks at about A. Consistently, for ms the dust grain remains positively charged, with the dust potential oscillating between V and V. Figure 4 (c) shows the evolution of the dust temperature and dust radius, while Fig. 4 (d) shows the corresponding energy fluxes on the dust grain. The dust temperature rises rather sharply: within ms the dust has melted completely ( K) and at time ms conditions for evaporation ( K) are met, the dust starts to lose mass and its radius shrinks. In ms the dust radius reaches nm and the simulation ends. The energy fluxes in Fig. 4 (d) are consistent with the dust currents in Fig. 4 (b). Initially the dust particle receives a strong positive net energy flux from the background plasma. The rise of the dust temperature and of thermionic emission induces an energy flux collection spike from the background electrons, similar to what has been observed in Ref. Smirnov et al. (2007). Unlike the case of Fig. 3 (d), the thermal radiation flux is unable to provide enough cooling, and the dust particle evaporates. However, thermal radiation is still dominant when the dust particle is near the plate. This leads to the negative spikes in the dust temperature and the corresponding plateau in the dust radius that can be seen in Fig. 4 (c).
The dust motion in the direction perpendicular to the plate can be seen in Fig. 4 (e). Relative to Fig. 3 (e), one can see that the dust moves inside the sheath/Chodura layer, closer to the plate. This is due to fact that in this case the background plasma has times higher density and the ion drag is comparatively stronger. While the dominant forces are still the ion drag and electrostatic forces [Fig. 4 (f)], for ms the dust grain is positively charged, the electrostatic force points towards the plate, and there is no equilibrium position in the sheath-presheath. It is important to note, however, that the number of bouncing collisions with the plate is reduced relative to Fig. 3, and so is the probability for the dust particle to be redirected by surface roughness. The mass loss affects the evolution of the dust velocity perpendicular to the plate, shown in Fig. 4 (g). During the first bounce the dust particle returns to the plate with a velocity very similar to its injection velocity, m/s. However, during the second bounce, the electrostatic force starts pushing towards the wall and the dust radius shrinks to m, leading to m/s. The process continues in a runaway fashion, and the dust particle reaches a peak velocity perpendicular to the plate of m/s, about times larger than that obtained in Fig. 3 (e). [We note that, for clarity of Fig. 4 (g), we have only plotted the first of the simulation and the peak at m/s is not shown].
One more comment is in order with regard to the dynamics normal to the plate. For ms, the dust particle is a droplet and the issue of its bouncing on the plate requires careful consideration. Indeed the impact of droplets on solid surfaces is a rather complex subject and a rich research area (see for instance the review by Yaris Yarin (2006)). Its outcome can be broadly classified in four categories: sticking, bouncing, spreading/deposition and splashing, in order of increasing droplet velocity normal to the surface Rein (2002). The thresholds between the various outcomes depend on many factors, including physical and kinematic parameters of the droplet, as well as surface parameters like wettability and surface roughness Yarin (2006); Rein (2002). It is customary to introduce the Weber number , where is the dust surface tension (for tungsten, N/m), which measures the strength of the droplet inertia normal to the surface to its surface tension. Bouncing is typically associated with small values Rein (2002). For the simulation of Fig. 4, most of the dynamics occurs in this regime, . In the last three bounces, however, the Weber number becomes of order unity because of the large dust velocity attained by the dust particle normal to the plate and this could lead to spreading/deposition on the surface. Furthermore, a liquid droplet in a plasma could in principle disrupt electrostatically. This was studied in Ref. Coppins (2010), which shows that for tungsten dust particles in the low temperature plasmas considered here ( eV), electrostatic disruption should not occur.
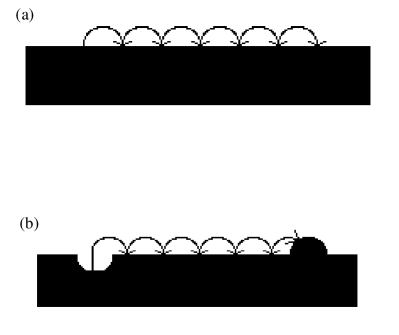
The poloidal and toroidal transit distances traveled by the dust particle are shown in Fig. 4 (h) and the corresponding velocities are in Fig. 4 (i). The dust particle is still accelerated to high speeds, although much more so towards the end of the simulation, after the dust radius has shrunk considerably. The particle has moved about cm toroidally, and about cm poloidally at the end of the simulation. The transit distances obtained at the time in which the dust radius has shrunk to half its size (and the dust particle has lost about of its mass), ms, are approximately cm toroidally and mm poloidally. Unlike the case of Fig. 3, the dust particle evaporates before it can transit our reference divertor plate poloidally. The crucial observation, however, is that, owing to the unbalanced ion drag acceleration in the poloidal direction, the dust always move in the direction of the poloidal plasma flow and redeposits its material non-locally. Over time, this leads to a net poloidal mass migration from one side of the divertor plate to the other, which bears some resemblance with the formation and transport of sand dunes in the desert, shaped by the wind flow. A cartoon of the poloidal mass migration is sketched in Fig. 5. In order to transit the reference divertor poloidally without evaporating, the dust particle should have a poloidal injection speed m/s. This sets a design constraint for the dust shield concept in Ref. Tang and Delzanno (2010).
In summary, we have shown that the dynamics of a micrometer dust particle near the divertor plates of a tokamak characterized by an energy flux perpendicular to the plate MW/m2 is completely different from that in a plasma with MW/m2: the survivability and transport of micrometer dust particles are drastically reduced. The dust particle redeposits its material non-locally, with a net poloidal mass migration from one side of the divertor plate to the other.
IV.2.2 Sub-micrometer dust particle
Next, we analyze the dynamics of a tungsten dust particle with radius m (all other parameters are unchanged).
The evolution of the model quantities is shown in Fig. 6 with the same format of Figs. 3 and 4. Figure 6 (a) shows the evolution of the dust potential. The initial part of the dynamics is qualitatively similar to that of Figs. 3 and 4, with the dust reaching a negative potential of about V in s. At this point the dust starts to heat up and the thermionic current becomes dominant together with the background electron current [Fig. 6 (b)]. At s the dust becomes positively charged, and for s the dust potential saturates to V. Figure 6 (c) shows the evolution of the dust temperature and radius. Melting conditions are reached at s and the dust starts to evaporate at s. Within s the dust particle has shrunk to nm, much faster than the case of Fig. 4, where it took ms for a micrometer dust particle to reach nanometer size, in part owing to the initial size difference. The energy fluxes are shown in Fig. 6 (d): the dust particle is unable to cool by thermal radiation or by the thermionic energy flux and as a result the total energy flux is always positive and large, dominated by the thermionically-induced energy flux collection spike from the background electrons. Consistently, when evaporation conditions are reached, the dust completely evaporates away and the dust temperature remains constant for the rest of the simulation, unlike the case of Fig. 4 (c) where the dust particle can still cool when it travels in proximity of the plate.
Figure 6 (e) shows the time evolution of the dust position perpendicular to the plate. As we discussed above, in the direction perpendicular to the plate smaller dust particles are characterized by an equilibrium position (where the electrostatic force and the ion drag balance) further away from the plate and this is shown clearly in Fig. 6 (e): the dust particle is accelerated outside the sheath/Chodura layer by the electrostatic force. From Fig. 6 (f), showing the time evolution of various forces acting on the dust particle, one can see that the ion drag force begins to dominate at s but, because of inertia, only at s the dust particle inverts its motion to return towards the plate. From the perspective of the dust particle survivability, however, this is too late. Traveling outside the sheath/Chodura layer means facing higher energy fluxes and the dust particle evaporates before returning to the plate. From Fig. 6 (g), one can see that the electrostatic force accelerates the particle to about m/s.
At the end of the simulation, the dust particle has traveled approximately mm toroidally and mm poloidally [Fig. 6 (h)], while it gets accelerated to about m/s toroidally and m/s poloidally [Fig. 6 (i)]. The transit distances corresponding to the time where the dust has lost of its mass, s, are about mm toroidally and mm poloidally, respectively. Clearly the dust particle does not move much, and cannot transit across our reference divertor poloidally to find safer regions of the tokamak. Although as in the case of a micrometer dust particle the mass redeposition occurs in the direction of the plasma flow, most of the dust mass is lost within a distance comparable to that of a promptly redeposited sputtered tungsten ion and we classify this case as local redeposition. The critical poloidal injection velocity to transit the reference divertor poloidally without reaching evaporation conditions is km/s.
In summary, a sub-micrometer dust particle cannot survive in a tokamak divertor plasma characterized by an energy flux perpendicular to the plate MW/m2 and redeposits its material locally.
IV.2.3 Supra-micrometer dust particle
Next, we study the dynamics of a tungsten dust particle with m (all the other parameters are unchanged). We note that our model treats the dust particle as a point particle, therefore its application for bigger particles that tend to move closer to the plate is somewhat marginal. Nevertheless, we will still use it to get some sense on dust transport in this parameter regime.
The evolution of the dust potential is shown in Fig. 7 (a), complemented by the dust currents in Fig. 7 (b). Qualitatively the dynamics resembles that of Figs. 4 and 6. In the initial part of the dynamics the dust particle is mostly negatively charged, with a negative peak of V and the current balance occurs mainly through the collection of background electrons and ions. As the dust particle heats up, the later part of the dynamics is strongly influenced by thermionic emission: for ms the dust remains positively charged and the current balance is mainly through the background electron collection and thermionic emission. The evolution of the dust temperature and of the dust radius is shown in Fig. 7 (c). Initially the temperature rises sharply, with melting conditions reached at ms and complete melting achieved at ms. After ms, the dust particle starts to evaporate and the temperature exhibits oscillations associated with the bouncing motion, similar to those in Fig. 4. The dust radius shrinks to about m by the end of the simulation. The energy fluxes on the dust grain are shown in Fig. 7 (d), showing the electron heat flux collection spike induced by thermionic emission as the main mechanism heating the dust particle, contrasted by thermal radiation and the thermionic emission energy flux as the main cooling mechanisms. As in Fig. 4 (d), the dust particle is able to cool when moving close to the plate. In general, however, the energy fluxes normalized to are comparatively smaller for the bigger dust particle.
Figure 7 (e) shows the dust motion perpendicular to the plate. The motion is mostly concentrated in the sheath since, as we have argued above, bigger particles have equilibrium position between the electrostatic force and the ion drag closer to the plate. Bigger excursions inside the Chodura layer occur in the later part of the dynamics, when thermionic emission becomes important. The forces acting on the dust particle are shown in Fig. 7 (f). The velocity perpendicular to the plate, shown in Fig. 7 (g), rises slowly to a peak of approximately m/s. The Weber number remains small for the whole simulation, , indicating that the dust droplet can bounce on the divertor plate.
Figure 7 (h) shows the dust transit distances parallel to the plate: at the end of the simulation the dust particle has traveled about cm toroidally and cm poloidally. This indicates that the dust particle can transit across our reference poloidal divertor length to move out of the divertor strike points, and survive. By the time this happens, ms, the dust radius is m corresponding to a mass loss redeposited non-locally. Because of the bigger size, the dust velocity parallel to the plate is much smaller than that of the micrometer particle studied in Fig. 4, peaking at m/s toroidally and m/s poloidally [Fig. 7 (i)].
In summary, supra-micrometer dust particles with m in a divertor plasma characterized by an energy flux perpendicular to the plate MW/m2 can survive partially, therefore causing a net loss of divertor material and some non-local redeposition.
V Conclusions
We have studied dust transport in a tokamak plasma. Our model includes a dust charging equation, the dust equation of motion, the dust heating equation and an equation for dust mass loss in the framework of the OML theory, and is similar to other dust transport models used in the literature Ticos et al. (2006); Pigarov et al. (2005); Smirnov et al. (2007); Martin et al. (2008); Bacharis et al. (2010); Ratynskaia et al. (In Press).
Our focus is on dust survivability and its impact on the PMI problem. Therefore we have considered small dust injection velocities perpendicular to the divertor plate, and the dust particles remain confined in the magnetized sheath where the energy fluxes are lower. The dust transport model is therefore coupled with a (one dimensional) model of the magnetized sheath which stems from the Braginskii fluid equations. It features an equation for the conservation of the total energy flux perpendicular to the plate, which is used to derive sheath profiles consistent with a prescribed energy flux upstream. We have studied two classes of magnetized sheath equilibria. The first is characterized by the upstream energy flux MW/m2, and is relevant to current short-pulse tokamaks. The second has MW/m2, and is relevant to next generation long-pulse tokamaks like ITER or DEMO.
We have shown that micrometer dust particles can survive with relative ease near the divertor plates when MW/m2, since they can cool efficiently by thermal radiation. The situation is completely different when MW/m2, where the survivability and transport of micrometer particles are drastically reduced. Specifically, for MW/m2 and small dust injection velocities, we have shown that
-
•
small size dust particles ( m) cannot survive and redeposit their material locally;
-
•
medium size dust particles ( m) mostly cannot survive and redeposit their material non-locally. Since the dust always moves in the direction of the poloidal plasma flow, this leads to a poloidal net mass migration across the divertor;
-
•
large size dust particles ( m) can survive partially, leading to a net loss of divertor material and non-local redeposition.
The dust injection speed is obviously critical for survival. A large injection velocity normal to the plate leads to destruction, as the dust particle meets higher energy fluxes. A large poloidal injection velocity improves the chances for survival. Our calculations indicate that poloidal velocities of the order of km/s are necessary for a tungsten microparticle to transit across the divertor poloidally without evaporating.
The picture just described needs to be complemented by the material science perspective to provide the characteristic dust size and injection speed relevant to long-pulse tokamaks, but can be used to draw some general conclusions. For instance, if the characteristic dust size generated in ITER is m, our study indicates that large quantities of dust should not be accumulated in the machine and the dust safety limits might not be a problem. On the other hand, the non-local redeposition and the related net poloidal mass migration suggest that matching local erosion and redeposition profiles might be a challenge. A characteristic dust size of m is possibly worse, since large quantities of dust could potentially be accumulated in addition to the challenge of matching local erosion and redeposition profiles.
Acknowledgements.
This work was funded by the U.S. Department of Energy Office of Science, Office of Fusion Energy Sciences, under the auspices of the National Nuclear Security Administration of the U.S. Department of Energy by Los Alamos National Laboratory, operated by Los Alamos National Security LLC under contract DE-AC52-06NA25396.References
- Suzuki et al. (2003) S. Suzuki, Y. Ueda, K. Tokunaga, K. Sato, and M. Akiba (ANS, USA, 2003), vol. 44, pp. 41–8.
- Ihli et al. (2006) T. Ihli, S. Hermsmeyer, C. Kohly, and P. Norajitra, in Proceedings of the Seventh International Symposium on Fusion Nuclear Technology ISFNT-7 Part A (2006), vol. 81 A, pp. 121–126.
- Winter (2000) J. Winter, Physics of Plasmas 7, 3862 (2000).
- Rudakov et al. (2007) D. L. Rudakov, W. Jacob, K. Krieger, A. Litnovsky, V. Philipps, W. P. West, C. P. C. Wong, S. L. Allen, R. J. Bastasz, J. A. Boedo, et al., Physica Scripta 2007, 29 (2007).
- Grisolia et al. (2009) C. Grisolia, S. Rosanvallon, P. Sharpe, and J. Winter, Journal of Nuclear Materials 386-388, 871 (2009).
- Krasheninnikov et al. (2004) S. Krasheninnikov, Y. Tomita, R. Smirnov, and R. Janev, Physics of Plasmas 11, 3141 (2004).
- Shu et al. (2007) W. M. Shu, G.-N. Luo, and T. Yamanishi, Journal of Nuclear Materials 367, 1463 (2007).
- Nishijima et al. (2003) D. Nishijima, M. Ye, N. Ohno, and S. Takamura, Journal of Nuclear Materials 313-316, 97 (2003).
- Nishijima et al. (2004) D. Nishijima, M. Ye, N. Ohno, and S. Takamura, Journal of Nuclear Materials 329-333, 1029 (2004).
- Baldwin and Doerner (2008) M. J. Baldwin and R. P. Doerner, Nuclear Fusion 48, 035001 (2008).
- Krasheninnikov et al. (2011) S. I. Krasheninnikov, R. D. Smirnov, and D. L. Rudakov, Plasma Physics and Controlled Fusion 53, 083001 (2011).
- Roth et al. (2009) J. Roth, E. Tsitrone, A. Loarte, T. Loarer, G. Counsell, R. Neu, V. Philipps, S. Brezinsek, M. Lehnen, P. Coad, et al., Journal of Nuclear Materials 390-391, 1 (2009).
- Pigarov et al. (2005) A. Pigarov, S. Krasheninnikov, T. Soboleva, and T. Rognlien, Physics of Plasmas 12, 122508 (2005).
- Smirnov et al. (2007) R. D. Smirnov, A. Y. Pigarov, M. Rosenberg, S. I. Krasheninnikov, and D. A. Mendis, Plasma Physics and Controlled Fusion 49, 347 (2007).
- Martin et al. (2008) J. Martin, M. Bacharis, M. Coppins, G. Counsell, and J. Allen, Europhysics Letters 83, 65001 (2008).
- Bacharis et al. (2010) M. Bacharis, M. Coppins, and J. E. Allen, Physics of Plasmas 17, 042505 (2010).
- Ratynskaia et al. (In Press) S. Ratynskaia, L. Vignitchouk, P. Tolias, I. Bykov, B. H. Bergsaker, A. M. Litnovsky, N. den Harder, and E. Lazzaro, Nuclear fusion (In Press).
- Braginskii (1965) S. I. Braginskii, in Reviews of Plasma Physics, edited by M. A. Leontovich (Consultants Bureau, New York, 1965), vol. 1, pp. 205–311.
- Shukla and Mamun (2001) P. K. Shukla and A. A. Mamun, Introduction to Dusty Plasma Physics (Institute of Physics Publishing, Philadelphia, 2001).
- Mott-Smith and Langmuir (1926) H. Mott-Smith and I. Langmuir, Physical Review 28, 727 (1926).
- Daugherty et al. (1992) J. Daugherty, R. Porteous, M. D. Kilgore, and D. Graves, Journal of Applied Physics 72, 3934 (1992).
- Bruining (1954) H. Bruining, Physics and applications of secondary electron emission (New York, McGraw-Hill, 1954).
- Ashcroft and Mermin (1976) N. W. Ashcroft and N. D. Mermin, Solid State Physics (Philadelphia, Saunders College, 1976).
- Sodha and Guha (1971) M. Sodha and S. Guha, Advan. Plasma Phys. 4, 219-309 (1971).
- Delzanno et al. (2004) G. L. Delzanno, G. Lapenta, and M. Rosenberg, Physical Review Letters 92, 350021 (2004).
- Delzanno et al. (2005) G. L. Delzanno, A. Bruno, G. Sorasio, and G. Lapenta, Physics of Plasmas 12, 62102 (2005).
- Hutchinson (2003) I. H. Hutchinson, Plasma Physics and Controlled Fusion 45, 1477 (2003).
- Khrapak and Morfill (2004) S. A. Khrapak and G. E. Morfill, Phys. Rev. E 69, 066411 (2004).
- Tang and Delzanno (2010) X. Z. Tang and G. L. Delzanno, Journal of Fusion Energy 29, 407 (2010).
- Ticos et al. (2006) C. M. Ticos, Z. Wang, G. L. Delzanno, and G. Lapenta, Physics of Plasmas 13, 103501 (2006).
- Chodura (1982) R. Chodura, Physics of Fluids 25, 1628 (1982).
- Duarte and Clemente (2011) V. N. Duarte and R. A. Clemente, Physics of Plasmas 18, 043504 (2011).
- Yu et al. (2009) J. Yu, D. Rudakov, A. Pigarov, R. Smirnov, N. Brooks, S. Muller, and W. West, Journal of Nuclear Materials 390–391, 216 (2009).
- Rosenberg et al. (2008) M. Rosenberg, R. D. Smirnov, and A. Y. Pigarov, Journal of Physics D: Applied Physics 41, 015202 (2008).
- Wang et al. (2008) Z. Wang, C. H. Skinner, G. L. Delzanno, S. I. Krasheninnikov, G. M. Lapenta, A. Y. Pigarov, P. Shukla, R. D. Smirnov, C. M. Ticos, and W. P. West, in New Aspects of Plasma Physics, edited by P. K. Shukla (Singapore: World Scientific, 2008).
- Rudakov et al. (2009) D. Rudakov, A. Litnovsky, W. West, J. Yu, J. Boedo, B. Bray, S. Brezinsek, N. Brooks, M. Fenstermacher, M. Groth, et al., Nuclear Fusion 49, 085022 (2009).
- Yarin (2006) A. Yarin, Annual Review of Fluid Mechanics 38, 159 (2006).
- Rein (2002) M. Rein, in Drop-Surface Interactions, edited by M. Rein (Springer-Verlag, New York, 2002), vol. CISM Courses and Lectures No.456.
- Coppins (2010) M. Coppins, Phys. Rev. Lett. 104, 065003 (2010).