AXIAL ROTATION AND TURBULENCE OF RR ab STARS: THE PETERSON CONUNDRUM REVISITED
Abstract
We calibrate and then use the relation between equivalent width () and full–width–half–maximum () of metallic absorption lines in the spectra of RR Lyrae stars to estimate a new upper limit of on their axial equatorial rotational velocities, and to derive the variations of macroturbulent velocities in their atmospheres during pulsation cycles. Finally, we present a simple way to estimate macroturbulent/rotational velocity from FWHM of the cross–correlation function.
1 Introduction
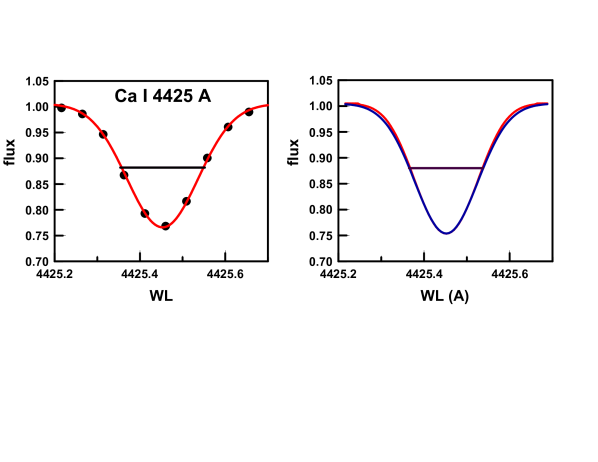
The variations of turbulence during the pulsation cycles of classical cepheids (Bersier & Burki [1996]), Breitfellner & Gillet [1993]), Stifft & Gillet [1994])) and RR Lyrae stars (Chadid & Gillet [1996]), Fokin, Gillet, & Chadid [1999]) are well-documented.The definition of turbulence and the procedure for extraction of this quantity from stellar line profiles varies from study to study. However, the disentanglement of turbulence, however defined, from the broadening produced by axial rotation is problematic in all of these investigations, which, for the most part, have been concerned with the generation of turbulence and its effect on pulsating atmospheres. This problem of disentanglement is well-illustrated in Fig. 1. The left panel shows, first of all, that the observed profile of an unsaturated line in the spectrum of a typical RR ab star is well matched by a Gaussian; there is no obvious rotational signature. The right panel shows why: two convolutions with identical but very different Maxwell and rotation parameters (blue: , ; red: , ) can barely be distinguished in the wings. Because rotation, whatever its magnitude, is virtually constant during a pulsation cycle, any variation of with phase must be due to other motions in RR ab atmospheres. Rotation must be pursued by different means.
Peterson, Carney, & Latham ([1996]) found a common minimum value of near phase = 0.35 derived from cross correlation of metal lines for radial velocity during the pulsation cycles of twenty seven RR ab stars. They attributed the variation of during pulsation cycles to variable turbulence and the minimum to an unresolvable combination of turbulence and axial rotation. Thus, they estimated an upper limit of for the RR Lyrae stars, a result similar to that obtained for classical cepheids by Bersier & Burki ([1996]) . However, approximately 1/3 of the blue horizontal branch () stars with , immediately adjacent to the RR Lyrae domain, have (Behr, [2003a] ,[2003b] , Kinman et al. [2000], Peterson, Rood, & Crocker [1995] and references therein, Recio-Blanco et al. [2004]). Robust HB theory tells us that all of these stars will traverse the RR Lyrae domain with apparent rotational velocities above the RR Lyrae upper limit on their paths to the AGB (Preston [2011]); hence the “Peterson Conundrum”. We pursue this puzzle by study of an independent sample of RR ab stars chosen to investigate the dynamical properties of RR Lyrae envelopes during their pulsation cycles, as described in Preston ([2011]).
2 OBSERVATIONS AND PROCEDURES
2.1 Observational Data
The observational data for this study are provided by thousands of echelle spectra of three dozen bright RR ab star acquired with the du Pont 2.5 m telescope of the Las Campanas Observatory in the years 2006 – 2012. Typical spectral resolution is at . Exposure times never exceed 600 s () and the typical signal-to-noise ratio is S/N 20. For stable RR ab stars studied here S/N at nearly all phases can be improved by factors of two or more by co-addition of spectra in small intervals of phase. Reductions that produce wavelength calibrated, extractions of duPont echelle spectra are described in detail by For, Sneden, & Preston ([2011]) and need not be repeated here. Analysis of this large collection of RR ab spectra is a work in progress.
2.2 Procedure
The first goal of our analysis is to derive estimates of line–of–sight velocity dispersion caused by the combined effects of macroturbulence and axial rotation after removal of all other measurable sources of line broadening. These are, in the order in which they will be discussed: (1) pressure and/or collision damping, (2) instrumental broadening, (3) microturbulence, and (4) thermal broadening.
Microturbulence, produced by motions on length scales smaller than the photon mean free path, intensifies unsaturated absorption lines, and can be derived from spectrum analysis (Gray [2008] , Sneden [1984]). We use the microturbulence values of For, Sneden, & Preston ([2011]) in the calculations that follow. Macroturbulence, produced by motions on length scales large compared to the photon mean free path, broadens all absorption lines. Macroturbulent velocities must exceed the microturbulent velocities of Richardson’s ([1920]) eddies in the Siedentopf model of turbulent convection (Woolley & Stibbs [1953], [1989]) to which we subscribe.
We approximate corrections for the various line broadening processes enumerated above by use of the additive property, , of the Maxwell velocity distribution, itself a variant of the Gaussian error function. We assume that turbulent velocities on all length scales are isotropic throughout the metallic line-forming regions of an RR Lyrae star. We adopt the observable parameter as our measure of line broadening. To begin, we remove the effect of instrumental broadening, characterized by , from adopted average of unsaturated lines to obtain , according to
| (1) |
in which is an average value described below. We then convert to Maxwell velocity dispersion using Maxwell dispersion . All further corrections are made in units of line-of sight velocity dispersion, .
The first correction, removal of instrumental broadening, must be made to the average value rather than to individual lines, because some measured widths of unsaturated lines may be narrower than . These narrowest lines properly belong in the average, but they cannot be corrected for instrumental broadening by the formalism of eq. (2.1).
was evaluated as follows: was measured for some three dozen lines in each of thirty four ThAr spectra chosen at random from observations made in the years 2006 – 2012. From these measures mean values and resolution were calculated for each spectrum. We use the average value of all these measurements, , in equation (2.1) to calculate for each RR Lyr spectrum.
2.3 Estimation of
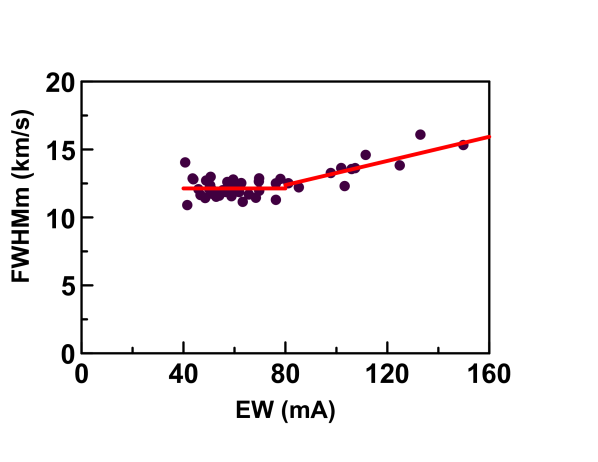
We estimate by use of a variant of the empirical procedure of Hosford et al. [2009], illustrated in Fig. 2 by a plot of versus for lines of Fe I and Fe II in the spectrum of the metal–poor subgiant HD 140283. We compiled a list of 200 unblended metal lines (mostly due to Fe I) on from inspection of solar lines identified by Moore, Minnaert, & Houtgast ([1966]). We expect that these lines are unblended in our spectra of RR Lyrae stars and in HD 140283. We utilize these data to make two estimates of the full width half maximum parameter of unsaturated lines, during the pulsation cycles of our RR ab stars:
(1) The plateau–Hosford et al. identify lines with as their “plateau” of lines with constant , free of detectable damping wings . We calculate the average in the more restrictive domain . Our upper bound of upper bound seems to better identify the onset of a linear increase of present in our RR Lyr spectra. Furthermore, we do not use lines with measured less than because of a “personal equation” effect that we encountered in our measurements of weak lines, i.e., those for which central depth is comparable to continuum noise in our spectra. Accidental negative noise in both wings tends to produce broad indistinct absorption features that GWP frequently regarded as unmeasurable. On the other hand, accidental positive noise in both wings tends to produce apparently narrow, easily measurable features. These effects become more important with decreasing spectral resolution and decreasing S/N, and they are particularly bothersome near minimum light, when the lines become very broad. Decisions about measurability will vary from one person to another, hence “personal equation”. The systematic effect produced by these biases, derived from measurements of hundreds of lines in 6 RR ab stars at all pulsation phases, is small but significant (); it appears to vary with pulsation phase, going through a minimum near phase 0.35.
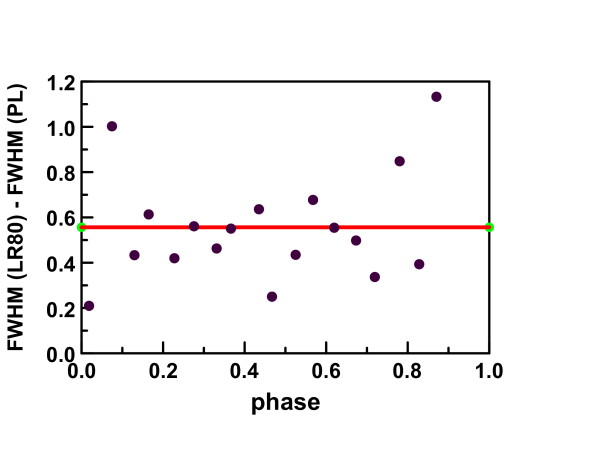
(2) The damping regression at produces a second, entirely independent estimate of . This regression is based on stronger, more accurately measured lines than those that lie on the plateau, and its numerical value depends on the choice of the upper limit of plateau . We illustrate the utility of this estimate in Fig. 3, which is a plot of the average differences (regression at ) for observations of six RR ab stars binned at intervals of 0.05 P. The average difference, , is comparable to the measurement errors of both quantities. We adopt the average of these two estimates as our final value of for each measured spectrum.
2.4 Measurements of and for six stable RR ab
We have adequate observational data to construct versus relations throughout their pulsation cycles for the six stable RR ab stars identified as calibration stars (calib) in the first column of Table 1. For each star we sorted observations gathered over several years with respect to phase and combined observations made in small phase intervals () to increase S/N. The average number of phase bins per star is 13. For each spectrum we measured and for all usable lines in our list by use of the IRAF/splot package.
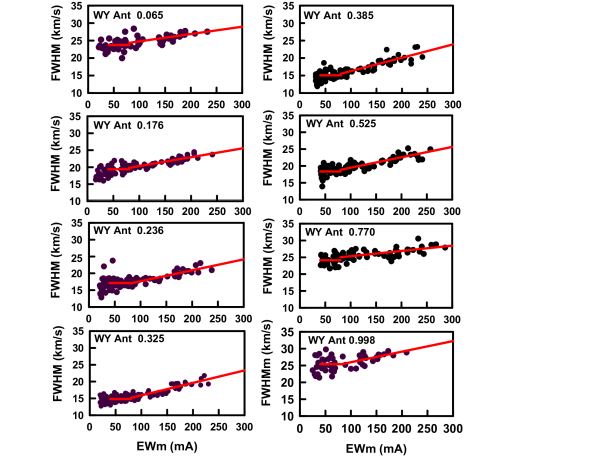
The versus diagrams produced by these measurements provide direct evidence of the variation of macroturbulence with pulsation phase. We illustrate this variation by the montage of diagrams at eight phases during the pulsation cycle of WY Ant in Fig. 4. The plateau value of is high ( ) immediately after maximum light (phase = 0.065) in the top left panel. It reaches a minimum () in the bottom left panel and increases steadily during the remainder of declining light in the right panels Note the similarity of the plateau value of and the damping regression value at .
2.5 The Behaviors of Macroturbulence and Microturbulence in RR ab stars
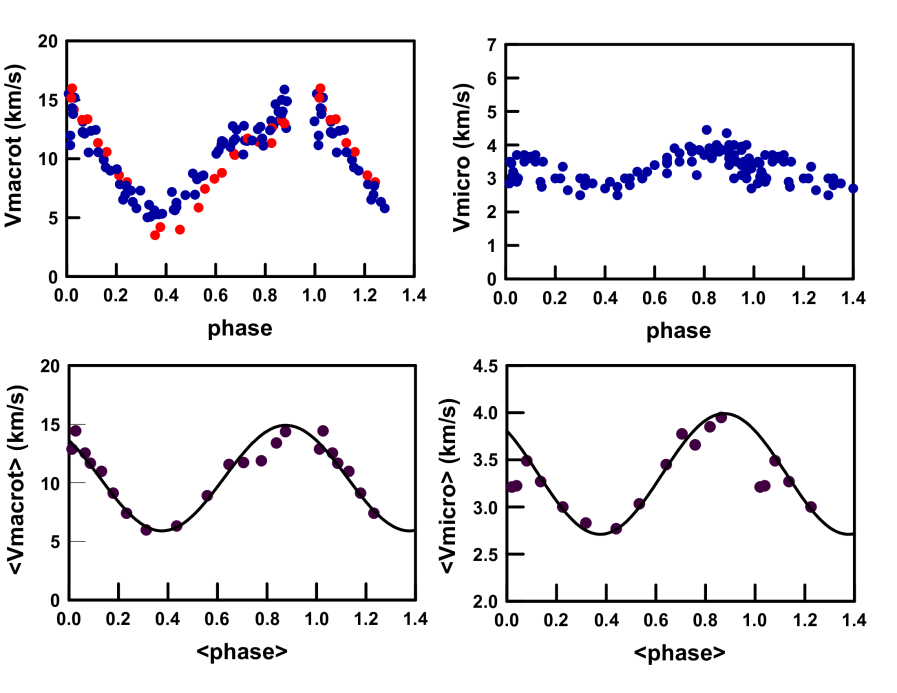
We used = to remove instrumental broadening via , and converted to velocity dispersion for each spectrum of each star. Finally we removed microturbulent and thermal velocity dispersions by use of smoothed variations of these quantities, constructed from data for stable RR ab by For, Sneden & Preston ([2011]), to obtain , which we present in the upper left panel of Fig. 5. Blue symbols denote six stars with [Fe/H] -1.0; red symbols denote two stars (HH Pup and W Crt) for which [Fe/H] -1.0. The pulsation amplitudes of the two metal-rich stars are larger than average, so it is not clear at present whether their apparently different behavior in Fig. 5 is an amplitude effect or a metallicity effect. We defer discussion of this question until the analysis of our metal–rich sample (see Table 1) has been completed.
We use the subscript “macrot” of the vertical axis label to remind the reader that contains the combined effects of macroturbulence and unknown axial rotation. The concurrent behavior of microturbulent velocity, for the stable RR ab stars of For, Sneden, & Preston ([2011]) is shown in the upper right panel of Fig. 5. The forms of the two variations are similar, differing only in scale. This is shown in the bottom two panels of Fig. 5, where mean values for data in small intervals of phase (0.05 P) are plotted with superposed sine waves that were adjusted to fit the observations in the phase interval 0.1 phase 0.7. Macroturbulence and microturbulence vary together. Their ratio at all phases of the pulsation cycle satisfies the minimal requirement of Richardson ([1920]), Kolmogorov ([1941]), and the Siedentopf model (Woolley & Stibbs [1953]) that always exceeds . We offer the ratio of sine waves for and plotted in Fig. 6 as an approximate, idealized description of the way a primitive “spectrum of turbulence”, as described by two length scales, varies in RR ab atmospheres during their pulsation cycles.
3 Use of of the cross correlation function as a proxy for macroturbulence
The derivation of is laborious, while the of the cross correlation function can be calculated in a few seconds. To take advantage of this simplicity, we extend our calculations of to the larger sample of RR ab in Table 1 by calculating the ratio for all spectra of our calibration stars. Note that contains width contributions from line widths of our template star, CS 22874-009, (Preston & Sneden [2000]) and from the instrumental width of the duPont echelle spectrograph, in addition to the widths of lines in the individual RR ab spectra, i.e., our ratio is specific to our template star and our spectrograph.
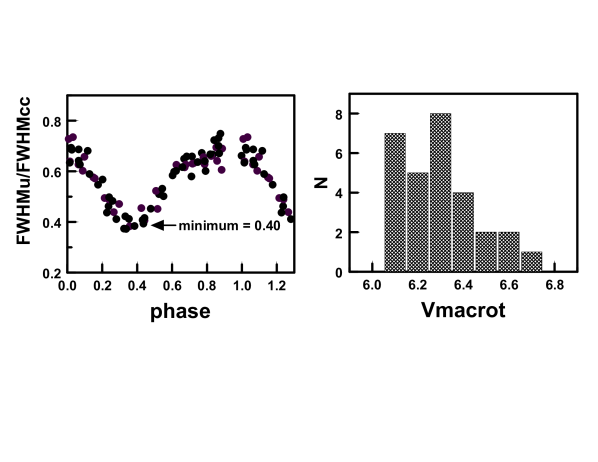
Inspection of the left panel of Fig. 7 reveals that the ratio varies smoothly during the RR ab pulsation cycle with scatter from star to star that scarcely exceeds measurement errors. We use the well–defined minimum value of the ratio, 0.40, that occurs near phase = 0.38 as a multiplier by which to estimate , hence by the procedures of Sect. 2, using observed near phase = 0.38 given in the 4th column of Table 1. The right panel of Fig. 7 is a histogram of the values calculated in this manner.
Three features of this distribution are worthy of mention:
First, the average values of used to calculate for the samples [Fe/H] -1.0 and [Fe/H] -1.0 in Table 1, are virtually identical, and , respectively. Accordingly, we combined the two abundance groups to make the histogram in the right panel of Fig. 7.
Second, the dispersion in is very small, as noted by Chadid & Preston ([2013]), and the formal dispersion for calculated therefrom is only . We adopt as our new lower limit on axial rotation of the RR ab stars, taken from the average, , of the values in column 7 of Table 1 and displayed in the right panel of Fig. 7. We know of no other class of stars that exhibits such a small range of axial rotation.
Finally, if axial rotation were the principal contributor to , its distribution would have to be skewed toward smaller values of as a consequence of random inclinations of rotation axes. In fact, the distribution is slightly skewed toward larger velocities. We suggest that the average rotation of RR ab stars is much lower than our formal limit of . Our results are similar to those found for the classical cepheids by Bersier & Burki (1996): no skew toward smaller velocities and no evidence for rotation. The senior author (GWP) cannot resist the temptation to indulge in “I told you so!” by reference to his forgotten paper of a half–century ago entitled “The Effect of Rotation on Pulsation in the Hertzsprung Gap” (Preston [1965]).
4 Summary
We have shown how measurements of the full–width–half–maxima of absorption lines in the spectra of RR ab stars, combined with literature information about microturbulent and thermal velocities, can be used to constrain the axial rotations of RR ab stars. We derive a new upper limit , and we argue that our distribution of derived widths suggests a much lower limit, virtually no rotation at all. In view of the much larger (seemingly secure) rotations reported for many stars immediately adjacent to the instability strip, we conclude that, upon entering the instability strip on their paths to the , horizontal branch stars either expel the angular momentum from their surface layers or hide it in their interiors.
If all RR c stars share the narrow lines of RR ab stars, then angular momentum must be lost during entry into the instability strip on the short time–scale required for incipient RR c pulsation to reach its limit cycle (Stellingwerf [1984]). However, if angular momentum loss occurs more gradually during RR c evolution, the time scale could be many orders of magnitude longer . Constraints on RR c rotation by measurements of RR c line widths in the manner reported in this paper will be required to distinguish between these possibilities.
In conclusion, we are happy to report that the Peterson Conundrum is still alive and well. Just like the honoree of this symposium, Sylvie Vauclair!
References
- [2003a] Behr, B 2003a, ApJS, 149, 67
- [2003b] Behr, B 2003b, ApJS, 149, 101
- [1996] Bersier, D & Burki, G 1996, A&A, 306, 417
- [1993] Breitfellner, MG, & Gillet, D 1993, 277, 553
- [2013] Chadid, M & Preston, GW 2013 MNRAS, 434, 552
- [1996] Chadid, M & Gillet, D 1996, A&A, 315, 475
- [1999] Fokin, AB, Gillet, D, & Chadid, M 1999, A&A, 344, 930
- [2011] For, B-Q, Sneden, C, & Preston, GW 2011, ApJS, 197, 29
- [2008] Gray, DF 2008, The Observation and Analysis of Stellar Photospheres (Cambridge: Cambridge U. Press)
- [2009] Hosford, A., Ryan, SG, Garcia Perez, AE, Norris, JE, Olive, KA 2009, A&A, 493, 601
- [2000] Kinman et al, 2000, A&A, 364, 102
- [1941] Kolmogorov, AN. 1941, Proc USSR Acad. Sci., 30, 299
- [1966] Moore, CE, Minnaert MG, & Houtgast, J 1966, The Solar Spectrum 2935 Å to 8770 Å. NBS Monograph (Washington: US Govt. Printing Office)
- [1995] Peterson, RC. Rood RT, & Crocker, DA 1995, ApJ, 453, 214
- [1996] Peterson, RC, Carney, BW, & Latham, DW 1996, ApJ, 465, L47
- [1965] Preston, GW 1965, Veroeffentlichungen der Remeis-Sternwarte zu Bamberg, Nr. 40, p. 155
- [2011] Preston, GW 2011, AJ, 141, 6
- [2000] Preston, GW, & Sneden, C 2000, AJ, 120, 1014
- [2004] Recio-Blano et al. 2004, A&A, 417, 597
- [1920] Richardson, LF 1920, Proc. Roy. Solc. London A, 686, 354
- [1989] , G 1989, The Fluid Mechanics of Astrophysics and Geophysics, Vol 5, (New York: Gordon & Breach)
- [2013] Sneden, C 2013, www.as.utexas.edu/ chris/moog.html
- [1984] Stellingwerf, RF 1984, ApJ, 284, 712
- [1994] Stifft, MJ, & Gillet, D 1994, ASP Conf. Ser., 64, 745
- [1953] Woolley, R, & Stibbs, DWN 1953, The Outer Layers of a Star (Oxford: Clarendon Press), p. 214
| Star ID | P (d) | [Fe/H] | Vu | |||
| WY Ant (calib) | 0.574 | -1.66 | 26.6 | 10.7 | 6.4 | 6.2 |
| BS Aps | 0.582 | -1.33 | 26.7 | 10.8 | 6.5 | 6.2 |
| XZ Aps (calib) | 0.587 | -1.57 | 26.0 | 10.5 | 6.3 | 6.1 |
| DN Aqr | 0.634 | -1.63 | 27.4 | 11.1 | 6.6 | 6.4 |
| SW Aqr | 0.459 | -1.24 | 25.9 | 10.5 | 6.3 | 6.0 |
| RR Cet | 0.553 | -1.52 | 27.2 | 11.0 | 6.6 | 6.4 |
| RV Cet | 0.623 | -1.32 | 26.7 | 10.8 | 6.5 | 6.2 |
| SX For | 0.605 | -1.62 | 26.1 | 10.5 | 6.3 | 6.1 |
| DT Hya (calib) | 0.568 | -1.22 | 26.8 | 10.8 | 6.5 | 6.3 |
| V Ind | 0.480 | -1.50 | 26.1 | 10.5 | 6.3 | 6.1 |
| SS Leo | 0.626 | -1.83 | 25.8 | 10.4 | 6.3 | 6.0 |
| ST Leo | 0.478 | -1.29 | 25.9 | 10.5 | 6.3 | 6.0 |
| Z Mic (calib) | 0.587 | -1.28 | 28.1 | 11.3 | 6.8 | 6.6 |
| RV Oct (calib) | 0.571 | -1.34 | 26.6 | 10.7 | 6.4 | 6.2 |
| UV Oct | 0.543 | -1.61 | 25.9 | 10.5 | 6.3 | 6.0 |
| AT Ser | 0.747 | -2.05 | 26.3 | 10.6 | 6.4 | 6.1 |
| VY Ser (calib) | 0.714 | -1.82 | 27.0 | 10.9 | 6.5 | 6.3 |
| V1645 Sgr | 0.553 | -1.74 | 26.5 | 10.7 | 6.4 | 6.2 |
| W Tuc | 0.642 | -1.64 | 27.1 | 10.9 | 6.6 | 6.3 |
| CD Vel | 0.574 | -1.58 | 26.5 | 10.7 | 6.4 | 6.2 |
| AS Vir | 0.553 | -1.49 | 26.5 | 10.7 | 6.4 | 6.2 |
| W Crt | 0.412 | -0.50 | 26.9 | 10.9 | 6.5 | 6.3 |
| DX Del | 0.473 | -0.56 | 28.2 | 11.4 | 6.8 | 6.6 |
| V445 Oph | 0.397 | -0.23 | 28.0 | 11.3 | 6.8 | 6.6 |
| AV Peg | 0.390 | -0.14 | 26.6 | 10.7 | 6.4 | 6.2 |
| HH Pup | 0.391 | -0.69 | 26.3 | 10.6 | 6.4 | 6.1 |
| AN Ser | 0.522 | -0.04 | 27.4 | 11.1 | 6.6 | 6.4 |
| ST Vir | 0.411 | -0.88 | 27.2 | 11.0 | 6.6 | 6.4 |
| UU Vir | 0.476 | -0.82 | 26.7 | 10.8 | 6.5 | 6.2 |