11email: tpeng@eso.org 22institutetext: Excellence Cluster Universe, Boltzmannstr. 2, D-85748 Garching, Germany 33institutetext: INAF-Osservatorio Astrofisico di Arcetri, Largo E. Fermi 5, I-50125 Firenze, Italy 44institutetext: Univ. Bordeaux, LAB, UMR 5804, F-33270, Floirac, France 55institutetext: CNRS, LAB, UMR 5804, F-33270, Floirac, France 66institutetext: National Radio Astronomy Observatory, 520 Edgemont Road, Charlottesville, VA 22903, USA 77institutetext: Department of Earth and Space Sciences, Chalmers University of Technology, Onsala Space Observatory, SE-439 92 Onsala, Sweden 88institutetext: Joint ALMA Observatory (JAO) and European Southern Observatory, Alonso de Córdova 3107, Vitacura, Santiago, Chile 99institutetext: JBCA, Alan Turing Building, School of Physics and Astronomy, University of Manchester, Manchester M13 9PL, UK
Silicon isotopic abundance toward evolved stars and its application for presolar grains ††thanks: This publication is based on data acquired with the Atacama Pathfinder Experiment (APEX). APEX is a collaboration between the Max-Planck-Institut für Radioastronomie, the European Southern Observatory, and the Onsala Space Observatory. Herschel is an ESA space observatory with science instruments provided by European-led Principal Investigator consortia and with important participation from NASA.
Abstract
Aims. Galactic chemical evolution (GCE) is important for understanding the composition of the present-day interstellar medium (ISM) and of our solar system. In this paper, we aim to track the GCE by using the 29Si/30Si ratios in evolved stars and tentatively relate this to presolar grain composition.
Methods. We used the APEX telescope to detect thermal SiO isotopologue emission toward four oxygen-rich M-type stars. Together with the data retrieved from the Herschel science archive and from the literature, we were able to obtain the 29Si/30Si ratios for a total of 15 evolved stars inferred from their optically thin 29SiO and 30SiO emission. These stars cover a range of masses and ages, and because they do not significantly alter 29Si/30Si during their lifetimes, they provide excellent probes of the ISM metallicity (or 29Si/30Si ratio) as a function of time.
Results. The 29Si/30Si ratios inferred from the thermal SiO emission tend to be lower toward low-mass oxygen-rich stars (e.g., down to about unity for W Hya), and close to an interstellar or solar value of 1.5 for the higher-mass carbon star IRC+10216 and two red supergiants. There is a tentative correlation between the 29Si/30Si ratios and the mass-loss rates of evolved stars, where we take the mass-loss rate as a proxy for the initial stellar mass or current stellar age. This is consistent with the different abundance ratios found in presolar grains. Before the formation of the Sun, the presolar grains indicate that the bulk of presolar grain already had 29Si/30Si ratios of about 1.5, which is also the ratio we found for the objects younger than the Sun, such as VY CMa and IRC+10216. However, we found that older objects (up to possibly 10 Gyr old) in our sample trace a previous, lower 29Si/30Si value of about 1. Material with this isotopic ratio is present in two subclasses of presolar grains, providing independent evidence of the lower ratio. Therefore, the 29Si/30Si ratio derived from the SiO emission of evolved stars is a useful diagnostic tool for the study of the GCE and presolar grains.
Key Words.:
ISM: abundances, ISM: molecules, Submillimeter: ISM, Stars: late-type1 Introduction
As the eighth most abundant element in the Universe, silicon plays an important role in understanding nucleosynthesis and Galactic chemical evolution (GCE). The main isotope 28Si is mainly produced by early-generation massive stars that become Type II supernovae. The other two stable isotopes 29Si and 30Si are mainly produced by O and Ne burning in massive stars or by slow neutron capture (the s-process) and by explosive burning in the final stages of stellar evolution, that is, the asymptotic giant branch (AGB) phase for low- and intermediate-mass stars and supernova explosions for high-mass stars (see, e.g., Woosley & Weaver, 1995; Timmes & Clayton, 1996; Alexander & Nittler, 1999).
In the thermally pulsing AGB (TP-AGB) phase, thermonuclear runaways are periodically caused by He burning in a thin shell between the H-He discontinuity and the electron-degenerate C-O core. This energy goes directly into heating the local area and raises the pressure, which initiates an expansion and a series of convective and mixing events (Herwig, 2005; Iben & Renzini, 1983). During the so-called third dredge-up, the products of He burning and the s-process elements are brought to the surface, e.g., 12C, which can lead to the formation of S- (C/O1) or C-type (C/O1) stars. In conjunction with dredge-ups, the Si-bearing molecules (e.g., SiC and SiO) formed in the stellar surface eventually condense onto dust grains or actually form dust grains. The silicon isotopic ratios will be preserved and go through the journey in the interstellar medium (ISM) until they are used again to form stars.
AGB stars can produce almost all grains of interstellar dusts, and their dust production is one order of magnitude higher than that of supernovae in the Milky Way (see, e.g., Dorschner & Henning, 1995; Gehrz, 1989). It is generally believed that oxygen-rich M-type stars produce mainly silicate grains and carbon-rich stars mainly carbonaceous grains (Gilman, 1969). However, the actual situation may be more complicated and grain composition may change during the AGB phase (Lebzelter et al., 2006).
The measured 29Si/30Si ratios in the ISM are about 1.5 (Wolff, 1980; Penzias, 1981), very close to that of the solar system (Anders & Grevesse, 1989; Asplund et al., 2009). However, near-infrared SiO observations of Tsuji et al. (1994) showed that some evolved stars have 29Si/30Si ratios slightly below 1.5. Our new observations of SiO isotopologues in the radio domain with the APEX and Herschel telescopes confirm the low 29Si/30Si ratios for oxygen-rich M-type stars.
| Line | Frequency | Instrument | ||
|---|---|---|---|---|
| (MHz) | (K) | (″) | ||
| 28SiO =0, =6–5 | 260518.02 | 43.8 | 24.0 | APEX-1 |
| 29SiO =0, =6–5 | 257255.22 | 43.3 | 24.3 | APEX-1 |
| 30SiO =0, =6–5 | 254216.66 | 42.7 | 24.5 | APEX-1 |
| 29SiO =0, =7–6 | 300120.48 | 57.7 | 20.8 | APEX-2 |
| 30SiO =0, =7–6 | 296575.74 | 57.0 | 21.1 | APEX-2 |
| 29SiO =0, =26–25 | 1112832.94 | 721.6 | 19.8 | HIFI |
| 30SiO =0, =26–25 | 1099711.49 | 713.1 | 19.6 | HIFI |
2 Observations
Observations of the SiO isotopologue lines toward VY CMa, Ceti, W Hya, and R Leo were carried out with the 12-meter APEX telescope in 2011 September and 2012 December on Llano de Chajnantor in Chile. The single-sideband heterodyne receivers APEX-1 and APEX-2 (Vassilev et al., 2008; Risacher et al., 2006) were used during the observations. The focus and pointing of the antenna were checked on Jupiter and Mars. The pointing and tracking accuracy were about 2″ and 1″, respectively. The extended bandwidth Fast Fourier Transform Spectrometer (XFFTS; Klein et al., 2012) backend was mounted and configured into a bandwidth of 2.5 GHz and 0.1 km s-1 resolution. In addition, the Herschel/HIFI data of VY CMa, Ceti, W Hya, Cyg, R Cas, and R Dor were retrieved from the Herschel science archive.
All spectra were converted to the main beam brightness temperature unit, = (=), using the forward efficiencies () and the beam-coupling efficiencies () from the APEX documentation222http://www.apex-telescope.org. The beam efficiencies of HIFI were taken from the Herschel/HIFI documentation webpage. We adopted of 0.75, 0.73, and 0.76 for the APEX-1, 2, and HIFI data, respectively. All data were reduced and analyzed by using the standard procedures in the GILDAS333http://www.iram.fr/IRAMFR/GILDAS/ package. The SiO spectroscopic data were taken from the Cologne database for molecular spectroscopy (CDMS444http://www.astro.uni-koeln.de/cdms/) and are listed in Table 1.
3 Results and discussion
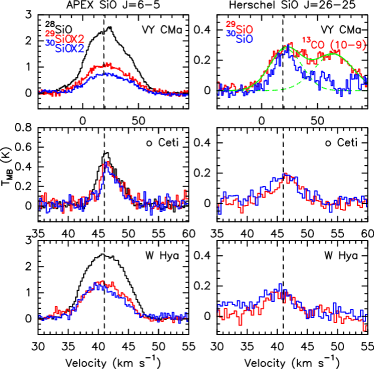
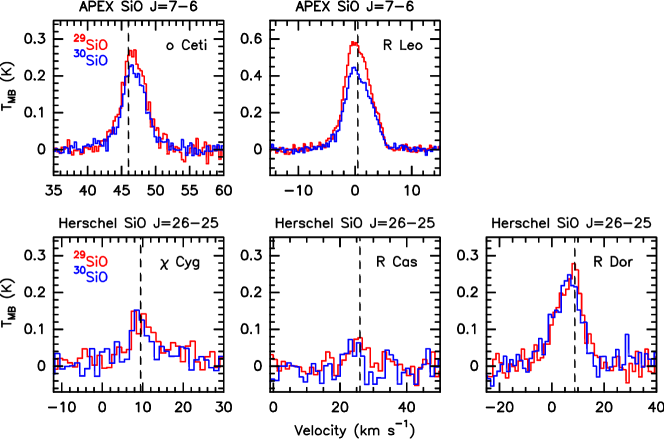
The APEX and Herschel SiO isotopologue spectra of the selected evolved stars (with both APEX and Herschel detections) are shown in Figures 1 and 4, and the SiO intensity measurements are summarized in Table 2 in the appendix. The 29SiO and 30SiO emission is expected to be optically thin because the abundance of the main isotopologue 28SiO is at least ten times larger than 29SiO in the ISM (Penzias, 1981). Additionally, the solar and terrestrial 29Si/30Si ratios are close to 1.5 (de Biévre et al., 1984; Anders & Grevesse, 1989). The 29SiO/30SiO =26–25 intensity ratios observed with the Herschel/HIFI instrument for Ceti and W Hya (Fig. 1) are consistent with the low- results obtained with the APEX telescope. Fitting two Gaussian profiles to the 29SiO line and the partially blended 13CO =10–9 line in the HIFI VY CMa spectra, we obtained a 29SiO/30SiO =26–25 intensity ratio of 1.40.1, also consistent with the low- APEX data. Because the upper-state energies of =26–25 lines are about 700 K higher than those of =6–5, the constant 29SiO/30SiO intensity ratio of low- and high- transitions indicates optically thin 29SiO and 30SiO emission with similar distributions and excitation conditions. In addition, we believe that the 29SiO and 30SiO emission obtained for our sample stars is unlikely to be dominated by masing effects due to the lack of any narrow spectral features. Therefore, the 29SiO/30SiO intensity ratio directly reflects the abundance ratio between 29Si and 30Si in the circumstellar envelopes of these stars, assuming any differences in chemical fractionation or photodissociation are minor. The derived 29Si/30Si ratios are listed in Table 3 in the appendix.
Silicon isotope ratios
Since 28Si is mainly produced via the -process in massive stars, the 28Si in low-mass stars comes from their natal clouds. Additionally, stable isotopes 29Si and 30Si can be formed via slow neutron capture (the s-process) in both low- and high-mass stars. It has been shown by Timmes & Clayton (1996) that 28Si is the primary isotope in the GCE with a roughly constant silicon-to-iron ratio over time, independent of the initial metallicity. On the other hand, neutron-rich isotopes 29Si and 30Si show strong dependence on the composition and initial metallicity.
In Figure 2, the 29Si/30Si ratios derived from the SiO integrated intensities are plotted against the mass-loss rates for different evolved stars, and they show a tendency to increase with increasing mass-loss rates. The two supergiants VY CMa and NML Cyg and the carbon star IRC+10216 have 29Si/30Si ratios close to the solar value of 1.5. The rest of the samples (see also Table 3) have 29Si/30Si ratios , for example, the 29Si/30Si for W Hya. There are two possibilities for the different 29Si/30Si ratios seen in our sample. One is that the silicon isotope ratios merely reflect the initial chemical composition of the environment where these stars were born and the different ratios are the results of different ages, which mainly depend on their masses and metallicities. The other possibility is that the stellar evolution can significantly change the silicon isotope ratios.
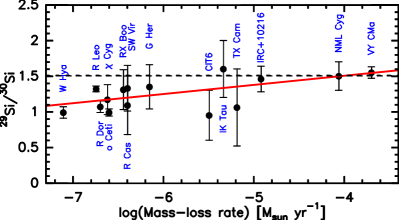
The first possibility implies that the 29Si/30Si ratio in the ISM has not significantly changed in the past 4.6 Gyr when the Sun was born. In comparison, VY CMa and IRC+10216 were born and years ago, assuming masses of 25–32 and 3–5 , respectively (see Portinari et al., 1998). We found stars that we believe to be significantly older than the Sun, such as W Hya (based on the mass-loss rate, initial mass, and current age), to have lower 29Si/30Si ratios. For instance, with an initial mass of 1–1.2 , W Hya has an age of 5–10 Gyr. In either the lower or higher age limit, this suggests a significant change in the 29Si/30Si ratio between the pre- and post-solar period: the 29Si/30Si ratios in the ISM increase from about 1 to 1.5 between 5 to 10 Gyr ago and remain roughly constant after the Sun was born. Given the time it takes low-mass stars to evolve onto the AGBs, it is unlikely that many low-mass AGB stars existed in our Galaxy between 5 and 10 Gyr ago, even if they had been formed at the beginning of the Milky Way formation. It is therefore also unlikely that low-mass AGB stars were significant contributors to the GCE in the presolar era. The 29Si/30Si ratio in the presolar era may be due to supernovae and/or other massive evolved stars. We note that the stars in our sample only trace the 29Si/30Si ratio of their natal clouds if they do not modify this ratio via nucleosynthesis (see, e.g., Zinner et al., 2006).
The second possibility for different 29Si/30Si ratios is that the stars in the AGB phase can significantly modify these ratios. Some of the M-type stars will become C-type stars after several dredge-up episodes with higher mass-loss rates toward the end of the AGB phase (see, e.g., Herwig, 2005). If the 29Si/30Si ratio can be modified by the -process in the He-burning shell in evolved stars, it must be done efficiently because the AGB time scale is short (a few times 106 yr, see Marigo & Girardi, 2007). However, the modeling results of Zinner et al. (2006) show that the 29Si/30Si ratios of low-mass stars do not significantly change during the AGB phase (see also the discussion of Decin et al., 2010).
29Si/30Si ratio in presolar grains
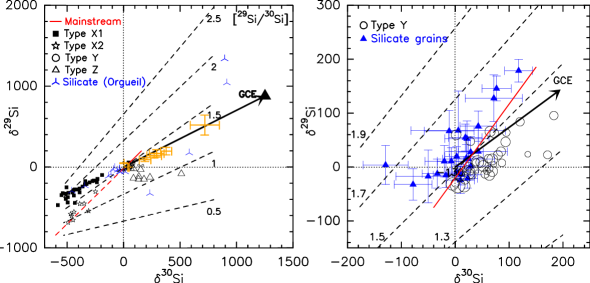
Assuming the 29Si/30Si ratio in the gas-phase SiO is the same as it condenses onto dust grains or forms silicates, this primitive 29Si/30Si ratio may be carried by those grains when they are incorporated into new stellar and planetary systems. The 29Si/30Si ratio in presolar SiC grains has been studied in some meteorites (e.g., the Murchison meteorite, see the review by Zinner, 1998). They have been categorized into different types (e.g., X, Y, and Z) according to their silicon isotopic anomalies. Most of the SiC grains found in meteorites are the so-called mainstream grains (93%, see Fig. 3), i.e., those with a slope of 1.34 on a silicon three-isotope plot (Hoppe et al., 1994). On the other hand, SiO is expected to condense onto the dust formation regions near O-rich stars, or via a possible heteromolecular nucleation of Mg, SiO, and H2O to form silicates (Goumans & Bromley, 2012). In the studies of Si isotopes in primitive silicate grains, the Si isotopic compositions of the majority of presolar silicates are similar to the SiC mainstream grains (Nguyen et al., 2007; Mostefaoui & Hoppe, 2004; Nagashima et al., 2004; Vollmer et al., 2008), indicating that the amount of Si isotopes locked in the SiC grains and the -SiO group in silicates may be similar; an example are the Orgueil silicate grains shown in Figure 3.
Most of the presolar grains have 29Si/30Si ratios around 1.5, but evidence of lower 29Si/30Si ratios are also found in presolar SiC grains, for instance, types X2 and Z in Figure 3. The type Z grains may have originated from a nearby evolved star (see also Zinner et al., 2006). Additionally, the type X grains have been proposed to have a supernova origin (e.g., Amari et al., 1992; Hoppe et al., 1994), and have two or more subgroups (see, e.g., Hoppe et al., 1995; Lin et al., 2002) with possible different stellar origins. According to the study of Lin et al. (2002) on the Qingzhen enstatite chondrite, the subgroups X1 and X2 show somewhat similar N and O isotopes abundance ratios, but have different slopes on the Si three-isotope plot (0.7 vs. 1.3 for X1 and X2, respectively). Because the metallicity in the local ISM is increasing owing to the GCE, Si and Si will increase with time accordingly. It is possible that the lower 29Si/30Si ratios seen in X2 grains may have originated from a population of evolved stars (such as the evolved stars with lower 29Si/30Si ratios). On the other hand, X1 grains with higher 29Si/30Si ratios are likely to be attributable to Type II supernovae (see also Zinner & Jadhav, 2013). Moreover, it is important to point out that the higher-mass (about 3 ) evolved star sample from Tsuji et al. (1994) can be well explained by the GCE (Fig. 3), considering the possible uncertainty in the 29Si/30Si ratio estimate for the present-day ISM.
4 Conclusions
We investigated the 29Si/30Si ratios of 15 evolved stars from the thermal SiO isotopologue emission obtained by the APEX and Herschel telescopes and from the literature. The inferred 29Si/30Si ratios tend to be lower among the older low-mass O-rich stars. Because the 29Si/30Si ratios are not significantly modified during the AGB phase and the contributions from the low-mass AGB stars are less important due to their long lifetimes, the lower 29Si/30Si ratios imply different enrichment of 29Si and 30Si in the Galaxy between 5 to 10 Gyr ago with a nearly constant value of 1.5 after that. Noting that presolar grains may also have 29Si/30Si ratios lower than 1.5 (i.e., Type X2 and Z), we suggest that these grains could have been produced by one or more AGB stars with masses high enough to evolve onto the AGB in time to contribute to presolar grains.
Acknowledgements.
We thank the Swedish APEX staff for preparing observations and the referee for helpful comments. MGR gratefully acknowledges support from the National Radio Astronomy Observatory (NRAO). The National Radio Astronomy Observatory is a facility of the National Science Foundation operated under cooperative agreement by Associated Universities, Inc. IdG acknowledges the Spanish MINECO grant AYA2011-30228-C03-01 (co-funded with FEDER fund).References
- Alexander & Nittler (1999) Alexander, C. M. O., & Nittler, L. R. 1999, ApJ, 519, 222
- Amari et al. (1992) Amari, S., Hoppe, P., Zinner, E., & Lewis, R. S. 1992, ApJ, 394, L43
- Amari et al. (2001) Amari, S., Nittler, L. R., Zinner, E., Lodders, K., & Lewis, R. S. 2001, ApJ, 559, 463
- Anders & Grevesse (1989) Anders, E., & Grevesse, N. 1989, Geochim. Cosmochim. Acta., 53, 197
- Asplund et al. (2009) Asplund, M., Grevesse, N., Sauval, A. J., & Scott, P. 2009, ARA&A, 47, 481
- Cho & Ukita (1998) Cho, S.-H., & Ukita, N. 1998, AJ, 116, 2495
- Choi et al. (2008) Choi, Y. K., et al. 2008, PASJ, 60, 1007
- De Beck et al. (2010) De Beck, E., Decin, L., de Koter, A., Justtanont, K., Verhoelst, T., Kemper, F., & Menten, K. M. 2010, A&A, 523, A18
- de Biévre et al. (1984) de Biévre, P., Gallet, M., Holden, N. E., & Lynus Barnes, I. 1984, Journal of Physical and Chemical Reference Data, 13, 809
- Decin et al. (2010) Decin, L., et al. 2010, A&A, 516, A69
- Dorschner & Henning (1995) Dorschner, J., & Henning, T. 1995, A&A Rev., 6, 271
- Gehrz (1989) Gehrz, R. 1989, Interstellar Dust, 135, 445
- Gilman (1969) Gilman, R. C. 1969, ApJ, 155, L185
- Goumans & Bromley (2012) Goumans, T. P. M., & Bromley, S. T. 2012, MNRAS, 420, 3344
- Herwig (2005) Herwig, F. 2005, ARA&A, 43, 435
- Hoppe et al. (1994) Hoppe, P., Amari, S., Zinner, E., Ireland, T., & Lewis, R. S. 1994, ApJ, 430, 870
- Hoppe et al. (1995) Hoppe, P., Strebel, R., Pungitore, B., Eberhardt, P., Amari, S., & Lewis, R. S. 1995, Lunar and Planetary Institute Science Conference Abstracts, 26, 621
- Hoppe et al. (1997) Hoppe, P., Annen, P., Strebel, R., Eberhardt, P., Gallino, R., Lugaro, M., Amari, S., & Lewis, R. S. 1997, ApJ, 487, L101
- Iben & Renzini (1983) Iben, I., Jr., & Renzini, A. 1983, ARA&A, 21, 271
- Justtanont et al. (2012) Justtanont, K., et al. 2012, A&A, 537, A144
- Kim et al. (2010) Kim, H., Wyrowski, F., Menten, K. M., & Decin, L. 2010, A&A, 516, A68
- Klein et al. (2012) Klein, B., Hochgürtel, S., Krämer, I., et al. 2012, A&A, 542, L3
- Lebzelter et al. (2006) Lebzelter, T., Posch, T., Hinkle, K., Wood, P. R., & Bouwman, J. 2006, ApJ, 653, L145
- Lin et al. (2002) Lin, Y., Amari, S., & Pravdivtseva, O. 2002, ApJ, 575, 257
- Marigo & Girardi (2007) Marigo, P., & Girardi, L. 2007, A&A, 469, 239
- Mostefaoui & Hoppe (2004) Mostefaoui, S., & Hoppe, P. 2004, ApJ, 613, L149
- Nagashima et al. (2004) Nagashima, K., Krot, A. N., & Yurimoto, H. 2004, Nature, 428, 921
- Nguyen et al. (2007) Nguyen, A. N., Stadermann, F. J., Zinner, E., Stroud, R. M., Alexander, C. M. O., & Nittler, L. R. 2007, ApJ, 656, 1223
- Penzias (1981) Penzias, A. A. 1981, ApJ, 249, 513
- Portinari et al. (1998) Portinari, L., Chiosi, C., & Bressan, A. 1998, A&A, 334, 505
- Risacher et al. (2006) Risacher, C., et al. 2006, A&A, 454, L17
- Schöier et al. (2013) Schöier, F. L., Ramstedt, S., Olofsson, H., Lindqvist, M., Bieging, J. H., & Marvel, K. B. 2013, A&A, 550, A78
- Timmes & Clayton (1996) Timmes, F. X., & Clayton, D. D. 1996, ApJ, 472, 723
- Tsuji et al. (1994) Tsuji, T., Ohnaka, K., Hinkle, K. H., & Ridgway, S. T. 1994, A&A, 289, 469
- Ukita & Kaifu (1988) Ukita, N., & Kaifu, N. 1988, IAU Colloq. 108: Atmospheric Diagnostics of Stellar Evolution, 305, 51
- Vassilev et al. (2008) Vassilev, V., et al. 2008, A&A, 490, 1157
- Vollmer et al. (2008) Vollmer, C., Hoppe, P., & Brenker, F. E. 2008, ApJ, 684, 611
- Wolff (1980) Wolff, R. S. 1980, ApJ, 242, 1005
- Woods et al. (2003) Woods, P. M., Schöier, F. L., Nyman, L.-Å., & Olofsson, H. 2003, A&A, 402, 617
- Woosley & Weaver (1995) Woosley, S. E., & Weaver, T. A. 1995, ApJS, 101, 181
- Zhang et al. (2009) Zhang, Y., Kwok, S., & Dinh-V-Trung 2009, ApJ, 691, 1660
- Zhang et al. (2012) Zhang, B., Reid, M. J., Menten, K. M., Zheng, X. W., & Brunthaler, A. 2012, A&A, 544, A42
- Zinner (1998) Zinner, E. 1998, Annual Review of Earth and Planetary Sciences, 26, 147
- Zinner et al. (2006) Zinner, E., Nittler, L. R., Gallino, R., Karakas, A. I., Lugaro, M., Straniero, O., & Lattanzio, J. C. 2006, ApJ, 650, 350
- Zinner et al. (2007) Zinner, E., et al. 2007, Geochim. Cosmochim. Acta., 71, 4786
- Zinner & Jadhav (2013) Zinner, E., & Jadhav, M. 2013, ApJ, 768, 100
| Source | 28SiO 6–5 | 29SiO 6–5 | 30SiO 6–5 | 29SiO 7–6 | 30SiO 7–6 | 29SiO 26–25 | 30SiO 26–25 |
|---|---|---|---|---|---|---|---|
| (K km s-1) | (K km s-1) | (K km s-1) | (K km s-1) | (K km s-1) | (K km s-1) | (K km s-1) | |
| VY CMa | 107.40.3 | 24.80.3 | 16.30.3 | … | … | 10.10.7 | 6.40.3 |
| R Cas | … | … | … | … | … | 0.40.1 | 0.30.1 |
| Ceti | 2.30.1 | 1.00.1 | 0.80.1 | 1.20.1 | 1.00.1 | 0.90.1 | 1.20.1 |
| Cyg | … | … | … | … | … | 0.90.1 | 0.80.1 |
| R Dor | … | … | … | … | … | 3.20.2 | 3.00.2 |
| R Leo | … | … | … | 3.30.1 | 2.50.1 | … | … |
| W Hya | 18.40.1 | 4.80.1 | 4.30.1 | … | … | 1.10.1 | 1.20.1 |
| Source | 29Si/30Sia𝑎aa𝑎aThe 29Si/30Si ratios are the mean values (equally weighted) | Spectral Type | Stellar Type | Note | |||
|---|---|---|---|---|---|---|---|
| (pc) | (km s-1) | ( yr-1) | |||||
| VY CMa | 1170 | 46.5 | M2/4II | RSG | APEX-1+HIFId𝑑dd𝑑dThe SiO intensity measurements are listed in Table 2. | ||
| NML Cyg | 1610 | 33.0 | M6I | RSG | Tsuji et al. (1994) | ||
| IRC+10216 | 120 | 14.5 | C9,5e | MIRA | Tsuji et al. (1994) | ||
| IK Tau | 260 | 18.5 | b𝑏bb𝑏bThe Herschel/HIFI data only show a 2- detection of 29SiO and 30SiO =26–25 lines with a ratio of 1.60.8. However, judging from the APEX =8–7 and 7–6 data of Kim et al. (2010), the integrated ratios are also close to 1.6. We note that the baselines in the 30SiO spectra of Kim et al. (2010) may be too low. Therefore, the actual 29SiO/30SiO ratio should be (see also the discussion of Decin et al., 2010, who adopted an abundance ratio of 32 from their modeling results). | M8/10IIe | MIRA | Decin et al. (2010); Kim et al. (2010) | |
| TX Cam | 380 | 21.2 | M8.5 | MIRA | Cho & Ukita (1998) | ||
| CIT 6 | 440 | 20.8 | Ce | SRa | Zhang et al. (2009) | ||
| G Her | 310 | 13.0 | M6III | SRb | Tsuji et al. (1994) | ||
| R Cas | 106 | 13.5 | M7IIIe | MIRA | HIFId𝑑dd𝑑dThe SiO intensity measurements are listed in Table 2. | ||
| SW Vir | 170 | 7.5 | M7III | SRb | Tsuji et al. (1994) | ||
| RX Boo | 155 | 9.0 | M7.5e | SRb | Tsuji et al. (1994) | ||
| Ceti | 107 | 8.1 | M7e | MIRA | APEX-1/2+HIFId𝑑dd𝑑dThe SiO intensity measurements are listed in Table 2. | ||
| Cyg | 149 | 8.5 | c𝑐cc𝑐cThe ratio reported by Ukita & Kaifu (1988) and Tsuji et al. (1994) is about 2.4 with a large uncertainty (same as V1111 Oph) estimated from =2–1, which may be affected by masing effects. Therefore, we estimated the 29SiO/30SiO ratio only from the new HIFI measurements. | S6 | MIRA | HIFId𝑑dd𝑑dThe SiO intensity measurements are listed in Table 2. | |
| R Dor | 45 | 6.0 | M8IIIe | SRb | HIFId𝑑dd𝑑dThe SiO intensity measurements are listed in Table 2. | ||
| R Leo | 130 | 5.0 | M8IIIe | MIRA | APEX-2d𝑑dd𝑑dThe SiO intensity measurements are listed in Table 2. | ||
| W Hya | 77 | 8.5 | M7e | SRa | APEX-1+HIFI d𝑑dd𝑑dThe SiO intensity measurements are listed in Table 2. |