Accepted for publication in Phys. Rev. C
Giant dipole resonance width and the universality of the Critical Temperature included Fluctuation Model
Abstract
The universality of the Critical Temperature included Fluctuation Model (CTFM) in explaining the evolution of the giant dipole resonance (GDR) width as a function of angular momentum is examined in the light of recent experimental data on 144Sm and 152Gd. We compare both the data sets with the phenomenological formula based on the CTFM and the thermal shape fluctuation model (pTSFM). The CTFM describes both the data sets reasonably well using the actual ground state GDR width () values, whereas, the pTSFM describes the 144Sm data well but is unable to explain the 152Gd data using a single value of for two excitation energies. These interesting results clearly indicate that the phenomenological CTFM can be used universally to describe the evolution of the GDR width with both angular momentum and temperature in the entire mass region. Moreover, it should provide new insights into the modification of the TSFM.
pacs:
24.30.Cz,24.60.Dr,25.70.GhI Introduction
The study of collective motions in hot and fast rotating nuclei, especially Giant Dipole Resonance (GDR), provides a unique probe to explore the various kinds of structure (triaxial, prolate, oblate, spherical) that the nuclear system can assume at high temperature () and angular momentum () hara01 ; gaar92 ; Snov01 . This vibrational mode of nucleus is described as the out of phase oscillation between the protons and the neutrons. Over the years, intensive experimental studies of the GDR built on highly excited states of nuclei have shown that the GDR width increases with both T and J Kici02 ; Bra04 ; Rama01 ; Matt01 ; Kelly01 ; Dreb01 ; Baum01 ; Kmie01 ; Sri08 . This increase of the GDR width is described reasonably well within the theoretical Thermal Shape Fluctuation Model (TSFM). The TSFM is based on large amplitude thermal fluctuation of nuclear shape under the assumption that the time scale associated with thermal fluctuation is slow compared to GDR vibrations and the observed GDR strength function is the weighted average of all the shapes and orientations alh88 ; Orma01 ; Kus98 . A systematic study of the thermal fluctuation model revealed the existence of a universal scaling law (pTSFM) for the apparent width of the GDR for all T, J and A Kus98 . Although pTSFM shows an increase of the GDR width with T, the model differs significantly from the experimental data at low temperatures ( 1.5 MeV) dipu12 ; supm11 ; heck03 ; cam03 ; dipu10 . In a recent work, a Critical Temperature included Fluctuation Model (CTFM) dipu12 was put forward incorporating an essential modification on the pTSFM, which was found to predict successfully the evolution of the GDR width of many different nuclei with temperature and angular momentum (at least up to T 3.0 MeV and J 60 ). The CTFM emphasizes on a crucial point, overlooked in the pTSFM Kus98 , that the GDR vibration itself induces a quadrupole moment even at = 0 MeV causing the nuclear shape to fluctuate. Therefore, when the giant dipole vibration having its own intrinsic fluctuation is used as a probe to view the thermal shape fluctuations, it is unlikely to feel the thermal fluctuations that are smaller than its own intrinsic fluctuation. As a result, the experimental GDR width should remain nearly constant at the ground state values up to a critical temperature () and the effect of thermal fluctuations should become evident only when they become larger than the intrinsic GDR fluctuations dipu12 . Moreover, the value of in CTFM is always adopted from the existing ground state GDR width systematics of nuclei, whereas, the pTSFM takes the ground state GDR width generally as a free adjustable parameter ( 3.8 MeV for all nuclei) without any proper justification Kus98 .
A recent experimental investigation Ish13 populating the compound nucleus () 144Sm, in the reactions 28Si + 116Cd at E(28Si) 125 and 140 MeV, demonstrates the evolution of the GDR width with at low temperature ( 1.5 MeV). According to this recent experiment, the phenomenological parameterization pTSFM Kus98 predicts the angular momentum dependent GDR width successfully. In this regard, it is worthwhile to mention that previously a few experimental investigations Sri08 ; Drc10 ; Bra04 on J-dependence of the GDR width have indicated the underestimated predictions of the pTSFM in comparison to the experimental data, especially in the higher angular momentum region. To this end, the whole scenario appears to be confusing. Thus, it appears to be interesting and tempting as well to exploit the above mentioned experimental data on 144Sm as a testing ground of the universality of our recently proposed CTFM.
The evolution of the GDR width as a function of angular momentum has also been studied recently for 152Gd at two different excitation energies in the reactions 28Si + 124Sn at E(28Si) 149 and 185 MeV Drc10 . The authors found that two different values of (3.8 and 4.8 MeV) were required in the pTSFM to explain the experimental systematics at the two incident energies (149 and 185 MeV, respectively). They concluded that the contributions from both the inhomogeneous damping and the intrinsic collisional damping processes should be included. They proposed an empirical relation for the increase of the GDR width as a function of and . However, they used the ground state value 3.8 MeV which is much smaller than the actual ground state value of 152Gd hara01 ; gaar92 . Therefore, it is relevant to test the CTFM for 152Gd for the two excitation energies. The present work aims at examing the universality of CTFM by exploiting the data sets on 144Sm and 152Gd and at the same time comparing the predictions of CTFM with those due to pTSFM.
II Data Analysis and Results
In heavy ion fusion reactions, the -rays from the GDR-decay are emitted from various stages of decay cascade of the CN and thus, average values should be considered. The average values of and of the CN for GDR gamma decay should be different and less than those of the initial compound nucleus. On the other hand, it is also not proper to include each step in the CN decay chain for the averaging. Instead, for the purpose, one should incorporate only that part of the decay cascade which is contributing to the GDR -emission, thereby, setting a lower limit for the excitation energy in the CN decay cascade. This lower limit is estimated from the divided plot of the high energy -spectrum when the cutoff in the excitation energy only affects the -emission at very low energies but does not alter the GDR width. The procedure is discussed in detail in Ref wie06 ; Sri08a . Although an average temperature was estimated in Ref Ish13 for 144Sm, it was calculated considering all the decay steps thereby lowering . Moreover, no averaging was performed for the spin distribution and mean J was taken to be that of the initial compound nucleus which further reduced the average value of T. Therefore, and have been re-estimated applying the procedure discussed in Ref wie06 ; Sri08a using a modified version of the statistical model code CASCADE pul77 ; Sri08a . The average T was estimated as =[( - - E)/]1/2, where ) is the energy dependent level density parameter and is the pairing energy. was evaluated with re-estimated using the above mentioned lower limit in E∗, while was calculated by averaging E∗ with corresponding weights over the daughter nuclei in the CN decay cascade for the -emission in the GDR energy range 10-20 MeV. The initial JCN for each fold has been selected from the given J distribution in Ref Ish13 . The energy loss through half the thickness of the target was also included as suggested by the authors by populating the CN at 68 and 80 MeV corresponding to the incident energies of 125 and 140 MeV, respectively. The Ignatuyk-Reisdorf level density prescription Rei81 ; igna75 was adopted keeping the asymptotic level density parameter =A/8.5 MeV-1. The re-estimated values of Javg and Tavg are given in Table-1 and used in both CTFM and pTSFM for proper theoretical explanation.
The T dependence of the GDR width in CTFM by including the GDR induced fluctuation is given as dipu12
| (1) |
where
and the J dependence of CTFM is given by the power law
| (2) |
where L() = 1 + 1.8/[1 + e(1.3-ξ)/0.2] and = J/A5/6.
| ELab | Fold | EGDR | |||||
| (MeV) | () | (MeV) | () | (MeV) | (MeV) | (MeV) | |
| 125 | 9 - 10 | 30.7 | 1.65 | 27 | 1.51 | 15.1 0.3 | 8.2 0.5 |
| 125 | 11 - 12 | 36.2 | 1.60 | 33 | 1.47 | 15.1 0.2 | 8.2 0.4 |
| 125 | 13 - 27 | 45.0 | 1.52 | 41 | 1.36 | 15.2 0.2 | 8.4 0.5 |
| 140 | 7 - 8 | 25.9 | 1.89 | 23 | 1.67 | 15.1 0.3 | 8.8 0.5 |
| 140 | 9 - 10 | 32.4 | 1.84 | 29 | 1.60 | 15.2 0.2 | 8.7 0.5 |
| 140 | 11 - 12 | 38.9 | 1.77 | 35 | 1.56 | 15.1 0.2 | 8.5 0.4 |
| 140 | 13 - 14 | 45.1 | 1.72 | 41 | 1.49 | 15.0 0.3 | 8.3 0.4 |
| 140 | 15 - 16 | 50.9 | 1.65 | 46 | 1.42 | 15.2 0.2 | 9.0 0.5 |
| 140 | 17 - 27 | 59.2 | 1.57 | 54 | 1.32 | 15.5 0.4 | 9.8 0.6 |
II.1 144Sm Nucleus
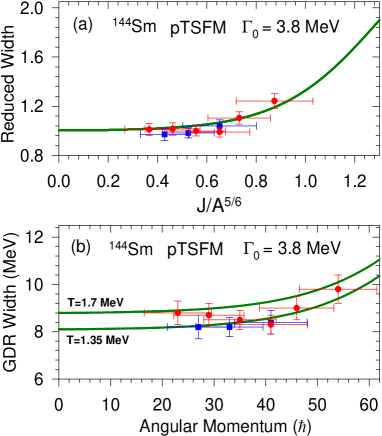
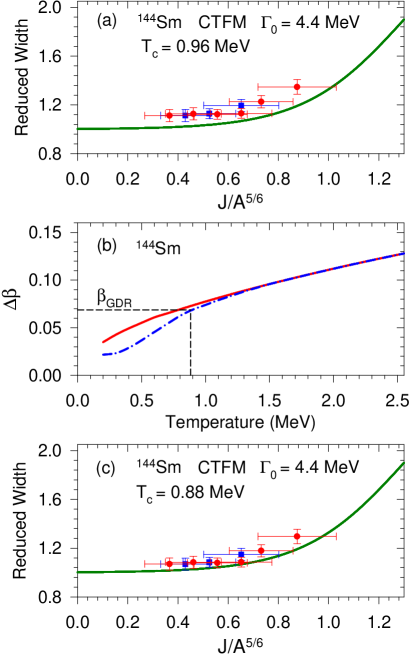
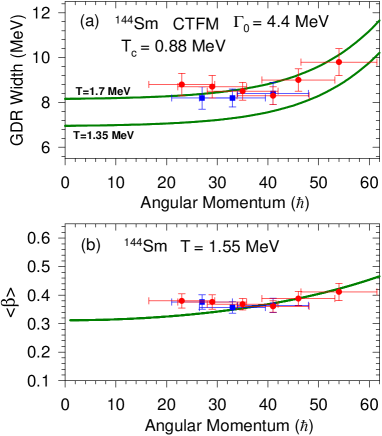
The reduced GDR widths () with the reduced parameter for different temperatures of 144Sm applying the pTSFM formalism are shown in Fig.1(a). The parameter was taken as 3.8 MeV for the calculations. As could be seen, the experimental data are in reasonable agreement with the universal scaling function, as concluded in Ref Ish13 . We also compare the experimental data directly with the predictions of pTSFM as a function angular momentum (Fig.1(b)). The pTSFM calculation was performed for the two extreme temperatures involving the entire T domain of the experimental data (T 1.35 - 1.7 MeV). Interestingly, in this case too, the pTSFM predictions are in good agreement with the experimental data. In order to compare the data with CTFM, the ground state GDR width () of 144Sm was estimated considering the small ground state deformation ( = 0.0874) ram01 and spreading width parameterization s=0.05E jun08 for each Lorentzian. This new empirical formula for the spreading width has been derived by separating the deformation induced widening from the spreading effect and requiring the integrated Lorentzian curves to fulfill the dipole sum rule. The ground state value was estimated to be 4.4 MeV which is consistent with the experimentally measured value of 4.37 0.15 MeV Car74 . The reduced GDR widths with the reduced parameter for CTFM are shown in Fig.2(a). It is observed that CTFM overpredicts the experimental data when is obtained from the systematics ( = 0.96 MeV). Therefore, we estimated the critical temperature directly by comparing the intrinsic GDR fluctuation () due to induced quadrupole moment with the variance of the deformation () due to thermal fluctuations as shown in Fig.2(b). The was calculated using the Boltzmann probability with the volume element , according to the formalism described in Ref Dipu2 while was estimated from the systematic = 0.04 + 4.13/A dipu12 ; Dipu13 . The values were calculated with and without considering shell effect and is represented by dotted-dashed and continuous lines, respectively, in Fig.2(b). As could be seen, and are equal at T = 0.88 MeV (including shell effect) and T = 0.8 MeV (without shell effect). The inclusion of shell effect increases the critical temperature making it closer to the value predicted by the systematics. Using the value of = 0.88 MeV, the reduced widths within the CTFM formalism were calculated and compared with the universal scaling law. It is interesting to note that the experimental data now match well with the CTFM predictions. The data have also been compared directly with the predictions of CTFM as a function of angular momentum. It is evident from Fig.3(a) that CTFM represents the experimental data reasonably well using the calculated and the actual ground state value of the GDR width. Therefore, it can be inferred that the predictions of both pTSFM and CTFM are consistent with the experimental findings in the case of 144Sm. Recently, a universal correlation between the experimental GDR width and the average deformation of the nucleus at finite excitation have been proposed by including the deformation induced by the GDR motion. In order to verify the correlation for 144Sm, the empirical deformation has been estimated from the experimental GDR width applying the correlation given in Ref Dipu13 . The values extracted from the experimental data are directly compared with the TSFM calculation (continuous line) in Fig.3(b). As could be seen, the empirical deformations extracted from the experimental data are in good agreement with the TSFM calculation for 144Sm. This excellent match between experimental data and the TSFM clearly points toward the fact that this universal correlation between and GDR width provides a direct experimental probe to assess the nuclear deformation at finite temperature and angular momentum.
II.2 152Gd Nucleus
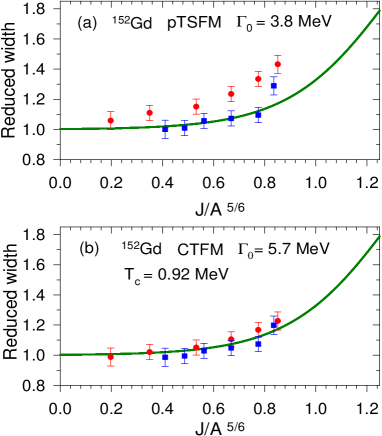
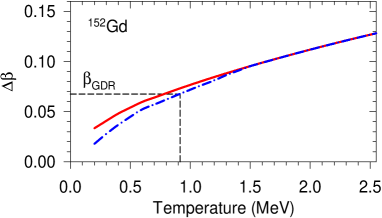
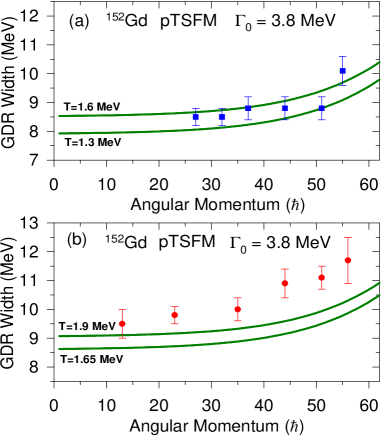
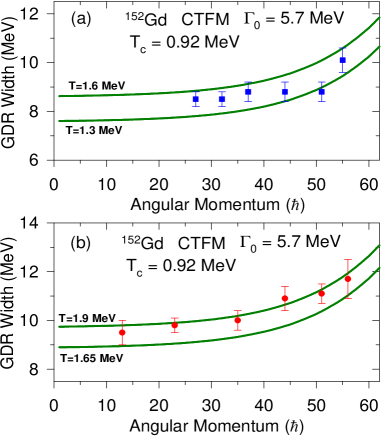
The reduced GDR widths are plotted against the reduced parameter at two different excitation energies in the reactions 28Si + 124Sn at E(28Si) 149 and 185 MeV Drc10 according to the pTSFM formalism and are shown in Fig.4(a). From Fig.4(a) it could be seen that the pTSFM gives good description of the data at 149 MeV but is unable to represent the experimental data at 185 MeV using = 3.8 MeV, as concluded in Ref Drc10 . The ground state GDR width as well as the critical temperature for 152Gd were estimated in order to compare the data with CTFM. Interestingly, and are equal at T = 0.92 MeV (including shell effect) (Fig.5) which is similar to the value predicted by the systematics ( = 0.94 MeV). The value of was estimated as 5.7 MeV considering the large ground state deformation of = 0.206 ram01 and spreading width parameterization s=0.05E jun08 for each Lorentzian. Using these values of and , the reduced GDR widths were calculated and compared with the universal scaling function. It is very interesting to note that the CTFM represents the experimental data remarkably well for both the excitation energies using the actual value (5.7 MeV) of the GDR ground state width (Fig.4(b)). The experimental data have also been compared directly with the predictions of pTSFM and CTFM as a function angular momentum (Fig.6 and Fig.7). The discrepancy of pTSFM is more evident in this representation as it explains the data at 149 MeV but underpredicts the data at 185 MeV using = 3.8 MeV (Fig.6). The CTFM, on the other hand, successfully describes the experimental data for both the incident energies 149 MeV and 185 MeV covering the temperature domain T = 1.3 - 1.6 MeV and T=1.65-1.9 MeV, respectively (Fig.7). As it appears, pTSFM represents the correct trend of J-dependence of the GDR width but is unable to explain the 152Gd data because it does not represent the correct description of the evolution of the GDR width with T. However, it needs to be mentioned that the pTSFM was formulated at a time when there was no experimental data for GDR widths at low temperatures. The empirical deformations extracted from the experimental GDR widths for 152Gd have already been compared with the TSFM in Ref Dipu13 . Interestingly, in this case too, the data and the TSFM were found to be in good agreement with each other. Thus, the good match of the CTFM with the experimental data for both 144Sm and 152Gd clearly points toward the fact that the phenomenological CTFM can be used efficiently to describe the evolution of the GDR width with both T and J in the entire mass region.
III Summary and Conclusions
In conclusion, the CTFM gives good description of the J-dependence of GDR width systematics, for both 144Sm and 152Gd studied at two different excitation energies, using the actual ground state GDR width values for both the nuclei. On the other hand, the pTSFM based on the thermal shape fluctuation model explains the data for 144Sm but cannot represent the 152Gd data for the two excitation energies using a single value of . The good description of the CTFM for both 144Sm and 152Gd as well as the validity of the universal correlation between the average deformation of the nucleus and the TSFM should provide new insights into the modification of the TSFM by including the GDR induced quadrupole moment to explain the GDR width systematics at low T.
References
- (1) M. N. Harakeh and A. van der Woude, Giant Resonances, Fundamental High-frequency Modes of Nuclear Excitation, Clarendon Press, Oxford, 2001.
- (2) J. J. Gaardhoje, Ann. Rev. Nucl. Part. Sci. 42, 483 (1992).
- (3) K. Snover, Ann. Rev. Nucl. Part. Sci. 36, 545 (1986).
- (4) M. Kicińska-Habior et al, Phys. Rev. C 45, 569 (1992).
- (5) A. Bracco et al., Phys. Rev. Lett. 74, 3748 (1995).
- (6) E. Ramakrishnan et al, Phys.Rev. Lett. 76, 2025 (1996).
- (7) M. Mattiuzzi et al, Phys. Lett. B 364, 13 (1995).
- (8) M. P. Kelly et al, Phys. Rev. Lett. 82, 3404 (1999).
- (9) Z. M. Drebi et al, Phys. Rev. C 52, 578 (1995).
- (10) T. Baumann et al, Nucl. Phys. A635, 248 (1998).
- (11) M. Kmiecik et al, Nucl. Phys. A674, 29 (2000).
- (12) S. Bhattacharya et al., Phys. Rev. C 77, 024318 (2008).
- (13) Y. Alhassid et al., Phys. Rev. Lett. 61, 1926 (1988).
- (14) W. E. Ormand et al., Phys. Rev. Lett. 77, 607 (1996).
- (15) D. Kusnezov et al., Phys. Rev. Lett. 81, 542 (1998).
- (16) D. Pandit et al., Phys. Lett. B 713, 434 (2012).
- (17) S. Mukhopadhayay et al., Phys. Lett. B 709, 9 (2012).
- (18) P. Heckman et al., Phys. Lett. B 555, 43 (2003).
- (19) F. Camera et al., Phys. Lett. B 560, 155 (2003).
- (20) D. Pandit et al., Phys. Lett. B 690, 473 (2010).
- (21) I. Mukul et al, Phys. Rev. C 88, 024312 (2013).
- (22) D. R. Chakrabarty et al., J. Phys. G: Nucl. Part. Phys. 37, 055105 (2010).
- (23) O. Wieland et al., Phys. Rev. Lett. 97, 012501 (2006).
- (24) S. Bhattacharya et al., Phys. Rev. C 78, 064601 (2008).
- (25) F. Puhlhoffer et al., Nucl. Phys. A 280, 267 (1977).
- (26) W. Reisdorf et al., Z. Phys. A 300, 227 (1981).
- (27) A. V. Ignatyuk, G. N. Smirenkin, and A. S. Tishin, Sov. J. Nucl. Phys. 21,(1975) 255 [Yad. Fiz. 21, 485 (1975)].
- (28) D. Pandit et al, Phys. Rev. C 81, 061302(R) (2010).
- (29) D. Pandit et al, Phys. Rev. C 87, 044325 (2013).
- (30) S. Raman et al, Atomic data and nuclear data table 78, 1-128 (2001).
- (31) A. R. Junghans et al, Phys. Lett. B 670, 200 (2008).
- (32) P. Carlos et al., Nucl. Phys. A 225, 171 (1974).