Predictions for the Detection of Earth and Mars Trojan Asteroids by the Gaia satellite
Abstract
The European Space Agency Gaia satellite, planned for launch in late 2013, will perform systematic astrometric observations of the whole sky over a five year period. During this mission many thousands of Solar System Objects down to magnitude will be observed including Near-Earth Asteroids and objects at Solar elongations as low as , which are difficult to observe with ground-based telescopes. We simulated the detection of Trojan asteroids in the orbits of Earth and Mars by Gaia. We find that Gaia will not detect the Earth Trojan 2010 TK7 although it will detect any Earth Trojans with diameters larger than 600 m. We also find that Gaia will detect the currently known Mars Trojans and could discover more than 100 new Mars Trojans as small as 400 m in diameter. The results of the Gaia mission will test the predictions about the Mars Trojan asteroid population and lead to greater understanding about the evolution of the Solar System.
keywords:
methods: numerical – methods: observational – methods: statistical – minor planets, asteroids: general – planets and satellites: general – celestial mechanics1 Introduction
The European Space Agency (ESA) Gaia satellite (http://gaia.esa.int) will be launched in late 2013. Gaia will be located near the Earth’s L2 Lagrangian point and will survey the whole sky down to magnitude (Mignard et al., 2007). In the course of its mission several tens of thousands of asteroids will also be repeatedly observed. Observations of Main Belt asteroids and Near Earth Objects by Gaia have been looked at extensively during the past several years in papers such as Mignard et al. (2007) and Tanga & Mignard (2012). However, the sky coverage will also include the regions in the orbits of Earth and Mars where Trojan asteroids are likely to exist (Todd, Coward & Zadnik, 2012; Todd et al., 2012a, b). We anticipate obtaining results from Gaia that will include the discovery of new Trojan asteroids.
Trojan asteroids occupy the L4 and L5 Lagrangian regions in a planet’s orbit about the Sun. These stable regions exist ahead (L4) and behind (L5) the planet in its orbit and appear to be stable on long time-scales in the N-body case of the Solar System (Pilat-Lohinger, Dvorak & Burger, 1999; Scholl, Marzari & Tricarico, 2005). Studying the Trojans provides insight into the evolution of the Solar System. Several thousand Trojans have been found in the orbit of Jupiter, however, among the terrestrial planets only Earth and Mars are known to have Trojans.
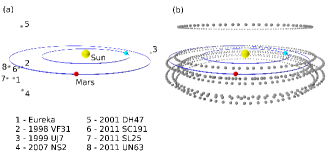
Earth has only one known Trojan (2010 TK7), discovered through examination of data from the WISE satellite (Connors, Wiegert & Veillet, 2011), while Mars presently has five known Trojans (Eureka, 1998 VF31, 1999 UJ7, 2007 NS2 and 2001 DH47) listed by the Minor Planet Center. Previous modelling (Tabachnik & Evans, 1999, 2000a, 2000b) suggests that there may be ten times this number of Mars Trojans with diameter larger than 1 km, and that there may be several hundred with diameter larger than 100 m.
Studies of three of the Mars Trojans (Eureka, 1998 VF31 and 1999 UJ7) by Rivkin et al. (2003, 2007) show that these Trojans appear to have separate origins from one another. Rivkin et al. (2007) suggested that the simplest explanation for the origins of Eureka and 1998 VF31 is that they formed separately in other parts of the inner Solar System as part of larger bodies and that fragments were trapped in the 1:1 resonance with Mars roughly 3.9 Ga ago, thus they are most likely to be long-term residents rather than natives.
Previous work (Todd et al., 2012a, b) considered strategies for discovering Earth and Mars Trojans using ground-based telescopes as well as considering the potential benefits of the Gaia mission to the discovery of additional Trojans. We subsequently ran simulations to model detection characteristics and detection limits for Earth and Mars Trojans with respect to Gaia using a distribution of test particles with a uniform size of 1 km and having Trojan-like orbits (Todd et al., 2012c) and found that these would typically be bright enough (mag. ) but that the relative sky motion may be problematic depending on the observing geometry. In this paper we use the known Trojans to model the detections of additional Earth and Mars Trojans by Gaia. In our simulations we also included the asteroids 2011 SC191, 2011 SL25 and 2011 UN63 which have been proposed as Mars Trojans by de la Fuente Marcos & de la Fuente Marcos (2013). We refer to these proposed Trojans hereafter as Trojans for simplicity.
2 Model
For our simulations we used the known orbital elements for the Earth and Mars Trojans. One challenge that we faced is that we cannot be certain when Gaia will begin observations. We do not yet know the starting epoch of the observations nor can we predict Gaia’s orientation at that epoch. Thus it is not possible to simulate the real detection sequence. To compensate for this in assessing whether Gaia will detect the known Trojans, we cloned the elements to provide 100 test bodies for each of these Trojans. We then modified the cloned elements to compensate for the uncertainty of the starting conditions. Although these orbits would not be stable over a long period the perturbations are trivial over the five years duration of the Gaia mission simulation. The modifications are described in §2.1 and §2.2 for Earth Trojans and Mars Trojans respectively.
2.1 Earth Trojans
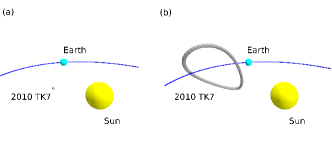
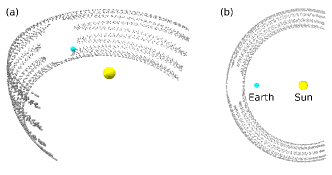
The Earth Trojan 2010 TK7 is co-orbital with Earth. It resides in the L4 (leading) Lagrangian region and so travels around the Sun ahead of Earth in its orbit. Because it is co-orbital with Earth and hence also with Gaia, it was slightly more complex to correct for uncertainties in the starting conditions for the observations by Gaia than the Mars Trojans. Starting from the initial position of 2010 TK7 (Fig. 1a), we created 100 objects by replicating the orbital elements (Table 1) but translating both the ascending node and the mean anomaly. Translating the ascending node spaced the clones of 2010 TK7 at intervals through such that each clone started from the same ecliptic latitude, effectively rotating the orbit orientation. However, this correction on its own produced a set of false positives because it did not take into account that the 2010 TK7 is co-orbital with Earth. Adjusting the mean anomaly in conjunction with the ascending node provided the necessary adjustment to create a set of clones of 2010 TK7 which were co-orbital with Earth. Since Gaia, Earth and 2010 TK7 are co-orbital, by visualising the result in a Gaia-centric frame we see the apparent motion of 2010 TK7 (Fig. 1b). We consider that the drift in position over time as it librates about the L4 point will not significantly affect the results of this simulation given the length of the Gaia mission (5 years) since the period of libration is 395 years (Connors, Wiegert & Veillet, 2011).
| Asteroid | |||||
|---|---|---|---|---|---|
| 2010 TK7 | 1.000248 | 0.19079 | 20882 | 96528 | 45852 |
2.2 Mars Trojans
The Mars Trojans are co-orbital with Mars. The observing geometries for an Earth-based instrument, and for Gaia, change with time due to the different orbital periods of Earth and Mars (and hence the Mars Trojans). For each of the Mars Trojans we took the initial positions (Fig. 2a) and replicated the orbital elements (Table 2) to create 100 instances of each Trojan. Similarly to the simulation for the Earth Trojan 2010 TK7 we translated the ascending node of each group of clones to space them at intervals through (Fig. 2b), thereby rotating the orientation of their orbits. However, unlike the Earth Trojan simulation we did not translate the mean anomaly of the clones as they are not co-orbital with Earth.
| Asteroid | |||||
|---|---|---|---|---|---|
| Eureka | 1.5235160 | 0.0646937 | 2028289 | 24506953 | 9541530 |
| 1998 VF31 | 1.5241558 | 0.1003765 | 3129733 | 22133011 | 31055717 |
| 1999 UJ7 | 1.5245294 | 0.0392950 | 1674860 | 34738708 | 4835302 |
| 2007 NS2 | 1.5237155 | 0.0540248 | 1862167 | 28249888 | 17693881 |
| 2001 DH47 | 1.5237644 | 0.0347226 | 2439962 | 14742910 | 1759104 |
| 2011 SC191 | 1.5238022 | 0.0441686 | 1874444 | 579590 | 19634215 |
| 2011 SL25 | 1.5239213 | 0.1144574 | 2149666 | 942731 | 5329126 |
| 2011 UN63 | 1.5237402 | 0.0645860 | 2036251 | 22357138 | 16529725 |
3 Results
Gaia will not directly produce images of each source. For these objects, since the brightness is typically at magnitudes below , a window 6 x 6 pixels centred on the source will be assigned when an object is detected. However if the along-scan motion is greater than 3.5 mas s-1 the object will drift out of this window, resulting in a loss of signal. The median absolute along-scan velocity for Main Belt asteroids is 7 mas s-1 (Tanga & Mignard, 2012) which is a drift of about half a pixel during a single CCD crossing. A similar case holds for the across-scan motion although the pixel dimensions (59 mas x 177 mas) mean that a drift across-scan up to 10.5 mas s-1 will result in the object remaining within the window by the time the object has crossed the CCD array. The absolute across-scan velocity for Main Belt asteroids is typically less than 15 mas s-1 (Tanga & Mignard, 2012). Previous results for the detection of Earth and Mars Trojans by Gaia (Todd et al., 2012c) found that the along-scan and across-scan velocities for Earth and Mars Trojans are much higher than Main Belt asteroids. This has the implication that they will frequently drift out of the window during a crossing, resulting in signal degradation.
3.1 Earth Trojans
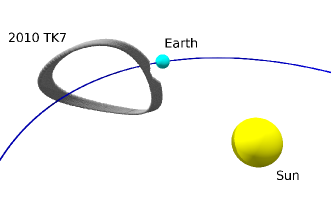
After replicating the orbital parameters for 2010 TK7 (Table 1) and simulating observations by Gaia we plotted the observed positions of the clones relative to Earth (and Gaia) (Fig. 3). The Solar elongations of these positions range between and (Table 3) and the distance varies between 0.18 AU and 0.87 AU.
The apparent magnitude of an Earth Trojan with a diameter of 1 km ranges between and , assuming an albedo of 0.20 (Todd et al., 2012a). This variation depends on both phase angle and distance, with distance having the greater effect. Our simulation results for the Earth Trojan 2010 TK7 indicate that it will not be detected by Gaia in spite of its proximity to Earth. The Earth Trojan 2010 TK7 has a diameter of only m (Connors, Wiegert & Veillet, 2011). The consequence of this smaller size is that its brightness is correspondingly reduced, ranging from to (Table 3). As a result 2010 TK7 is always too faint to be detected by Gaia.
| Asteroid | Distance from | Solar | Magnitude |
| Earth (AU) | elongation | ||
| 2010 TK7 |
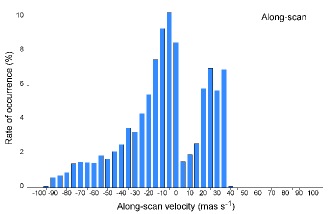
Using the simulation data to consider the implications for observing a larger Earth Trojan in the same orbit we find that the along-scan (Fig. 4) and across-scan (Fig. 5) velocities are considerably greater than Main Belt asteroids. The median absolute along-scan velocity of 2010 TK7 (Fig. 4) is mas s-1, almost six times that of the Main Belt asteroids. A motion along-scan of this magnitude results in the object drifting out of the 6 x 6 pixels window soon after crossing the first CCD in Gaia’s focal plane array.
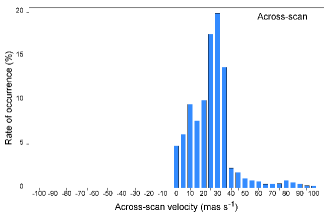
The across-scan motion of 2010 TK7 (Fig. 5) is also large compared to that of Main Belt asteroids. The absolute across-scan velocity of Main Belt asteroids is typically less than 15 mas s-1 (Todd et al., 2012c) compared with 40 mas s-1 for 2010 TK7. We also note that the distribution is asymmetric and not the bimodal distribution we observed with the simulated Earth Trojans in Todd et al. (2012c). We attribute this asymmetry to the peculiarity of 2010 TK7 co-orbiting the Sun in Earth’s L4 Lagrangian region.
Given the 106.5°separation between Gaia’s lines of sight, motion in the across-scan direction of 400 mas s-1 would result in an object traversing the width of the focal plane array (0.7°) between the first and second observations of the field (Todd et al., 2012b). As the across-scan motion of 2010 TK7 is typically less than 40 mas s-1 we find that a kilometre-scale Earth Trojan in the same orbit as 2010 TK7 would provide enough signal due to its proximity and hence greater apparent brightness to be detected even though it would drift out of the 6 x 6 pixels window soon after crossing the first CCD in Gaia’s focal plane array. In this orbit an object will drift approximately 4 arcmin in the interval between the first and second observations of the field thus making detections on both crossings possible.
The conclusion that can be drawn from this is that if a kilometre-scale Earth Trojan does exist then Gaia will detect it in spite of the signal degradation caused by the high relative drift across the CCD array. There will also be a substantial number of CCD crossings where the relative drift is low enough that Gaia will detect any Earth Trojans with diameters larger than m.
3.2 Mars Trojans
As with the simulation for the Earth Trojan 2010 TK7 we replicated the orbital parameters for the Mars Trojans (Table 2) and simulated observations by Gaia. The three largest Trojans (Eureka, 1998 VF31 and 1999 UJ7) were fully detected in our simulations. Of the remaining Trojans, 2007 NS2 had a 98 per cent detection, 2001 DH47 had a 43 per cent detection and 2011 SL25 had a nine per cent detection. The Trojans 2011 SC191 and 2011 UN63 were not detected in our simulations.
The apparent magnitude of a Mars Trojan with a diameter of 1 km and an albedo of 0.20 ranges between at opposition and at a Solar elongation of (Todd et al., 2012b). Gaia cannot observe at elongations within of opposition, however, the km Trojans are bright enough to be detected when they are in Gaia’s field of view.
The diameters of the Mars Trojans (Table 4) were calculated using the standard formula (Warner et al., 2009):
| (1) |
where is diameter in kilometres, is absolute magnitude and is albedo.
Rivkin et al. (2003) found that Eureka has a visible spectrum consistent with the Sr class in the Bus taxonomy and an infrared spectrum that is consistent with the A class. They also found that 1998 VF31 fit closely to Sr or Sa class and that 1999 UJ7 fit to X or T class. Trilling et al. (2007) subsequently observed Eureka and 1998 VF31 and determined their albedos to be 0.39 and 0.32 respectively. The other Trojans were assumed to be S class and to have typical albedo values as described in Warner et al. (2009).
| Asteroid | Abs. mag. | Class | Albedo | Diameter | |
| (km) | |||||
| Eureka | 16.1 | Sr† | 0. | 39‡ | 1.28 |
| 1998 VF31 | 17.1 | Sr† | 0. | 32‡ | 0.89 |
| 1999 UJ7 | 16.9 | X† | 0. | 174# | 1.33 |
| 2007 NS2 | 17.8 | S | 0. | 203# | 0.81 |
| 2001 DH47 | 18.7 | S | 0. | 203# | 0.54 |
| 2011 SC191 | 19.3 | S | 0. | 203# | 0.41 |
| 2011 SL25 | 19.5 | S | 0. | 203# | 0.37 |
| 2011 UN63 | 19.7 | S | 0. | 203# | 0.34 |
| Spectral class taken from Rivkin et al. (2003) | |||||
| Albedo taken from Trilling et al. (2007) | |||||
| # Typical albedo values taken from Warner et al. (2009) | |||||
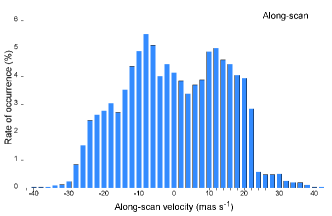
As with the Earth Trojan 2010 TK7 we found that the along-scan (Fig. 6) and across-scan (Fig. 7) velocities are greater than Main Belt asteroids. This result was not unexpected since the Mars Trojans are nearer to Gaia than the Main Belt asteroids. Likewise, the velocities were greater for 2010 TK7 than for the Mars Trojans. The median along-scan velocity of the Mars Trojans (Figure 6) is mas s-1, about double that of the Main Belt asteroids. A motion along-scan of this magnitude results in the object drifting out of the 6 x 6 pixels window after crossing two CCDs in Gaia’s focal plane array, resulting in a loss of signal.
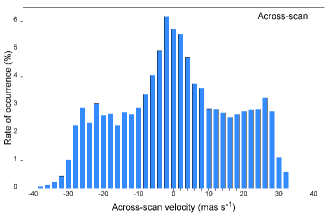
The across-scan motion of the Mars Trojans (Fig. 7) is also large compared to that of Main Belt asteroids but not as large as that of 2010 TK7. The absolute across-scan velocity of the Mars Trojans is typically less than 30 mas s-1, about double that of Main Belt asteroids. We note that the distribution bears some resemblance to the across-scan distribution for Main Belt asteroids in Tanga & Mignard (2012).
We find some differences between these simulation results and the expected results for Main Belt asteroids. It is expected that Gaia will make 60 to 70 observations of each Main Belt asteroid over the five-year period of its mission (Tanga & Mignard, 2012). By comparison the number of observations of the Mars Trojans, except for Eureka, are somewhat fewer. We expect that the number of observations will be linked to the apparent magnitude, which will be a function of distance and phase angle. Tanga & Mignard (2012) found a trend in the relationship between the absolute magnitude of an object and its apparent magnitude when observed by Gaia. It was calculated that Gaia’s limit for Main Belt asteroids is . Based on our simulation results we have determined that Gaia’s limit for Mars Trojans is .
An examination of the positions of the detections relative to Earth (and Gaia) shows a link between the brightness and the number of detections. It follows that there is a link between the brightness and the range of elongations over which the Trojans can be detected (Table 5). A result which was initially surprising was the variation in the along-scan and across-scan velocities, however, examination of the results shows that this variation is related to the orbit parameters.
| Asteroid | Distance from | Solar | Magnitude |
|---|---|---|---|
| Earth | elongation | ||
| Eureka | 0.546 | 489 | 16.9 |
| 1998 VF31 | 0.459 | 727 | 17.4 |
| 1999 UJ7 | 0.557 | 745 | 17.8 |
| 2007 NS2 | 0.548 | 1002 | 18.6 |
| 2001 DH47 | 0.557 | 1243 | 19.6 |
| 2011 SC191 | |||
| 2011 SL25 | 0.448 | 1282 | 19.8 |
| 2011 UN63 |
A comparison of the orbits (Table 2) shows that the eccentricity of 1998 VF31 and 2011 SL25 is and that the other Trojans are . It follows that the nearest approach to Earth’s orbit and hence the distance from Gaia for the nearest detection shows a similar pattern. It can be seen that the distances for 1998 VF31 and 2011 SL25 are similar to each other, as are the other Trojans (Table 5). We see in the distribution of the along-scan velocity (Fig. 6) that most of the absolute velocities are less than 25 mas s-1. Absolute velocities greater than 25 mas s-1 are due to 1998 VF31 and 2011 SL25 approaching more closely to Gaia as a result of the eccentricity of their orbits.
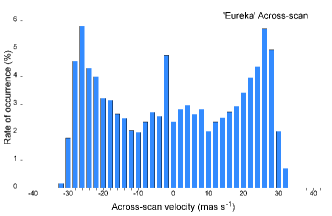
The case is not the same for the across-scan velocity distribution (Fig. 7) although most of the velocities are also less than 25 mas s-1. The distribution of across-scan velocities for most of the Mars Trojans exhibit this profile of a characteristic central peak with a shoulder either side. The maximum and minimum velocity for each Trojan is also consistent with the maximum and minimum velocity in the along-scan direction. However, the across-scan velocity distribution for Eureka is markedly different (Fig. 8) in that we see the across-scan velocities biased towards the maximum and minimum. We postulate that this is due to Eureka being bright enough to be detected at almost all Solar elongations and that these detections at the velocity extremes decrease with size and corresponding increase in minimum Solar elongation.
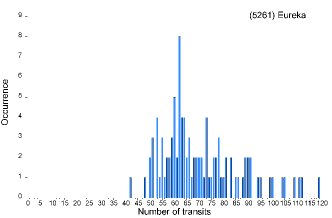
In our simulations of Eureka we found that it was fully detected, i.e. all the clones were detected multiple times. Depending on the starting conditions the number of detections of Eureka ranges between 42 and 141 detections with a probability peak at 62 detections (Fig. 9). This number of detections is similar to that expected for Main Belt asteroids.
Plotting the detections of Eureka relative to Earth and Gaia (Fig. 10) shows that observations are made at all Solar elongations between about and . At its nearest approach at a Solar elongation of Eureka is AU from Earth and has a brightness of . Its farthest detectable distance is at a Solar elongation of where its brightness is at Gaia’s detection threshold of .
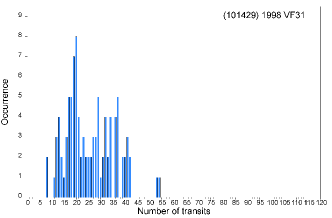
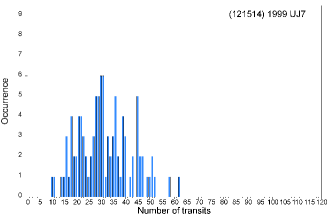
We also found that 1998 VF31 and 1999 UJ7 were fully detected. The results for 1998 VF31 and 1999 UJ7 were quite similar to each other. We found that detections of 1998 VF31 ranged between eight and 54 detections with a probability peak at 20 detections (Fig. 11) and for 1999 UJ7 ranged between ten and 62 detections with a peak at 30 detections (Fig. 12).
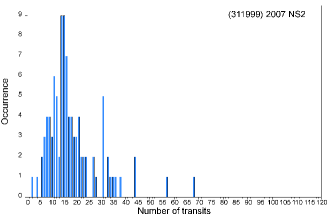
In our simulations of the remaining Mars Trojans we found that they were not fully detected. We had a 98 per cent success rate with 2007 NS2 as two of the clones went undetected. The other 98 clones were detected up to 68 times with a probability peak at 15 detections (Fig. 13). For 2001 DH47 only 43 per cent of the clones were detected. The maximum number of detections was 21 and the probability peak was very low at four detections. For 2011 SL25 only nine per cent of the clones were detected and the maximum number of detections for a single clone was 14 detections. The Trojans 2011 SC191 and 2011 UN63 were not detected in our simulations as their magnitudes were at their brightest.
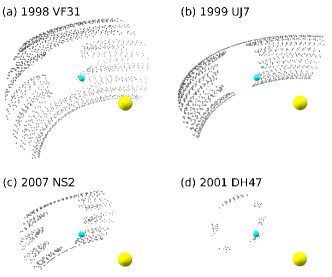
Plotting the detections of 1998 VF31, 1999 UJ7, 2007 NS2 and 2001 DH47 relative to Earth and Gaia (Fig. 14) shows the increasing minimum Solar elongations (respectively) at which observations were made (Table 5). It is clear that the range of Solar elongations over which Gaia will detect a Mars Trojan is related to its size and albedo and hence its range of apparent magnitudes. Eureka is the brightest of the Mars Trojans and has the largest range of Solar elongations at which detections can be made (Fig. 10). The other Mars Trojans are fainter and have smaller regions of detection (Fig. 14). The Trojans 1998 VF31 (Fig. 14a) and 1999 UJ7 (Fig. 14b) are similar in brightness and have similar ranges of Solar elongations where they can be detected. With 2007 NS2 (Fig. 14c) and 2001 DH47 (Fig. 14d) we see a reduced range of Solar elongations resulting in the detection region being an annulus around the exclusion zone towards opposition. The implication of this is that Gaia will only detect smaller Trojans if they pass through this annulus.
From our simulations we find that the starting conditions and orbit parameters greatly influence the result. We expect that Gaia will detect any kilometre-scale Mars Trojans. We can state with a high degree of certainty that Gaia will detect Mars Trojans larger than 800 m in diameter. We also consider that Gaia will detect Mars Trojans as small as 400 m in diameter. Consequently we expect that the results of the Gaia mission will test the predictions about the Mars Trojan asteroid population and lead to greater understanding about the evolution of the Solar System.
4 Summary
We used the known orbital elements for the Earth and Mars Trojans to simulate detections by the Gaia satellite. We cloned the orbital elements to provide 100 test bodies for each of the Trojans and modified them to compensate for the uncertainty of when Gaia will begin observations. We found that Gaia will not detect the Earth Trojan 2010 TK7 but consider that it will detect any Earth Trojan with a diameter larger than 600 m. We also found that Gaia will detect many of the Mars Trojans and is therefore likely to discover additional Trojans.
4.1 Earth Trojans
Although 2010 TK7 is very close to Earth and for the most part is within the observable region of sky for Gaia (Fig. 3), our simulation results indicate that it will not be detected by Gaia. Due to its small size of m (Connors, Wiegert & Veillet, 2011) its brightness is low, ranging from to (Table 3). Consequently 2010 TK7 is always too faint to be detected by Gaia.
We used the simulation results to consider the implications for observing a larger Earth Trojan in the same orbit. The along-scan (Fig. 4) and across-scan (Fig. 5) velocities are considerably greater than Main Belt asteroids. The median absolute along-scan velocity is mas s-1, almost six times that of the Main Belt asteroids, and results in the object drifting out of the 6 x 6 pixels window after crossing just one of the CCDs in Gaia’s focal plane array. The across-scan motion is typically less than mas s-1, about three times higher than Main Belt asteroids. We note that the distribution of the across-scan motion is asymmetric and not the bimodal distribution we found with the simulated Earth Trojans in Todd et al. (2012c). We attribute this asymmetry to the object residing in Earth’s L4 Lagrangian region.
We conclude that, if a kilometre-scale Earth Trojan does exist, then Gaia will detect it in spite of the signal degradation caused by the relative drift across the CCD array. We also consider that Gaia will detect any Earth Trojan with a diameter larger than m as there will be a substantial number of CCD crossings where the relative drift is low enough that the signal degradation will be minimal.
4.2 Mars Trojans
As with the simulation for the Earth Trojan 2010 TK7 we replicated the orbital parameters for the Mars Trojans (Table 2). The three largest Trojans (Eureka, 1998 VF31 and 1999 UJ7) were fully detected in our simulations. Of the remaining Trojans, 2007 NS2 had a 98 per cent detection, 2001 DH47 had a 43 per cent detection and 2011 SL25 had a nine per cent detection. The Trojans 2011 SC191 and 2011 UN63 were not detected in our simulations.
As with the Earth Trojan we found that the along-scan (Fig. 6) and across-scan (Fig. 7) velocities are greater than Main Belt asteroids. The median along-scan velocity of the Mars Trojans is mas s-1, about double that of the Main Belt asteroids. A motion along-scan of this magnitude results in the object drifting out of the 6 x 6 pixels window after crossing only two of the CCDs in Gaia’s focal plane array. The across-scan motion of the Mars Trojans is typically less than 30 mas s-1, also about double that of Main Belt asteroids. We note that the distribution bears some resemblance to the across-scan distribution for Main Belt asteroids in Tanga & Mignard (2012).
We found that Eureka, 1998 VF31 and 1999 UJ7 were fully detected, i.e. all of the clones were detected. The number of observations of the Mars Trojans, except for Eureka, will be somewhat fewer than the expected 60 to 70 observations of each Main Belt asteroid (Tanga & Mignard, 2012) over the five-year period of its mission. We found that the number of detections of Eureka is similar to that expected for Main Belt asteroids. Examining the positions of the detections relative to Earth (and Gaia) shows that there is a link between the maximum brightness and hence the range of elongations over which the Trojans can be detected (Table 5).
The results for 1998 VF31 and 1999 UJ7 were quite similar, with probability peaks at 20 and 30 detections respectively. However, the remaining Mars Trojans were not fully detected. For 2007 NS2 and 2001 DH47 we found the probability of detection to be 98 and 43 per cent respectively, with corresponding probability peaks at 15 and four detections. For 2011 SL25 only nine per cent of the clones were detected. The Trojans 2011 SC191 and 2011 UN63 were not detected in our simulations as their magnitudes were at their brightest.
From our simulations we find that the starting conditions and orbit parameters greatly influence the result in the case of detecting smaller Mars Trojans. Based on our simulation results we have determined that the Gaia limit for the detection of Mars Trojans is . We expect that Gaia will detect any kilometre-scale Mars Trojans. We can also state with a high degree of certainty that Gaia will detect Mars Trojans larger than 800 m in diameter and that Gaia may detect Mars Trojans as small as 400 m in diameter.
Past simulations (Tabachnik & Evans, 1999, 2000a, 2000b) predict that the number of Mars Trojans with diameters larger than 1 km could be more than 50 and that the number with diameters larger than 100 m could be several hundred. Assuming a progression of sizes that follows a power law, the number of Mars Trojans that Gaia will discover with diameters larger than 800 m will be more than 85, or conservatively more than 55. If we take the conservative view that there are about 30 Mars Trojans which have diameters larger than 1 km then we should expect that Gaia will detect between 55 and 140 new Mars Trojans. The results of the Gaia mission will test not only the accuracy of these simulation results but also the existing models of the Mars Trojan population and lead to greater understanding about the evolution of the Solar System.
Acknowledgments
MT acknowledges support from the Astronomical Society of Australia, the Australian Institute of Physics and the sponsoring organisations of the Gaia-FUN-SSO2 workshop. The work reported on in this publication has been supported by the European Science Foundation (ESF), in the framework of the GREAT Research Networking Programme. MT thanks the SOC/LOC of the Gaia-FUN-SSO2 workshop for providing a fertile environment for discussing Gaia science. MT thanks Heidi Ursula Wallon Pizarro for feedback which helped to improve the manuscript. DMC is supported by an Australian Research Council Future Fellowship.
References
- Connors, Wiegert & Veillet (2011) Connors M., Wiegert P., Veillet C., 2011, Nat, 475, 481
- de la Fuente Marcos & de la Fuente Marcos (2013) de la Fuente Marcos C., de la Fuente Marcos R., 2013, MNRAS, 432, L31
- Mignard et al. (2007) Mignard F. et al., 2007, Earth Moon Planets, 101, 97
- Pilat-Lohinger, Dvorak & Burger (1999) Pilat-Lohinger E., Dvorak R., Burger C., 1999, Celest. Mech. Dyn. Astron., 73, 117
- Rivkin et al. (2003) Rivkin A. S., Binzel R. P., Howell E. S., Bus S. J., Grier J. A., 2003, Icarus, 165, 349
- Rivkin et al. (2007) Rivkin A. S., Trilling D. E., Thomas C. A., DeMeo F., Spahr T. B., Binzel R. P., 2007, Icarus, 192, 434
- Scholl, Marzari & Tricarico (2005) Scholl H., Marzari F., Tricarico P., 2005, Icarus, 175, 397
- Tabachnik & Evans (1999) Tabachnik S., Evans N. W., 1999, ApJ, 517, L63
- Tabachnik & Evans (2000a) Tabachnik S., Evans N. W., 2000a, MNRAS, 319, 63
- Tabachnik & Evans (2000b) Tabachnik S., Evans N. W., 2000b, MNRAS, 319, 80
- Tanga & Mignard (2012) Tanga P., Mignard F., 2012, Planet. Space Sci., 73, 5
- Todd, Coward & Zadnik (2012) Todd M., Coward D. M., Zadnik M. G., 2012, Planet. Space Sci., 73, 39
- Todd et al. (2012a) Todd M., Tanga P., Coward D. M., Zadnik M. G., 2012a, MNRAS, 420, L28
- Todd et al. (2012b) Todd M., Tanga P., Coward D. M., Zadnik M. G., 2012b, MNRAS, 424, 372
- Todd et al. (2012c) Todd M., Tanga P., Coward D. M., Zadnik M. G., 2012, arXiv:astro-ph/1212.0268
- Trilling et al. (2007) Trilling D. E., Rivkin A. S., Stansberry J. A., Spahr T. B., Crudo R. A., Davies J. K., 2007, Icarus, 192, 442
- Warner et al. (2009) Warner B. D., Harris A. W., Pravec P., 2009, Icarus, 202, 134