The IACOB project††thanks: Based on observations made with the Nordic Optical Telescope, operated on the island of La Palma jointly by Denmark, Finland, Iceland, Norway, and Sweden, in the Spanish Observatorio del Roque de los Muchachos of the Instituto de Astrofisica de Canarias.
Abstract
Context. Stellar rotation is an important parameter in the evolution of massive stars. Accurate and reliable measurements of projected rotational velocities in large samples of OB stars are crucial to confront the predictions of stellar evolutionary models with observational constraints.
Aims. We reassess previous determinations of projected rotational velocities ( sin ) in Galactic OB stars using a large, high quality spectroscopic dataset, and a strategy which account for other sources of broadening appart from rotation affecting the diagnostic lines
Methods. We present a versatile and user friendly IDL tool — based on a combined Fourier Transform (FT) + goodness of fit (GOF) methodology — for the line-broadening characterization in OB-type stars. We use this tool to (a) investigate the impact of macroturbulent and microturbulent broadenings on sin measurements, and (b) determine sin in a sample of 200 Galactic OB-type stars, also characterizing the amount of macroturbulent broadening () affecting the line profiles.
Results. We present observational evidence illustrating the strengths and limitations of the proposed FT+GOF methodology for the case of OB stars. We confirm previous statements (based on indirect arguments or smaller samples) that the macroturbulent broadening is ubiquitous in the massive star domain. We compare the newly derived sin in the case of O stars and early-B Supergiants and Giants (where the effect of macroturbulence is found to be larger) with previous determinations not accounting for this extra line-broadening contribution, and show that those cases with sin 120 km s-1need to be systematically revised downwards by 25 ( 20) km s-1. We suggest that microturbulence may impose an upper limit below which sin and could be incorrectly derived by means of the proposed methodology as presently used, and discuss the implications of this statement on the study of relatively narrow line massive stars.
Conclusions. An investigation of impact of the revised sin distributions on the predictions by massive star evolutionary models is now warranted. Also, the reliability of sin measurements in the low sin regime, using a more precise description of the intrinsic profiles used for the line-broadening analysis, needs to be further investigated.
Key Words.:
Stars: early-type – Stars: rotation – Techniques: spectroscopic – Line: profiles – The Galaxy1 Introduction
The stellar mass is the primary parameter determining the structure and evolution of a star and, traditionally, the chemical composition (viz. metallicity) has been considered as the second most relevant parameter. However, it is already 15 years since Maeder & Meynet (2000) highlighted that rotation is indispensable for a proper modeling of the evolution for the upper Main Sequence stars in their review about the evolution of rotating massive stars (see also the more recent review by Langer, 2012, and references in both documents). Thanks to these and subsequent related studies we know that rotation in massive stars may play a role comparable to that of mass and metallicity in our interpretation of the position occupied by these stars in the Hertzsprung-Russell Diagram. Also, the inclusion of the effects of rotation (including rotational mixing) in massive star models has been crucial for the investigation of (a) the surface abundance pattern observed in massive stars (e.g Hunter et al., 2009; Przybilla et al., 2010; Bouret et al., 2013), and (b) the effect of very extreme rotation in their evolution111Extreme rotation is predicted to be responsible for homogeneous evolution (Maeder, 1987), in which the inner distribution of angular momentum is importantly affected from the very early evolutionary stages. and final fate (long-duration gamma-ray burst and hypernovae, peculiar bright Type II and Type Ib/c supernovae, e.g., Georgy et al., 2009; Langer, 2012).
Even more recent works show the importance of binary interactions for the evolution of massive stars and for the interpretation of population observations and synthesis population calculations (see Sana et al., 2012; de Mink et al., 2013, and references therein). These studies reveal that the present stellar rotation rate is a key parameter indicative of the past history of the binary systems.
All the predictions by rotating stellar evolution models must be always supported by observational constraints. Ideally, we would like to know the initial distribution of rotational velocities and their temporal evolution as a function of the other stellar properties (mass, luminosity, metallicity, multiplicity, etc.). However, what we can actually measure is the projected rotational velocity ( sin ) of a certain star at given instant in its life. Therefore, to compensate this observational deficiency, sin measurements of large samples of O and early-B main sequence stars, as well as B Supergiants (B Sgs) are of ultimate importance for our understanding of the massive stars and the stellar populations including (and often being dominated by) them.
One of the most straightforward and cheapest (from an observational point of view) ways to obtain information about (projected) rotational velocities in stars is based on the effect that rotation produces on the spectral line profiles (i.e. line-broadening). Following this approach, the analysis of large samples of Galactic O and early-B type stars via linewidth measurements (e.g., Slettebak, 1956; Conti & Ebbets, 1977) or cross-correlation techniques (e.g., Penny, 1996; Howarth et al., 1997) provided a general overview of the rotational properties of stars in the upper part of the Hertzprung-Russell diagram.
The sin measurements in all these works are, however, obtained under the assumption that rotation is the sole source of broadening. While the quantification of the global line-broadening is a relatively easy task, the translation of these quantities to actual projected rotational velocities in the case of O and B-type stars may become complex in certain situations (see e.g., some notes in Howarth, 2004, and references therein). The determination of actual sin becomes even more complicated with the increasing evidence that rotation is not the only broadening mechanism shaping the line-profiles of these stars. Already Struve (1952) provided several convincing arguments against a strict rotational interpretation of line-broadening in this class of stars. Slettebak (1956), Conti & Ebbets (1977), Penny (1996), Howarth et al. (1997) also supported this statement based on the lack of O-type stars and early-B Sgs with sharp absorption lines among their large analyzed samples. More recently, the advent of high-quality spectroscopic observations (in terms of resolving power and signal-to-noise ratio) and its analysis by means of adequate techniques (e.g., Ryans et al., 2002; Simón-Díaz & Herrero, 2007) has allowed us to confirm the presence of an additional broadening mechanism shaping the line-profiles of these type of stars. It was called macroturbulent broadening at some point; however, it is easy to discard that this extra-broadening is produced by any type of large scale turbulent motion (Simón-Díaz et al., 2010). Nevertheless, for the sake of simplicity we will keep the name macroturbulence in this paper.
Once the suspicions by Struve were confirmed, several questions needed to be treated: (a) is it possible to disentangle both broadening contributions from the line profiles?, (b) how are previous determinations of projected rotational velocities affected? and, last but not least (c) what is the physical origin of the anomalous non-rotational broadening?.
The last decade has witnessed good progress in the investigation of all these questions, specially in the case of B Sgs (e.g., Dufton et al., 2006; Lefever et al., 2007; Markova & Puls, 2008; Aerts et al., 2009; Fraser et al., 2010; Simón-Díaz et al., 2010). However, a complete understanding of the impact of macroturbulent broadening in the whole massive star domain requires a comprehensive, homogeneous analysis of a large sample of high quality spectra of OB stars, also including early-B dwarfs and giants and, of course, O-type stars of all luminosity classes. This was one of the initial drivers of the IACOB project (P.I. Simón-Díaz), which aims at progressing in our knowledge of Galactic massive stars using a large, homogeneous, high-quality spectroscopic dataset and modern tools for the quantitative spectroscopic analysis of O and B-type stars.
Some preliminary results concerning the study of the projected rotational velocities and the macroturbulent broadening in the IACOB sample can be found in Simón-Díaz et al. (2012), and references therein. Here, we present for the first time the complete study, also including a detailed description of the strengths and limitations of the methodology we have applied to disentagle both broadening contributions in a sample of 200 Northern Galactic O and early-B stars (covering all luminosity classes). We also refer the reader to the recent study by Markova et al. (2013). In a parallel work to this one, these authors provide observational constraints on the projected rotational velocities and the amount of macroturbulent broadening as a function of fundamental parameters and stellar evolution from the analysis of a sample of 31 Southern Galactic O stars (own new data) plus 86 OB Supergiants from the literature.
The paper is structured as follows. In Sect. 2 a brief description of the spectroscopic dataset used for this study is presented. The strategy we have followed for the line-broadening characterization of our sample of O and B stars is described in Sect. 3. Special emphasis is made in the description of the software we have used, the iacob-broad tool, a versatile procedure developed and implemented by us in IDL, that provides a complete set of quantities and visual information resulting from a combined Fourier transform plus a goodness of fit analysis of the line-broadening in OB stars. The analysis of the whole sample and the discussion of results can be found in Sect. 4, while the main conclusions are summarized in Sect. 5.
2 Observations
The spectroscopic observations considered for this study are part of the IACOB spectroscopic database of Northern Galactic OB stars (last described in Simón-Díaz et al., 2011a, b). This unique high-quality spectroscopic database has been compiled in the framework of the IACOB project. To date, the IACOB database comprises 1250 spectra of 153 and 97 Galactic O and early B-type stars, respectively, observable from the Roque de los Muchachos observatory in La Palma (Spain). The spectra, having a resolving power of 46000 and 23000, and a typical signal-to-noise (S/N) ratio above 150, were compiled between November 2008 and January 2013 with the high-resolution FIbre-fed Echelle Spectrograph (FIES) attached to the Nordic Optical Telescope (NOT). The IACOB database has a multi-epoch character to investigate the binary/multiple nature of considered stars and the temporal variations in individual objects, with at least 3 spectra per observed target. In this study, we have only used a subsample of the spectra, discarding all those stars in which we have found signatures of multiplicity contaminating the spectrum (therefore considering only apparently single and SB1 stars), and only considering the spectrum with the highest S/N ratio per star.
All the spectra were homogeneously reduced using the FIES-tool pipeline, revised and normalized using own procedures developed in IDL. The spectroscopic observation covers the full wavelength range between 3700 and 7000 Å without gaps; however, for this study we have only used the spectral windows including the Si iii 4552 and O iii 5592 lines for the case of early-B and O-type stars, respectively.
3 Methods
Motivated by the investigation performed in this paper we have developed a versatile and user friendly IDL tool for the line-broadening characterization of OB-type spectra: the iacob-broad. This procedure allows us to determine sin and the macroturbulent broadening () under a variety of situations, and it is based on a combined Fourier Transform (FT) + goodness of fit (GOF) methodology.
These two methods are (independently) able to separate the rotational broadening contribution to the line profile from other line-broadening components, but they also present some caveats that must be taken into account for a correct interpretation of the results. We have found that a combined use of both techniques helps us to not only provide more reliable final estimates of sin and (plus their associated uncertainties) but also to better understand the problematic cases and identify spurious solutions.
While the iacob-broad tool has been used in several publications in the last few years (e.g., Simón-Díaz et al., 2010; Degroote et al., 2010; Aerts et al., 2013; Ramírez-Agudelo et al., 2013; Sundqvist et al., 2013; Markova et al., 2013), it has not been formally described yet. In this section, we briefly describe the basics of the tool and explore the strengths and limitations of the proposed methodology. To this aim, we present a couple of formal tests carried out to investigate the effect that the assumed macroturbulent profile has on the GOF-based sin and estimations (Sect. 3.3), and the possible consequences of neglecting the effect of microturbulence on the determination of these two quantities (Sect. 3.4).
3.1 The FT and GOF methods in a nutshell
The FT method was first introduced by Carroll (1933) and, some years later, revisited and extended by Gray (1976, 2005). This technique is based (in its more simple form) on the identification of the first zero in the Fourier transform of the line-profile, and the direct translation of the associated frequency () to the corresponding projected rotational velocity via the formula:
| (1) |
where is the central line wavelength and c is the velocity of light. This technique has been commonly used in the case of cool stars since the pioneering works by e.g. Wilson (1969), Gray (1973), or Smith & Gray (1976), but only marginally applied to the case of early OB-type stars before the first decade of the XXIst century. After the work by Ebbets (1979), it was Simón-Díaz & Herrero (2007) who first applied this technique in a systematic way to the OB star domain. Since then, the FT method has been increasingly used for the study of this type of stars (e.g., Dufton et al., 2006; Lefever et al., 2007; Hunter et al., 2008; Markova & Puls, 2008; Fraser et al., 2010; Lefever et al., 2010; Bouret et al., 2012; Grunhut et al., 2012; Dufton et al., 2013; Ramírez-Agudelo et al., 2013; Markova et al., 2013).
Being a powerful technique, the FT method must be used with special care when the rotational broadening is comparable to (or smaller than) the resolving power of the spectrum and/or the intrinsic222In this context, the intrinsic line profile includes the natural, thermal, and Stark broadening. broadening of the line. In addition, three other caveats must be kept in mind when extracting information about sin from the FT of the line-profile: (a) when the so-called macroturbulent broadening is comparable or larger than the rotational broadening and the S/N ratio of the line is not large enough, the position of the first zero could be hidden below the white-noise in the Fourier space, resulting in an apparent displacement to smaller frequencies (i.e. larger sin ). An example of this effect can be found in Simón-Díaz & Herrero (2007). Moreover, even when the line quality is optimal, we should keep in mind the word of caution indicated by Gray (2005): when macroturbulence dominates over rotation the sidelobe structure of the Fourier transform may be affected; (b) if the line is asymmetric and/or the final line-profile is not the result of a convolution of the various broadening agents, the first zero of the FT could not be related to the actual projected rotational velocity. An example of this caveat is found in the work by Aerts et al. (2009). If the macroturbulent broadening has a pulsational origin (a possibility investigated by these authors in B Sgs) then sin determinations could be seriously underestimated by using a simple parameter description for macroturbulence rather than an appropriate pulsational model description to fit the line profiles; and c) as indicated by Gray (1973), microturbulent broadening also adds zeroes to the FT at frequencies associated to low sin values which could be misinterpreted as zeroes produced by rotation (see also discussion in Sect. 3.4).
The goodness-of-fit (GOF) technique is based on a simple line-profile fitting in which an intrinsic profile is convolved with the various considered/investigated line-broadening profiles and compared with the observed profile using a formalism. An example of the application of this technique to a sample of Galactic early-B Sgs can be found in Ryans et al. (2002). As already pointed out by these authors, one of the caveats of the GOF method to disentangle rotational from macroturbulent broadening is the high degree of degeneracy in the resulting profiles when convolved with different ( sin , ) combinations (resulting in a banana-shaped distribution, see e.g., Figs.1 and 2). More, as we show in Sect. 3.3, different descriptions of the macroturbulent profile lead to different and sin measurements. In addition, the derived sin and may be erroneous if the total broadening is comparable to the intrinsic broadening of the line and the later is not properly taken into account. This second warning must be specially kept in mind when using He i-ii lines due to the effect of Stark broadening (see e.g., Ramírez-Agudelo et al., 2013), and in those stars having relatively low sin and (due to the effect of microturbulence, see further discussion in Sect. 3.4).

While the GOF technique allows for the full characterization of the line-broadening in terms of projected rotational and macroturbulent velocities, the identification of the first zero in the FT only provides a measurement of sin . The estimation of the extra-broadening in this case requires a further comparison of synthetic profiles broadened by rotation and macroturbulence and the observed profiles (either in the lambda or Fourier domain). Gray (1976, 2005) proposes the use of the full information contained in the FT of the line-profile. The strategy we follow in this paper is based on a combined FT+GOF approach.
3.2 iacob-broad: a combined FT+GOF analysis
The general philosophy of the iacob-broad IDL procedure is simple: extract in just one shot as much information as possible about the line-broadening characteristics of a given stellar line-profile in a versatile and user friendly way. This information is obtained by the combined application of the two methodologies described in the previous subsection to an observed line-profile.
Before starting the combined FT+GOF analysis, the tool allows for a preprocessing of the line profile (e.g., renormalization of the local continuum, clipping part of the line-profile to eliminate nebular contamination) and for the selection of the intrinsic profile (either a delta-function or a line profile from a stellar atmosphere code). For the purposes of the present work, two types of macroturbulent profile are incorporated into the GOF analysis: an isotropic Gaussian, and a radial-tangential description (see Gray, 2005, for definitions).
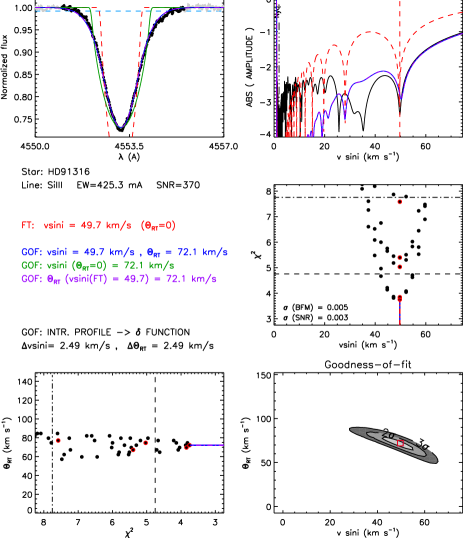
Figs. 1 and 2 show the graphical output resulting from the iacob-broad analysis of the Si iii 4452 line from the IACOB spectra of HD 37042 (B0.7 V) and HD 91316 (B1 Iab N str.). Each graphical output includes as much information as possible concerning the broadening characterization of the studied line. Five main graphical results are presented: (a) The line profile (upper left); (b) the FT of the line (upper right); and (c) 2-D -distributions resulting from the GOF analysis (lower right) and their projections (above and to the left). In addition, the following information is provided in the same figure (the associated uncertainties are calculated and provided on the screen and output files):
-
•
the sin corresponding to the first zero of the FT;
-
•
the sin and macroturbulent velocity resulting from the GOF, assuming both are free parameters;
-
•
the sin resulting from the GOF, when the macroturbulent velocity is fixed to zero (i.e., this result assumes that the full broadening is due to rotation and is directly comparable to previous studies not accounting from the extra-broadening);
-
•
the macroturbulent velocity resulting from the GOF when the sin is fixed to the value corresponding to the first zero of the FT.
For the sake of simplicity, we denote these different values as sin (FT), sin (GOF), (GOF), sin (GOF, =0), and (FT+GOF), respectively, along the paper. We will use when generically referring to macroturbulent velocity. On the other hand, since two different characterizations of this broadening agent are used in this paper, namely an isotropic Gaussian profile and a radial-tangential profile, we will quote these two possibilities as and , respectively.
For each set of resulting broadening parameters, the initially considered synthetic profile is convolved with the ( sin , ) pair and degraded to the resolving power of the analyzed spectra; then the corresponding profiles and the resulting Fourier transforms are overplotted in the various panels using the same color code as in text for better identification.
The graphical output allows the user to understand the impact of the different contributions to the line profile broadening, and evaluate the reliability of the various solutions. From the two examples shown in Figs. 1 and 2, HD 37042 represents a typical case in which rotation dominates the broadening of the Si iii line. As a result of this and of the high S/N ratio of the line, the broadening analysis results in an excellent agreement between sin (FT) and sin (GOF). In addition, sin (GOF, =0) is very close to these two values. HD 91316, on the other hand, illustrates the case of a star in which an important (dominant) macroturbulent broadening contribution affects the Si iii line-profile. In this case, sin (FT) = vsin(GOF), but inspection of the synthetic line profile and its corresponding FT convolved with this sin value (the red lines in the upper panels of Fig. 2) already tell us that rotation is not the only broadening agent. As a consequence, the derived sin assuming rotation as the only broadening agent results in a too large sin value. We emphasize here the role played by the spectral resolution. At a resolution significantly lower than the present observations (R = 46000) the disentangling of rotation and macroturbulent broadenings would be much difficult.
These two cases were deliberately selected as examples in which there is perfect agreement between FT and GOF results. However, this will not always be the case. Under certain situations, sin (FT) sin (GOF) and the user will have to use the provided information to decide which one is the correct solution (if any!). Some of the possible difficulties are presented in the next subsections.
3.3 Gaussian vs. radial-tangential macroturbulent profile
While the presence of a non-negligible non-rotational broadening has been firmly confirmed (see Sect. 1), its physical origin is still a puzzling question. As a consequence, we still lack a formal description of the corresponding broadening profile. Meanwhile, following some guidelines developed in the context of cool stars, two different definitions of the (up to now called) macroturbulent broadening have been commonly used for OB-type stars in the last years: an isotropic Gaussian definition and a radial-tangential definition.
In Simón-Díaz et al. (2010) we pointed out that the values of sin and determined by means of the GOF method depend on the assumed macroturbulent profile. There we suggested, based on empirical arguments, that a radial-tangential prescription is more appropriate results. In this section we re-assess this topic and provide further evidence that the radial-tangential profile gives more consistent results.
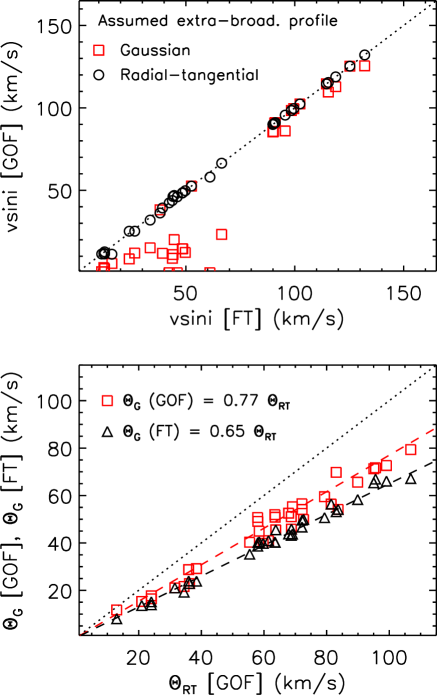
For this investigation we considered a subsample of the IACOB spectra analyzed in this paper, fulfilling the following criteria: (a) Well defined zeroes in the FT (b) sin 150 km s-1, and (c) 0.5 sin . We carried out the analysis twice, first assuming a radial-tangential profile and then an isotropic Gaussian profile, all other conditions being exactly the same. The upper panel of Fig. 3 compares the sin (GOF) values obtained in each case with the corresponding sin (FT). While there is a perfect agreement between sin (GOF, ) and sin (FT), sin (GOF, ) values are systematically too low compared with the FT determinations. The lower panel illustrates the fact that the two different descriptions lead also to different values of . There is a clear correlation between the and measurements, but values are systematically lower ( 76% in the case of free sin and 65% in the case of sin fixed to its FT value).
This result is a consequence of the different characteristics of both profiles. Basically, the isotropic Gaussian profile results in a broader core than the radial-tangential profile for the same wing extension. As a consequence a lower sin is needed in the case of the Gaussian profile. This effect is negligible when sin is large enough to dominate the contribution to the line core broadening (see, e.g., those cases with sin 100 km s-1 in Fig. 3).
Ryans et al. (2002) were among the first authors trying to quantify the relative contribution of rotation and macroturbulent broadening in B Sgs. They applied a GOF method with an isotropic Gaussian definition of the macroturbulent profile, and concluded that a model where macroturbulence dominates and rotation is negligible is more acceptable than the reverse scenario. Their sin values were, however, too low compared with results obtained afterwards based on the Fourier transform. This puzzling result has been neither investigated nor explained in the literature yet. Our investigation definitely explains this discrepancy333We remark here that this effect can be also present in some of the more critical cases presented in Figs. 6, 7, and 8 in Aerts et al. (2009). and shows that values from different sources can only be combined with care.
Three main conclusions can be extracted from our investigation:
-
•
While the physical origin of the macroturbulent broadening is still not known (and hence we lack a formal calculation of the profile describing the extra-broadening), the results presented in the upper panel of Fig. 3 support that a radial-tangential macroturbulent profile is better suited to determine rotational velocities in OB stars (based on a GOF approach) than a Gaussian profile.
- •
-
•
When investigating relationships between the size of the extra-broadening and other stellar parameters, one must combine macroturbulent velocities from the literature with care since there is a systematic offset between values obtained under the various assumptions usually considered by different authors.
3.4 The effect of microturbulence

In many cases, one has to perform a line-broadening analysis without having access to a realistic intrinsic profile (i.e. computed with a stellar atmosphere code). In that case, it is habitual to consider a delta-function with the same equivalent width as the observed line. As a consequence, the GOF analysis incorporates all line-broadening not produced by rotation (and spectral resolution) to the parameter. One can minimize this effect using metal lines where, contrarily to the case of H and He i-ii lines, the Stark broadening is negligible. However, even in this case there is yet an important source of line-broadening which may lead to an overestimation of the macroturbulent broadening: microturbulence.
Microturbulence also has an effect when performing an FT analysis to determine sin . As pointed out by Gray (1973), microturbulence also produces zeroes in the Fourier transform at (high) frequencies associated with low values of sin that may be wrongly identified as the zeroes associated with the rotational broadening below a certain sin limit.
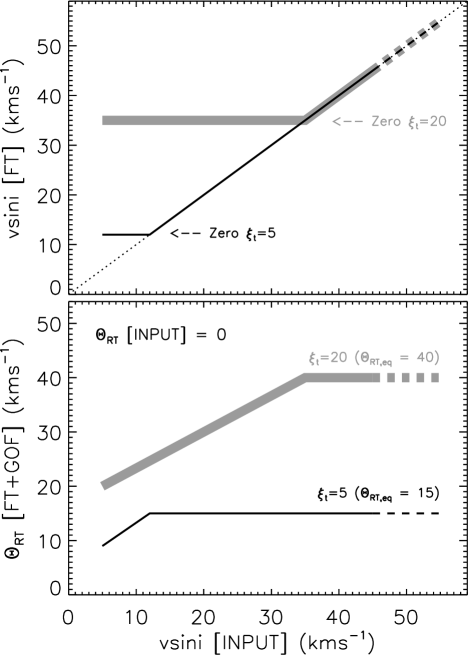
In Simón-Díaz & Herrero (2007) we presented a few notes about the effect of microturbulence on the determination of sin via the FT method for the case of OB-type stars. In this section, we extend further that study and also investigate the impact that microturbulence can have on our measurements. To this aim, we performed a couple of exercises in which a set of synthetic Si iii 4552 lines computed with the stellar atmosphere code FASTWIND (Santolaya-Rey et al., 1997; Puls et al., 2005) were analyzed using the iacob-broad procedure in the same way as the observed spectra. Two values of microturbulence (5 and 20 km s-1) were considered as representative for Dwarfs and Supergiants, respectively. In a first exercise, each of these two profiles was convolved with different values of sin ranging from 5 to 400 km s-1, and no macroturbulent broadening was incorporated to the synthetic lines. In a second exercise, sin was fixed to 50 km s-1 and a macroturbulence () ranging from 10 to 100 km s-1 was added to each profile.
Results from these exercises are presented in Figs. 4 and 5, were the derived values of sin (FT) and (FT+GOF) are compared to the input values. Top panel in Fig. 4 indicates that there is perfect agreement between the derived and the input sin when the first zero associated with rotation is located at lower frequencies (larger sin ) than the zero resulting from microturbulence. On the other hand, for lower sin values the later would be wrongly attributed to rotation and hence the plateau in the derived sin . Therefore, microturbulence imposes an upper limit below which sin cannot be correctly derived by means of the first zero in the FT. It is important to note that this sin limit depends on the value of the microturbulence and the equivalent width of the line. The larger these parameters, the higher the limit on the detectable sin . In the case of the example considered in Fig. 4, this limit can be up to 35 km s-1 for the case of = 20 km s-1.
Interestingly, the derived sin (GOF) values agree with sin (FT) determinations for all the cases considered in these exercises (even when they are wrong!). This seems to indicate that in the low sin regime, when microturbulent broadening dominates, the profile associated to microturbulence (at least in the form resulting from FASTWIND computations) can be mimicked by a rotational profile with a given sin (plus the inclusion of some extra-broadening to fit the extended wings on the line).
The lower panel of Fig. 4, along with Fig. 5 illustrate that, as expected, a simple
sin + analysis without accounting for the effect of microturbulence on
the line-profile systematically leads to an overestimation of . This effect is more important
when the relative contribution of microturbulence vs. macroturbulence is larger. In the example
considered in bottom panel of Fig. 4, a microturbulence
of 5/20 km s-1 in a star without any macroturbulent broadening contribution, could be erroneously
interpreted as having 15/40 km s-1, respectively. As indicated in Fig. 5 the
relative overestimation becomes smaller with increasing macroturbulence. Interestingly, the input
macroturbulence is not perfectly recovered even at large values of .
Two main conclusions can be highlighted from our study. If the effects of microturbulence are not
taken into account:
-
a)
Any sin measurement (either from FT or GOF) below 40 km s-1 must be considered as an upper limit (specially in the case of O and early-B Sgs, where the large values of microturbulence are commonly found);
-
b)
Any (GOF) measurement must be considered as an upper limit of the actual macroturbulent broadening. In particular if 15/40 km s-1 in dwarfs/supergiants, the derived macroturbulent broadening may be actually produced by microturbulence; on the other hand, even values above 25/60 km s-1 may be actually smaller by 5/15 km s-1.
We should note that all the numbers indicated above must be considered as illustrative since the actual values depend of the equivalent width of the investigated line, and the specific microturbulence derived for the star under study.
The two exercises presented in this section warn us about the limitations of the proposed FT+GOF strategy. These warnings are specially important when interpreting results in the low sin and regimes. Also, when the derived line-broadening parameters (specially ) are used for the spectroscopic determination of the stellar parameters and/or abundances by fitting metal lines. In that case, these values will have to be corrected downwards depending on the derived/assumed microturbulence.
Some of these limitations may be surpassed if lines with different equivalent widths are analyzed (for the case of sin ), more zeroes are considered in the FT, and synthetic lines incorporating the microturbulence resulting from a quantitative spectroscopic analysis are considered as initial profiles in the fitting procedure (for the case of ). We plan to explore these ways for future improvements.
3.5 Applicability and limitations in the IACOB sample
Before presenting the results of the line-broadening analysis of the whole sample of Galactic OB stars considered in this study (Sect. 4), we summarize below some important points (apart from those more general ones indicated in previous sections) which must be reminded to correctly interpret the results from the iacob-broad analysis of the IACOB spectra.
3.5.1 Resolution and spectral sampling
The resolving power of the IACOB spectra is 46000 and 25000 (FIES medium and low resolution modes, respectively), both having a spectral dispersion of 0.025 Å/pix. The lower sin limit detectable via FT (related to the Nyquist frequency, see Simón-Díaz & Herrero, 2007) is 2 km s-1, and the velocity corresponding to the spectral resolutions is 5 and 10 km s-1 respectively.
3.5.2 Signal-to-noise ratio
The S/N ratio of the continuum adjacent to the analyzed lines is normally above 150. There are, however, a few cases with a S/N ratio slightly lower than 100.
To investigate the effect of noise for the specific case of the spectroscopic dataset analyzed in this study, we obtained 13 spectra of HD 91316 (one of the examples presented in Sect. 3, see also Fig. 2) with varying exposure times leading to S/N ratios ranging from 90 to 300. The corresponding Si iii 4552 lines were analyzed with the iacob-broad procedure using the same wavelength limits. We found that the derived sin (FT) and sin (GOF, ) values range between 36 – 53, and 41 – 51 km s-1, respectively, without any clear correlation with the S/N of the continuum. The mean values and standard deviations in each case are 46 5 and 46 3 km s-1, respectively. Therefore, from this single experiment we can conclude that, for this spectroscopic dataset, the effect of noise on the derived sin and does not seem more relevant than other sources of uncertainty (e.g., local renormalization, asymmetry of the line, non detected spectroscopic binarity).
3.5.3 Broad line stars

Stars with projected rotational velocities above 150 km s-1 deserve a separated section, since they present some issues not equally important in relatively narrow line stars. The main ones are summarized below:
-
•
The first issue is the possibility of non-detected spectroscopic binaries/multiple systems, specially when the various components have large sin and the radial velocity amplitude of the system is small.
-
•
Lines can be really shallow in very fast rotators, and the effect of noise, blending, and specially continuum normalization becomes important. Above a certain sin value the effect of the extra-broadening only result in a subtle shaping of the extended wings (see e.g., Fig. 6), and hence a reliable measurement of becomes difficult due to the effect of noise and local continuum normalization on the fitting process. We have found from our analysis that in stars with sin 180 km s-1 the values of resulting from the iacob-broad analysis must be considered as upper limits.
-
•
Equatorial gravity darkening will produce an obscuration of the profile wings associated with the larger velocities and thus an underestimation of the actual sin (Townsend et al., 2004; Frémat et al., 2005). While in this paper we present sin measurements for stars above 200 km s-1 obtained in the same way as the global sample and without incorporating any correction, we plan to investigate this type of effects in a future paper, also including sin measurements provided by the stronger He i-ii lines.
4 Analysis of a sample of Northern Galactic OB-type stars
Tables 2 – 5 summarize the results from the line-broadening characterization of the complete sample. The iacob-broad procedure was applied to the O iii 5591 or Si iii 4552 lines depending of the spectral type and luminosity class444There is a small subsample of O9-B0 stars in which the two lines are available. We have found a very good agreement between results from the iacob-broad analysis of both lines., and the derived sin (FT), sin (GOF), and (GOF) are indicated in columns 7 – 9. The tables also include information about the spectral type and luminosity class of the stars (columns 2 and 3), the used line and its equivalent width (column 4 and 5) and S/N ratio of the adjacent continuum.
Following the results of the exercise presented in Sect. 3.3 we assumed a radial-tangential definition of the macroturbulent profile. Also, it is important to remark that we assumed a delta-function as intrinsic profile555A quantitative spectroscopic analysis aimed at the determination of the stellar and wind parameters of the whole IACOB sample is now in progress. Results will be presented in a forthcoming paper. ; therefore, the derived macroturbulence includes all sources of non-rotational broadening (i.e. microturbulence and any other possible unknown source of broadening). This may have important consequences for those cases in which a low value of sin and/or macroturbulence is obtained (see notes in Sect. 3.4).
4.1 sin (FT) vs. sin (GOF)


Fig. 7 compares the sin measurements obtained by means of the FT and GOF approaches. The one-to-one relation is indicated with a dashed line along with the 10 and 20% difference regions in dark and light grey, respectively. Upper panel includes all cases, while the lower panel zooms the region with sin (FT) 150 km s-1. Both sin measurements are in very good agreement ( 10%) for all stars with sin 100 km s-1. The situation becomes slightly worse for stars with projected rotational velocities below this limit. The agreement is, however, always better than 20%, except for a few cases with sin measurements below 20 km s-1. Taking into account the results of the exercises presented in Sect. 3.4, all sin values below 15 – 35 km s-1 must be considered as upper limits (specially in the case of Sgs); hence, those cases which disagree in more than 20% in this low sin region can be naturally explained as due to the limitations of our methodology.
Only a small fraction of objects (7 out of the 200 analyzed stars with sin 35 km s-1) present differences between sin (GOF) and sin (FT) in the range 10 – 20%. We have explored these cases in more detail and found that most of them correspond to lines affected by an important macroturbulent broadening contribution (some of them also being slightly asymmetric) in which the first zero of the FT is not sharply defined. Although we cannot exclude other possible effects, the combination of large plus a not high enough S/N ratio can play an important role in the sin (FT) determination. As a consequence, most of these cases result in sin (FT) slightly larger than sin (GOF, ).
The very good agreement in the derived projected rotational velocities obtained by means of two independent methods can be considered as an observational evidence of the strength of both the FT and GOF methodologies. In particular, it allows us to reassess the reliability of the FT method after the word of caution indicated by Aerts et al. (2009). Although we cannot completely discard that the effect described by these authors (see also Sect. 3.1) is not present in our analysis, a detailed inspection of the global graphical output provided by the iacob-broad tool (see Figs. 1 and 2) — including the observed and simulated line-profiles and their Fourier transforms — allows us to ascertain that the most critical cases found by Aerts et al. are not actually represented in the analyzed sample.
A representative example of results from the analysis of a star with a dominant macroturbulent broadening contribution is presented in Fig. 2 and commented in Sect. 3.2. Fig. 8 shows two examples of line profiles affected by non-radial pulsations ( Cep stars in this specific case). Although the profiles are clearly asymmetric and with strong local jumps, their analysis does not offer any particular difficulty compared to similar stars showing smoother profiles (see e.g., Fig. 1).
In addition, the good agreement found between sin (FT) and sin (GOF,) from the analysis of our high resolution, high S/N spectroscopic dataset suggests that for worse quality spectroscopic datasets (e.g. fainter Galactic OB stars, or extra-galactic objects) we can adopt the values derived from the GOF method, as it is less sensitive to noise than the FT method, as far a radial-tangential formulation is adopted and a photospheric, unblended metal line is used for the analysis.
4.2 Macroturbulent broadening in Galactic OB stars
Fig. 9 shows the sin and measurements of the whole sample plotted against spectral types for three different luminosity classes. Following Sect. 3.5.3, all measurements for stars with sin 180 km s-1 have been marked as upper limits in lower panels. We also indicate with grey zones the regions in which sin and measurements can be importantly affected be the effect of microturbulence (see Sect. 3.4). In particular, we remind here that, within these regions, any measurement could be completely attributable to microturbulence, and any sin measurement must be considered as an upper limit.
At this point, the upper panels in Fig. 9 are only included for comparative purposes (in terms of range of measured values, trends and dispersion) with the information provided in lower panels. A more detailed discussion of the sin distributions (in a global sense and separated by spectral types and luminosity classes) is presented in Sects. 4.3.2 and 4.3.3.

An important outcome from our study is the confirmation that the so-called macroturbulent broadening is present not only in B Sgs, but also in O-type stars of all luminosity classes (as the analysis of smaller samples have also began to show e.g. Bouret et al., 2012; Markova et al., 2013). This result has very important implications for our knowledge about rotational properties of massive stars based on results from previous studies using methods that do not properly disentangle rotation from macroturbulent broadening (see Sect. 4.3).
It is also interesting to remark the strong correlations (with some dispersion) found between and spectral type, and the fact that the size of the macroturbulent broadening seems to be slightly larger for Supergiants than for Giants and Dwarfs with the same spectral type666This second statement must be considered carefully, since our measurements include both the effect of macro- and microturbulence (see notes in Sect. 3.4)..
Further information about the observational characteristics of the macroturbulent broadening (this time vs. sin ) is presented in Fig. 10. Results for the global sample are separated in three panels, from top to bottom, supergiants, (bright) giants, and dwarfs. O and B-type stars are presented as filled and dotted circles, respectively. All measurements for stars with sin 180 km s-1 are indicated as upper limits. These are included for completeness, but eliminated from the discussion below. The regions where sin and measurements can be affected by microturbulence are also indicated. Dashed lines show the 1:1 relation. These lines roughly separate the regions where either rotational or macroturbulent broadening dominates.
The first thing to note is the very different dependence of the macroturbulent broadening with sin for the three luminosity classes in O and early-B type stars. While the distribution of stars in the vs. sin plane is very similar for O Supergiants, Giants, and Dwarfs (with sin 180 km s-1!), the relative number of early B-type stars in which macroturbulence dominates decreases from Supergiants to Dwarfs. In particular, we do not find any early-B dwarf in our sample with a dominant macroturbulent component and, on the contrary, all but two B Sgs are dominated by non-rotational broadening. The two exceptions are HD 47240 and HD 191877, both classified as B1 Ib, and the first one showing disc-like features in its spectrum (see also Lefever et al. 2007). We note that these two stars are also the only B Sgs in our sample having a projected rotational velocity larger than 100 km s-1.
Fig. 10 also shows a strong correlation between and sin in the region where macroturbulent broadening dominates. This correlation has been also pointed out by Markova et al. (2013) in a parallel work combining own results and values from other authors in the literature. The correlation occurs for a range in the / sin ratio between 1 and 2.2 (the later being marked with the dotted line). Interestingly, while the relative number of early B-type stars within this region diminishes when moving from luminosity class I to V, all O and early-B stars having sin follow a similar behavior in terms of relative broadening.
This is not the case in the region below the 1:1 relation, where the line-broadening behavior of O and early-B stars is very different. On the one hand, O-type stars mainly concentrate on a second sequence characterized by having / sin 0.7 and which is independent of luminosity class. On the other hand, in the case of early B giants and dwarfs (only two Sgs are found in this region), the macroturbulent broadening contribution is negligible (and probably attributable to microturbulence, see below) below sin 80 – 100 km s-1, and seems to increase with sin above this value.
It is also interesting to have a look at the percentage of stars found within or close to the region where the measured could be interpreted as microturbulence (see also Fig. 9). All supergiants (but one with sin 200) have values above the 40 km s-1 limit indicated in Sect. 3.4. In the case of (bright) giants there are a few early-B stars (but no O-type stars) close to the limit of 30 km s-1. Interestingly, some of them correspond to non-radial Cep-type pulsators (the case illustrated in Fig. 8). Finally, the number of dwarfs with sin 150 km s-1 in which the measured can be actually attributed to microturbulence is larger. These are mainly early-B and late-O dwarfs.
These results impose strong observational constraints to any theoretical attempt to provide an explanation for this line-broadening of still not confirmed physical origin. While in this paper we mainly concentrate on the impact of macroturbulent broadening on measurements of projected rotational velocities in Galactic OB stars, in a forthcoming paper (see Simón-Díaz et al., 2012, for some preliminary results) we will investigate whether the pulsational hypothesis proposed by Lucy (1976) and Aerts et al. (2009) fulfills the above mentioned observational requirements. We also refer the reader to Markova et al. (2013) where some first steps towards the understanding of the observational characteristics of the extra line-broadening as a function of stellar parameters and evolution is presented.
4.3 Projected rotational velocities in Galactic OB stars
4.3.1 Comparison with previous works: the effect of macroturbulent broadening
The main reference studies of rotational velocities in large samples of Galactic O and early B-type stars are those by Slettebak (1956), Conti & Ebbets (1977, CE77), Penny (1996, P96) and Howarth et al. (1997, H97). All these studies based their sin measurements in methodologies that assume that the line profile is exclusively broadened by rotation. These and even earlier authors (viz. Struve, 1952) already indicated, following indirect statistical arguments, that rotation was very likely not the only broadening agent of metal lines in early-type stars. They argued that the absence of very narrow line stars in their large samples could be explained by assuming the presence of a type of extra line-broadening.
As stated in the introduction, the advent of high resolution, very efficient spectrographs has allowed us to surpass the limitations imposed by observations in the first attempts to separate the various broadening contributions (e.g. Slettebak, 1956), as well as to confirm their suspicion. The analysis of these improved datasets definitely shows that sin measurements not accounting for the extra-broadening overestimate the actual projected rotational velocities (see Simón-Díaz, 2011, and references therein)
Comparisons with earlier studies not considering macroturbulence can be found, among others, in Fraser et al. (2010), who presented a comparison of 42 B Sgs in common with with H97 (with spectral types ranging from B0 to B5), or in a study parallel to ours by Markova et al. (2013), who have compared their sin (FT) results with those obtained by H97 for a small (but representative) sample of Galactic O-type stars. In this paper, we extend such an investigation using a larger sample of Galactic O and early-B type stars analyzed homogeneously.
For the sake of clarity, and taking into account that similar conclusions are
expected to arise when considering the other studies, we concentrate
our investigation in the comparison of our measurements with those derived by H97.
These authors provided estimates for the sin linewidth parameter
for 373 Galactic O-type and early B-Sgs obtained by means of the application of a
cross-correlation technique to high dispersion IUE spectra. The derived quantities
are hence representative of the projected rotational velocities which will be
derived when only rotation is taken into account (i.e. are similar to the cases of
Slettebak, Conti & Ebbets, and Penny).
We have 100 stars in common with them (namely 80 O-type stars and 20 early-B Sgs). Results from the comparison of the global sample are presented in Fig. 11. As expected, our estimates are systematically lower below sin 100 km s-1. Globally, there is a systematic offset in this sin regime of 25 km s-1; however, differences of up to 50 km s-1 can be found in some cases with intermediate projected rotational velocities. On the other hand, while there is a relatively good agreement above sin 120 km s-1, the intermediate region presents a combined situation in which the extra-broadening is still affecting the sin measurements in some cases (mainly O stars, see below). The impact on the global sin distribution is clear: the peak of the distribution is shifted downwards from 90 km s-1 to 50 km s-1, and the number of cases with sin below 40 km s-1 is multiplied by a factor 2.
Comparison of results for the O stars and B Sgs samples is presented separately in Figs. 12 and 13, respectively. Once more, the effect of the non-rotational broadening on sin determinations is shown to be important not only in B Sgs, but also in O stars of all luminosity classes. Even O dwarfs with low sin are affected.
For the sake of completeness, we must remark here that the statement about the downward revision of previous sin determinations is not applicable for the case of early-B dwarfs. As shown in Fig. 10, the macroturbulent contribution to the line-profile is negligible compared to rotational broadening and hence a very good agreement between sin (FT) and any measurement not accounting for macroturbulent broadening is expected.


4.3.2 The new sin distributions
Fig. 14 groups the histograms resulting from the analysis of the global IACOB sample separated by spectral type (rows) and luminosity class (columns). The row at the top includes all the O-type stars, while the bottom row corresponds to the early B-type stars. Panels in between show the distributions for the O stars separated in early, mid and late spectral types, respectively.
Before we start commenting on this figure it should be noted that the histogram corresponding to the early-B dwarfs has been only included for completeness, but must be left out from any discussion about sin distributions since at present the IACOB spectroscopic database is totally biased towards (relatively) narrow line stars for these specific stars777The early-B dwarfs in the IACOB spectroscopic database mainly come from the study of abundances in B-type stars in Orion OB1 (Simón-Díaz, 2010; Nieva & Simón-Díaz, 2011) and the construction of an atlas of standard stars for spectral classification at intermediate and high resolution.. For a more complete overview of the distribution of projected rotational velocities in B-type stars in the Milky Way we refer to, e.g., Abt et al. (2002), Strom et al. (2005), Huang & Gies (2006, 2008), Wolff et al. (2007), Huang et al. (2010), Bragança et al. (2012). In all these works it is shown that the distribution of projected rotational velocities of early-B dwarfs extends further to sin values higher than 200 km s-1.
The number of stars in some of the histograms is not large enough to extract conclusions with the desired statistical significance; however, we can already highlight some trends (many of them in concurrence with previous studies by CE77, P96, and H97). As already stated in previous works the global sample of Galactic O stars presents a bimodal distribution, containing a slow group with a sin peak near 40 – 60 km s-1 and a fast group extending up to 400 km s-1. Interestingly, the low sin peak has been now revised downwards with respect to the 80 – 100 km s-1 indicated by CE77, P96, and H97. This is basically an effect of the separation of the macroturbulent contribution to the total broadening (see Sect. 4.3.1).
This bimodal distribution has been also recently obtained by Ramírez-Agudelo et al. (2013) in their study of rotational velocities in the O-star population of the 30 Doradus region. A similar analysis of 216 apparently single O-type stars in this star forming region of the Large Magellanic Cloud led to a low sin peak located at 40 – 80 km s-1, and the high sin tail extending up to 600 km s-1. In the case of stars in 30 Dor, the high sin tail extends further towards higher rotation speeds as expected from the lower metal content of the region (Z 0.5 Z⊙). Unfortunately, the accuracy of sin measurements in the study by Ramírez-Agudelo et al. does not allow to firmly conclude if there is any difference in the location of the peak distribution.
| SpT & LC | sin [km s-1] | ||||
|---|---|---|---|---|---|
| All LC | 50 | 200 | 200 | 300 | All |
| O stars | 31 ( 26%) | 90 ( 77%) | 26 ( 22%) | 12 ( 10%) | 116 |
| Early B Sgs | 10 ( 50%) | 20 (100%) | 0 ( 0%) | 0 ( 0%) | 20 |
| (V – IV) | 50 | 200 | 200 | 300 | All |
| All O | 24 ( 42%) | 41 ( 71%) | 16 ( 28%) | 8 ( 14%) | 57 |
| Early O | 3 | 10 | 3 | 2 | 13 |
| Mid O | 9 | 15 | 10 | 5 | 25 |
| Late O | 12 | 16 | 3 | 1 | 19 |
| (III – II) | 50 | 200 | 200 | 300 | All |
| All O | 4 ( 11%) | 25 ( 73%) | 9 ( 26%) | 4 ( 11%) | 34 |
| Early O | 0 | 2 | 1 | 0 | 3 |
| Mid O | 0 | 11 | 3 | 1 | 14 |
| Late O | 4 | 12 | 5 | 3 | 17 |
| (I) | 50 | 200 | 200 | 300 | All |
| All O | 1 ( 4%) | 22 ( 95%) | 1 ( 4%) | 0 ( 0%) | 23 |
| Early O | 0 | 2 | 1 | 0 | 3 |
| Mid O | 0 | 6 | 0 | 0 | 6 |
| Late O | 1 | 14 | 0 | 0 | 14 |
CE77 indicated by that time that we were somewhat at a loss to understand the apparent existence of a bimodal distribution for the main sequence O stars. Nowadays, we count on a interesting scenario to explain this result (de Mink et al., 2013). In brief, these authors propose that the observed distribution may be a consequence of the combined effect of stellar winds, expansion, tides, mass trasfer, and mergers. In particular, the high sin tail would mainly contain products resulting from massive star binary interaction. For the purpose of comparison with the predictions by de Mink et al. (or any new proposed scenario), we indicate in Table 1 the number and percentage of stars in various sin ranges of interest. It is specially remarkable the good agreement between the predictions by de Mink et al., under the assumption of constant star formation rate, and our percentages of observed O stars with sin 200 and 300 km s-1 (23% and 11%, respectively). We should also note that these percentages are almost equal to those resulting from the studies by CE77, P96 and H97. This is a consequence of the fact that above 120 km s-1 the effect of the macroturbulent contribution to the global broadening is practically negligible when compared to rotational broadening (see Sect. 4.3.1).
If we now split the distribution of projected rotational velocities in spectral type and luminosity class it can be concluded that the high velocity tail completely disappear in the case of O Sgs (see also Table 1), where stars concentrate at sin = 40 – 140 km s-1. Interestingly, the distribution of B Sgs (which are considered the evolved stages of the mid and early O-type stars) also present a single peak distribution concentrated in the low sin regime. This result was already pointed out by H97; the only difference found here is that while H97 found the peaks of the two distributions at 90 and 70 km s-1 (O and B Sgs, respectively), our results led to 70 km s-1, and 50 km s-1, respectively.
Another result that has attracted our attention refers to the comparison of sin distributions corresponding to the evolutionary sequence starting in the mid-O dwarfs and ending in the early-B Sgs (i.e. the diagonal going from the O7 – O8.5 V – IV panel to the B0 – B2 I panel). Independently of the origin of the high sin tail, the (almost) absence of early-B Sgs with projected rotational velocities larger than 100 km s-1, can be used as a observational evidence that evolution makes fast rotators to spin down very efficiently. However, if the same mechanisms which make these stars to slow down affect all mid-O dwarfs, we would expect a larger number of early-B Sgs with lower sin . In fact, the peak of the distribution of early-B Sgs is located at somewhat higher sin values than that corresponding to the mid-O dwarfs. This result, also indicated by Howarth (2004) in a more general context, was used by previous authors as an indirect proof of the presence of some non-rotational macroscopic line broadening operating in massive stars. However, the techniques applied here are supposed to provide actual projected rotational velocities. Therefore, either there is something that we still do not understand from an evolutionary point of view (e.g. is the mechanism reducing the surface rotation of massive stars different for the case of fast rotators and intermediate and low sin stars?), or our efforts to separate rotation from other sources of line-broadening are still failing in some cases.
In next section we discuss in more detail this (and other) remaining issues regarding the low sin region of the distributions, also providing a possible explanation and some guidelines for future investigation.
4.3.3 The low sin regime
The longstanding problem of the small number of low sin O-type stars and early-B Sgs (CE77, P96, H97) seems now to be partially solved in view of the diagrams presented in Figs 11, 12, and 13. In particular, in Sect. 4.3.2, we pointed out when comparing with previous results by H97 that the number of O stars with measured sin values below 40 km s-1 is now multiplied by a factor 2. However, looking closer to the sin distributions separated by spectral type and luminosity class (Fig. 14) one could conclude that, despite this improvement, there still seems to be some limitation in the detectability of the very low sin stars. Apart from the evolutionary considerations indicated at the end of previous section, looking at Fig. 15, where we show the minimum detected sin in different spectral type boxes, and taking into account statistical arguments based on the probability to find stars with a given inclination angle, it is remarkable that:
-
•
No O Sgs with sin 50 km s-1are still found888Actually, there is one star (HD 37742), but is has sin = 48 km s-1.. The situation is even more critical for the case of mid and early O Sgs, where the lower sin measured is 60 km s-1. We should note, however, the very low statistics in this later case (only 7 stars analyzed).
-
•
While the relative number of B0 – B2 Sgs with measured projected rotational velocities below 50 km s-1 is considerably larger ( 50%), the FT+GOF analysis does not result in a sin 35 km s-1 for any of them, and only 2 from a total of 20 have a sin 40 km s-1.
-
•
There is no problem with the relative number of low sin stars found in the case of early-B and late-O dwarfs. There is a fair number of O9 – B2 dwarfs in the IACOB sample with measured sin below 40 km s-1, and the lower sin measured for this category is of the order of 10 km s-1.
-
•
But for mid- and early-O dwarfs there seems to still be a limit in the minimum detected sin . This limit increases from 25 km s-1 in the case of mid-O dwarfs to 40 km s-1 for the dwarfs with spectral types earlier than O6.5.
-
•
A similar situation occurs for the O stars with luminosity classes III and II (this time also including the late O spectral types). Again, the lower limit in the measured sin increases from 30 km s-1to 55 kms from the latest to the earliest spectral types.
-
•
Finally, a low sin limit of 25 km s-1 is also found in the early-B (bright) giants

One possible explanation of this dependence of the minimum detected sin on spectral type and luminosity class is related to the effect of microturbulence on sin measurements. As indicated in Sect. 3.4, microturbulence can impose a lower limit of detectability on the actual projected rotational velocity when a strategy similar to the one considered in our study is applied. The rough estimates obtained from the exercise presented in Sect. 3.4 indicate that for a star with a microturbulence of 20 km s-1, any sin 35 km s-1, should be actually considered as an upper limit. Since microturbulent velocities 15 – 20 km s-1are typically found for early-B Sgs, this may explain why no B Sgs with sin 40 km s-1 are still found. On the other hand, microturbulent velocities in the range 1 – 7 km s-1 and 10 – 15 km s-1 (rough numbers!) are derived in the case of B dwarfs and giants, respectively. This would make the effect of microturbulence not so critical for B dwarfs (as indicated in Sect. 3.4 if microturbulence is 5 km s-1 the upper sin limit moves down to 10 km s-1), and intermediate for B giants.
What about mid and early O-type stars? Unfortunately, a direct estimation of microturbulent velocities from the analysis of observed spectra of mid and early O-type stars is not so straightforward as in the case of B-type and late O-type stars Extrapolating the trends of microturbulence observed for B-type stars (where it is found that microturbulent velocities are a factor 2 – 3 larger in early-B than in late-B Sgs) to the O-type stars domain could explain the tendency observed in Fig. 15. However, this is by far too risky and, in addition, the associated microturbulent velocities expected for the earliest spectral types would be too large.
One could also consider the predictions by Cantiello et al. (2009). These authors proposed that a physical connection may exist between microturbulence in hot star atmospheres and sub-photospheric convective motions associated to the iron convection zone. Under this hypothesis, they predict the regions in the HR diagram where larger values of microturbulent velocities should be expected. Interestingly, while the predictions for the late-O/early-B star domain roughly follow the observed tendency, values of microturbulence predicted for early and mid O-dwarfs are not expected to be specially large compared to later spectral types.
5 Summary and future prospects
In this paper we reassess previous determinations of projected rotational velocities ( sin ) in Galactic OB stars using a large, high quality spectroscopic dataset (drawn from the IACOB spectroscopic database of Northern Galactic OB stars) and a powerful technique which accounts for other sources of broadening appart from rotation affecting the diagnostic lines. In particular, we investigate the effect of macroturbulent and microturbulent broadenings on sin measurements.
Motivated by the investigation presented in this paper we have developed a versatile and user friendly IDL tool — based on a combined Fourier transform (FT) + goodness of fit (GOF) methodology — for the line-broadening characterization in OB-type stars: the iacob-broad. The procedure allows it to extract information about sin and the macroturbulent broadening () from the stellar line-profiles under a variety of situations. The iacob-broad tool has been used for three purposes:
-
1.
The investigation of the effect that the assumed macroturbulent profile (either isotropic Gaussian or radial-tangential) has on the GOF-based sin and estimations.
-
2.
The investigate of the possible consequences of neglecting the effect of microturbulence on the determination of these two quantities
-
3.
The determination of sin and the size of the macroturbulent broadening in a sample of 200 Galactic OB-type stars with spectral types ranging from O4 to B2 and covering all luminosity classes. In particular, we wanted to compare the derived sin with previous determinations not accounting for the macroturbulent broadening contribution.
We show that sin and determined by means of the GOF method critically depend on the assumed macroturbulent profile, and present further observational evidence supporting a previous statement quoted in Simón-Díaz et al. (2010) indicating that a radial-tangential description is better suited to infer GOF-based projected rotational velocities. While the derived sin (GOF,) values are in perfect agreement with those resulting from the FT analysis, the isotropic Gaussian profile systematically led to much lower values of sin .
The very good agreement found between sin (FT) and sin (GOF, ) from the analysis of our high resolution, high S/N spectroscopic dataset suggests that for worse quality datasets (e.g. fainter Galactic OB stars, or extragalactic objects) we can adopt the values provided by the GOF method, as it is less sensitive to noise than the FT method, as far as a radial-tangential formulation of the macroturbulent profile is adopted.
We also warn about the danger of combining measurements of the macroturbulent velocity provided by different authors in the literature if they are obtained by assuming a different macroturbulent profile.
Following the guidelines by Gray (1976), we show that any sin and measurement in OB-type stars (either from FT of GOF) below 40 km s-1 must be considered as an upper limit if the effects of microturbulence are not taken into account in the line-broadening analysis.
An important outcome from our study is the confirmation that the macroturbulent broadening is present not only in B Sgs, but also in O-type stars of all luminosity classes (as the analysis of smaller samples had already began to show). As a consequence, those previous determinations of sin in these type of stars asumming that rotation is the sole source of line-broadening below 120 km s-1need to be systematically revised downwards999This statement is not applicable to early-B dwarfs, where the macroturbulent broadening contribution to the line profiles is negligible. by 25 (20) km s-1. This implies important modifications of the distributions of projected rotational velocities in Galactic OB-type stars. In particular the low sin peak previously found in 80 – 100 km s-1 (in the global sin distributions) has now been revised downwards to 40 – 60 km s-1.
Although the longstanding problem of the small number of low sin O-type stars and early-B Sgs has been now partially solved, there seems to still remain some limitation in the detectability of the very low sin stars, specially for the case of mid and early O stars and the early-B Sgs. We have found some interesting trends of the minimum detected sin in our analized sample of Galactic stars with spectral type and luminosity class. We indicate that this result could be an effect due to the limitations of the FT+GOF strategy when microturbulence is not taken into account.
It is still too premature to conclude that the effect of microturbulence on sin measurements is the cause of this observational result; however, this is an interesting possibility that should be explored in more detail in the future. As a guide we propose three different aspects to be investigated: (a) from a methodological point of view, is it possible to disentangle the spectroscopic features (either in the wavelength or the Fourier domains) associated to microturbulence from those exclusively produced by rotation?, (b) from an observational point of view, can we increase our knowledge about the microturbulence in O-type stars?, and (c) from a theoretical/modeling point of view, explore further the scenario proposed by Cantiello et al. (2009) and compare the corresponding predictions with observational constraints.
In addition, the extension of this type of study to other metallicities (also increasing the number of analyzed stars in the Galaxy with the incorporation of the Southern sample), and the exploration of other possible effects which could invalidate our state-of-the-art techniques used to measure projected rotational velocities in O and B-type stars (under certain circumstances) are also warranted.
Acknowledgements.
This work has been funded by the Spanish Ministry of Economy and Competitiveness (MINECO) under the grants AYA2010-21697-C05-04, Consolider-Ingenio 2010 CSD2006-00070, and Severo Ochoa SEV-2011-0187, and by the Canary Islands Government under grant PID2010119. SS-D kindly acknowledge the staff at the Nordic Optical Telescope for their professional competence and always useful help during more than 50 observing nights between 2008 and 2013. Also to my observing colleagues I. Negueruela, J. Lorenzo, N. Castro and M. Garcia. We are extremely grateful to N. Langer and the referee, F. Royer, for the time devoted to read the first version of the paper and his very useful and constructive comments.References
- Abt et al. (2002) Abt, H. A., Levato, H., & Grosso, M. 2002, ApJ, 573, 359
- Aerts et al. (2009) Aerts, C., Puls, J., Godart, M., & Dupret, M.-A. 2009, A&A, 508, 409
- Aerts et al. (2013) Aerts, C., Simón-Díaz, S., Catala, C., et al. 2013, A&A, 557, A114
- Bouret et al. (2012) Bouret, J.-C., Hillier, D. J., Lanz, T., & Fullerton, A. W. 2012, A&A, 544, A67
- Bouret et al. (2013) Bouret, J.-C., Lanz, T., Martins, F., et al. 2013, A&A, 555, A1
- Bragança et al. (2012) Bragança, G. A., Daflon, S., Cunha, K., et al. 2012, AJ, 144, 130
- Cantiello et al. (2009) Cantiello, M., Langer, N., Brott, I., et al. 2009, A&A, 499, 279
- Carroll (1933) Carroll, J. A. 1933, MNRAS, 93, 478
- Conti & Ebbets (1977) Conti, P. S., & Ebbets, D. 1977, ApJ, 213, 438
- de Mink et al. (2013) de Mink, S. E., Langer, N., Izzard, R. G., Sana, H., & de Koter, A. 2013, ApJ, 764, 166
- Degroote et al. (2010) Degroote, P., Briquet, M., Auvergne, M., et al. 2010, A&A, 519, A38
- Dufton et al. (2006) Dufton, P. L., Ryans, R. S. I., Simón-Díaz, S., Trundle, C., & Lennon, D. J. 2006, A&A, 451, 603
- Dufton et al. (2013) Dufton, P. L., Langer, N., Dunstall, P. R., et al. 2013, A&A, 550, A109
- Ebbets (1979) Ebbets, D. 1979, ApJ, 227, 510
- Fraser et al. (2010) Fraser, M., Dufton, P. L., Hunter, I., & Ryans, R. S. I. 2010, MNRAS, 404, 1306
- Frémat et al. (2005) Frémat, Y., Zorec, J., Hubert, A.-M., & Floquet, M. 2005, A&A, 440, 305
- Georgy et al. (2009) Georgy, C., Meynet, G., Walder, R., Folini, D., & Maeder, A. 2009, A&A, 502, 611
- Gray (1973) Gray, D. F. 1973, ApJ, 184, 461
- Gray (1976) Gray, D. F. 1976, Research supported by the National Research Council of Canada. New York, Wiley-Interscience, 1976. 484 p.,
- Gray (2005) Gray, D. F. 2005, The Observation and Analysis of Stellar Photospheres, 3rd Edition, ISBN 0521851866, Cambridge University Press
- Grunhut et al. (2012) Grunhut, J. H., Wade, G. A., Sundqvist, J. O., et al. 2012, MNRAS, 426, 2208
- Howarth et al. (1997) Howarth, I. D., Siebert, K. W., Hussain, G. A. J., & Prinja, R. K. 1997, MNRAS, 284, 265
- Howarth (2004) Howarth, I. D. 2004, Stellar Rotation, 215, 33
- Huang et al. (2010) Huang, W., Gies, D. R., & McSwain, M. V. 2010, ApJ, 722, 605
- Huang & Gies (2006) Huang, W., & Gies, D. R. 2006, ApJ, 648, 580
- Huang & Gies (2008) Huang, W., & Gies, D. R. 2008, ApJ, 683, 1045
- Hunter et al. (2008) Hunter, I., Lennon, D. J., Dufton, P. L., et al. 2008, A&A, 479, 541
- Hunter et al. (2009) Hunter, I., Brott, I., Langer, N., et al. 2009, A&A, 496, 841
- Langer (2012) Langer, N. 2012, ARA&A, 50, 107
- Lefever et al. (2007) Lefever, K., Puls, J., & Aerts, C. 2007, A&A, 463, 1093
- Lefever et al. (2010) Lefever, K., Puls, J., Morel, T., et al. 2010, A&A, 515, A74
- Lucy (1976) Lucy, L. B. 1976, ApJ, 206, 499
- Maeder (1987) Maeder, A. 1987, A&A, 178, 159
- Maeder & Meynet (2000) Maeder, A., & Meynet, G. 2000, ARA&A, 38, 143
- Markova & Puls (2008) Markova, N., & Puls, J. 2008, A&A, 478, 823
- Markova et al. (2013) Markova, N., Puls, J., Simón-Díaz, S., et al. 2013, A&A (in press)
- Nieva & Simón-Díaz (2011) Nieva, M.-F., & Simón-Díaz, S. 2011, A&A, 532, A2
- Penny (1996) Penny, L. R. 1996, ApJ, 463, 737
- Przybilla et al. (2010) Przybilla, N., Firnstein, M., Nieva, M. F., Meynet, G., & Maeder, A. 2010, A&A, 517, A38
- Puls et al. (2005) Puls, J., Urbaneja, M. A., Venero, R., et al. 2005, A&A, 435, 669
- Ramírez-Agudelo et al. (2013) Ramírez-Agudelo, O. H., Simón-Díaz, S., Sana, H., et al. 2013, arXiv:1309.2929
- Ryans et al. (2002) Ryans, R. S. I., Dufton, P. L., Rolleston, W. R. J., et al. 2002, MNRAS, 336, 577
- Sana et al. (2012) Sana, H., de Mink, S. E., de Koter, A., et al. 2012, Science, 337, 444
- Santolaya-Rey et al. (1997) Santolaya-Rey, A. E., Puls, J., & Herrero, A. 1997, A&A, 323, 488
- Simón-Díaz & Herrero (2007) Simón-Díaz, S., & Herrero, A. 2007, A&A, 468, 1063
- Simón-Díaz (2010) Simón-Díaz, S. 2010, A&A, 510, A22
- Simón-Díaz et al. (2010) Simón-Díaz, S., Herrero, A., Uytterhoeven, K., et al. 2010, ApJ, 720, L174
- Simón-Díaz (2011) Simón-Díaz, S. 2011, Bulletin de la Societe Royale des Sciences de Liege, 80, 86
- Simón-Díaz et al. (2011a) Simón-Díaz, S., Castro, N., Garcia, M., Herrero, A., & Markova, N. 2011, Bulletin de la Societe Royale des Sciences de Liege, 80, 514
- Simón-Díaz et al. (2011b) Simón-Díaz, S., Garcia, M., Herrero, A., Maíz Apellániz, J., & Negueruela, I. 2011, Stellar Clusters and Associations: A RIA Workshop on Gaia, 255
- Simón-Díaz et al. (2012) Simón-Díaz, S., Castro, N., Herrero, A., et al. 2012, Proceedings of a Scientific Meeting in Honor of Anthony F. J. Moffat, 465, 19
- Slettebak (1956) Slettebak, A. 1956, ApJ, 124, 173
- Smith & Gray (1976) Smith, M. A., & Gray, D. F. 1976, PASP, 88, 809
- Sota et al. (2011) Sota, A., Maíz Apellániz, J., Walborn, N. R., et al. 2011, ApJS, 193, 24
- Strom et al. (2005) Strom, S. E., Wolff, S. C., & Dror, D. H. A. 2005, AJ, 129, 809
- Struve (1952) Struve, O. 1952, PASP, 64, 117
- Sundqvist et al. (2013) Sundqvist, J. O., Simón-Díaz, S., Puls, J., & Markova, N. 2013, A&ALetters (in press), arXiv:1310.4729
- Townsend et al. (2004) Townsend, R. H. D., Owocki, S. P., & Howarth, I. D. 2004, MNRAS, 350, 189
- Wilson (1969) Wilson, A. 1969, MNRAS, 144, 325
- Wolff et al. (2007) Wolff, S. C., Strom, S. E., Dror, D., & Venn, K. 2007, AJ, 133, 1092
Appendix A Tables
| HD number | SpT | LC | Line | EW | S/N | sin (FT) | sin (GOF) | (GOF) |
| [mÅ] | [km s-1] | [km s-1] | [km s-1] | |||||
| … | … | … | … | … | … | … | … | … |
| HD91316 | B1 | IabNstr | SiIII | 425 | 370 | 49 | 49 | 72 |
| … | … | … | … | … | … | … | … | … |
| HD number | SpT | LC | Line | EW | S/N | sin (FT) | sin (GOF) | (GOF) |
| [mÅ] | [km s-1] | [km s-1] | [km s-1] | |||||
| … | … | … | … | … | … | … | … | … |
| HD36861 | O8 | III((f)) | OIII | 301 | 292 | 57 | 60 | 60 |
| … | … | … | … | … | … | … | … | … |
| HD number | SpT | LC | Line | EW | S/N | sin (FT) | sin (GOF) | (GOF) |
| [mÅ] | [km s-1] | [km s-1] | [km s-1] | |||||
| … | … | … | … | … | … | … | … | … |
| HD46966 | O8.5 | IV | OIII | 172 | 244 | 39 | 39 | 68 |
| … | … | … | … | … | … | … | … | … |
| HD number | SpT | LC | Line | EW | S/N | sin (FT) | sin (GOF) | (GOF) |
| [mÅ] | [km s-1] | [km s-1] | [km s-1] | |||||
| … | … | … | … | … | … | … | … | … |
| HD37042 | B0.7 | V | SiIII | 149 | 217 | 33 | 33 | 13 |
| … | … | … | … | … | … | … | … | … |
| HD number | SpT | LC | Line | EW | S/N | sin (FT) | sin (GOF) | (GOF) |
| [mÅ] | [km s-1] | [km s-1] | [km s-1] | |||||
| … | … | … | … | … | … | … | … | … |
| HD199579 | O6.5 | V((f))z | OIII | 211 | 215 | 49 | 54 | 79 |
| … | … | … | … | … | … | … | … | … |