Frequency Dependence of the Supersolid Signature in Polycrystalline 4He
Abstract
We report studies, using a two mode torsional oscillator, of the putative supersolid signature in polycrystalline 4He. Measurements at two frequencies enable us to eliminate the viscoelastic contribution to the signature, and other instrumental effects arising from the temperature dependent shear modulus of the sample. The complex response function of the sample, encoded via its effective moment of inertia, shows an unexpected and unexplained frequency dependence. This cannot be accounted for by glassy dynamics within the sample. The results do not rule out the possibility of supersolidity in bulk solid 4He.
pacs:
67.80.-s, 67.25.dt, 66.30.Ma, 64.70.QThe supersolid state of matter corresponds to the coexistence of broken gauge symmetry and broken translational symmetry. This quantum state challenges our fundamental understanding of the essence of solidity. It was originally proposed theoretically that it could be realised in bulk solid 4He Andreev and Lifshitz (1969); Chester (1970); Leggett (1970), and the observations by Kim and Chan Kim and Chan (2004) triggered an explosion of both experimental and theoretical activity, and significant controversy. We refer to Chan (2008); Prokof’ev (2007); Balibar (2010); Boninsegni and Prokof’ev (2012); Galli and Reatto (2008) for recent reviews.
In Leggett’s original discussion of supersolidity Leggett (1970) he suggested it might be observed by detection of a non-classical rotational inertia (NCRI) in a DC rotation experiment, along the lines of the Hess-Fairbank Hess and Fairbank (1967) experiment on superfluid 4He. The experiments of Kim and Chan Kim and Chan (2004), followed by those of Rittner and Reppy Rittner and Reppy (2006) and others Kondo et al. (2007); Penzev et al. (2007); Aoki et al. (2007); Clark et al. (2007) were performed in a torsional oscillator (TO), where the specimen is subjected to an angular oscillation. They observed a drop in the oscillator’s period which was interpreted as a reduction of the specimen’s moment of inertia. This missing moment of inertia (MMI) was identified with NCRI and interpreted to be the signature of a supersolid transition.
The detection of the putative supersolid response using the torsional oscillator method is challenging, since measurements are performed on a solid, the elastic response of which may mask any small mass decoupling arising from supersolidity. Following the original “discovery” of supersolidity, the elastic modulus of solid 4He, the temperature dependence of which arises from the motion and pinning of dislocations, has been extensively investigated Day and Beamish (2007); Day et al. (2010); Syshchenko et al. (2010); Rojas et al. (2010); Haziot et al. (2013a); Balibar et al. (2012); Beamish (2012); Haziot et al. (2013b). A variety of ways sample elasticity can influence observations using torsional oscillators, has been discussed Balibar and Caupin (2008); Maris and Balibar (2010); Balibar et al. (2012). Essentially the elasticity can influence the observed oscillator frequency either (i) through its influence on the torsion constant, obscuring the changes we wish to detect in the moment of inertia Beamish et al. (2012); Maris (2012), or (ii) through the viscoelastic response of the solid helium specimen Yoo and Dorsey (2009); Reppy et al. (2012). However, the magnitude of these effects depends on, and can thus be controlled by, TO design parameters and sample geometry. They also depend on operating frequency. This has motivated the most recent work, using the torsional oscillator technique, to set limits on any possible supersolid signature Mi et al. (2014); Kim and Chan (2014).
Other earlier work emphasized the potential importance of the glassy dynamics of crystal defects Nussinov et al. (2007); Hunt et al. (2009); Gadagkar et al. (2012) in determining sample properties in a TO experiment. This perspective highlighted the critical importance of measuring and interpreting the full complex response function of the sample to oscillatory rotation. This provides a characteristic signature as the glassy component of the sample moves on cooling between the regimes to , where is the relaxation time of the glassy component. Indeed in previous work also, we found that characterizing TO measurements by a parametric plot of the real vs imaginary parts of the response (Cole-Cole plot), is a powerful method to fingerprint its underlying mechanisms. The two examples studied were (i) the vortex dynamics at a Kosterlitz-Thouless transition in two dimensional liquid 4He Bowley et al. (1998), first discovered by Bishop and Reppy Bishop and Reppy (1978) and (ii) the non-superfluid apparent mass decoupling of a sub-monolayer helium film on graphite Mohandas et al. (1995).
In this Letter we report new measurements using a compound torsional oscillator with two modes, widely separated in frequency by a factor of 5, to better disentangle the above competing effects. The sample geometry, a cylinder of diameter 14mm and height 2mm and hence relatively high aspect ratio, is tailored to have a negligible viscoelastic response. Our central result is that we find a frequency dependence of the complex response to angular oscillation of solid 4He, characterized by Cole-Cole plots, which is unusual and not explained by elastic response. These results, in the context of studies using a torsional oscillator and DC rotation which show an unexplained influence of the rotation on the period drop Choi et al. (2010, 2012); Yagi et al. (2011), add to the list of intriguing observations which may support the existence of a supersolid phase.
A conventional torsional oscillator operates at a single frequency. It is convenient to express its behaviour in terms of the rotational susceptibility
| (1) |
where is the oscillator’s moment of inertia, is the torsion constant and its dissipation coefficient (). Here is the quality-factor of the empty oscillator of resonant (angular) frequency . The effect of the helium specimen in the oscillator is embodied in the complex ‘effective moment of inertia’ function . The real part gives rise to period shifts and the imaginary part to dissipation. Different physical phenomena in the helium specimen will manifest as different functional forms for . (We note the connection between and the back action function of Nussinov et al. (2007): ).
is determined by measuring the shift of the period and dissipation from those of a reference state. In supersolid experiments it is convenient to choose this reference as full mass loading of the helium specimen. Then the period and dissipation shifts are related to by
| (2) |
where is the helium rigid body moment of inertia.
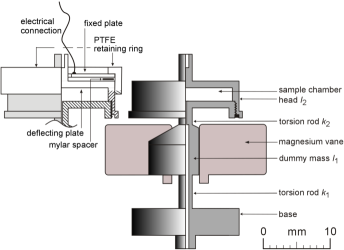
Ideally one would like to vary the frequency and thereby trace out the functional form of , in order to identify a potential supersolid response. But a conventional oscillator operates at a single frequency. It is possible, however, to construct a two-mode oscillator, as in Fig. 1. This method was first applied to the study of solid 4He in Aoki et al. (2007).
Such an oscillator has symmetric and anti-symmetric oscillation modes with (angular) frequencies and given by
| (3) |
where the oscillator elements have moments of inertia and and the rods have torsion constants and .
In a double oscillator the sensitivity of the period and dissipation shifts to will be different for the two modes; the analogue of Eq. (2) may be written
| (4) |
where and are the sensitivity factors, and
| (5) |
follow from differentiation of Eq. (3). In this way we see that by dividing the fractional period shift and dissipation shift measured at the antisymmetric/symmetric mode by we obtain the period shift and dissipation shift one would obtain from a single mode oscillator operating at frequency .
Our compound oscillator, constructed from coin silver, and incorporating an in situ pressure gauge, is shown in Fig. 1. The pressure was observed through the deflection of the upper surface of the sample chamber, sensed capacitively using a cryogenic back diode oscillator Degrift (1975). The gauge assembly was held tightly by a PTFE retaining ring, and the mylar spacer secured with vacuum grease. The helium specimen is contained in element 2 and the capacitive drive and pick-up occur through the vanes attached to element 1. The mode frequencies are Hz and Hz, a ratio of almost 5. At the higher AC drive levels a frequency stability of about 3 in was achieved at the high frequency mode and about 1 in at the low frequency mode.
The parameters for the double oscillator are experimentally determined, from Eq. (3), by filling the cell with solid helium, and measuring the change of frequency of both modes with mass loading. We determine: kg m2, kg m2, N m, N m. The results from filling with 4He and 3He are in good agreement.
Measurements were made on a poly-crystalline sample of 4He at a pressure of 42 bar, grown by the blocked capillary method. Fig. 2 shows measurements of the high and low mode oscillator period over the temperature range 700 mK to 15 mK for a range of excitation levels, following subtraction of the empty cell background.
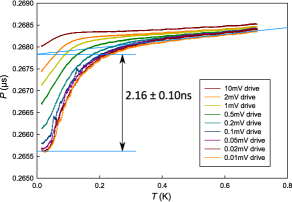
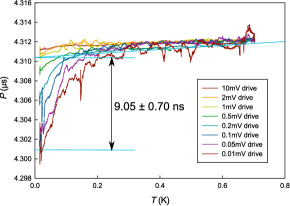
We note that for low excitations the period behaviour is independent of drive level 111A comparative analysis of the reduced response at higher drive levels for both modes implies a critical of 100 ms-1, as found by Aoki et al. (2007). See also Supplementary Information. We note that this contrasts with the critical amplitude (strain) effects observed in studies of the nonlinear elastic response Day et al. (2010).. There is a gentle period decrease on cooling from the high temperature end and a more rapid drop starting in the vicinity of 200 mK. We determined the period drop of the low-temperature feature by extending a straight line through the higher-temperature data, as shown on the figures, to give the full mass loading periods. In this way we determined the low-drive period drops associated with the low-temperature feature to be ns and ns for the antisymmetric and the symmetric modes.
We can express the apparent change in moment of inertia of the sample as a fraction of the rigid body helium moment of inertia, by multiplying the results of Eq. (4) by , where kg m2 is the moment of inertia of our helium specimen, at 42 bar. We obtain and .
Following Reppy Reppy et al. (2012), we plot the MMI as a function of frequency squared, Fig. 3, since elastic effects have this frequency dependence.
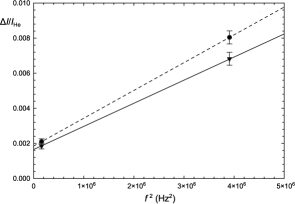
The zero-frequency intercept of the line in such a plot, in this case , has been proposed as the signature for the supersolid MMI fraction Mi and Reppy (2012). (We should note that the low frequency point is sufficiently close to the axis to give a good estimate of the zero frequency intercept directly). The double-frequency measurements on solid helium confined in a vycor matrix reported in Mi and Reppy (2012), when analysed in this way, show a zero or vanishingly small supersolid MMI, supporting recent measurements by Chan Kim and Chan (2012) on such a system and the contention that there is no supersolidity of 4He in a vycor matrix. On the other hand a recent measurement Mi et al. (2014) on bulk helium using a double oscillator yields a finite zero-frequency intercept, as found in our experiment.
One potential source of the squared frequency dependence is the viscoelastic response of the solid helium specimen. This leads to a frequency-dependent effective moment of inertia Yoo and Dorsey (2009); Reppy et al. (2012)
| (6) |
where are the radius and height of the cylindrical sample. is the helium density and its shear modulus. takes the value 0.112 for our high aspect ratio sample geometry. A stiffening of the helium in the cell, will affect directly, as in Eq. (6). This will lead to oscillator period shifts and dissipation, Eq. (4), since is complex. Beamish et al. Day and Beamish (2007) observed that the shear modulus of solid 4He increases significantly below 200 mK. The 8% measured values for the stiffening found in Syshchenko et al. (2010) would cause an increase in of 6.72 ps and an increase in of 10.3 ps, which are negligible. The corrections to the MMI arising from the temperature dependence of the shear modulus on the effective torsion constant Beamish et al. (2012); Maris (2012) are discussed in the Supplementary Information; they are shown in Fig. 3. These corrections are relatively modest (the scale of these effects could be reduced still further by improved oscillator design). The finite zero frequency intercept of the MMI plotted as a function of squared frequency is thus a robust result. It is consistent with a supersolid response, but could, in principle, have other explanations e.g. glassy dynamics.
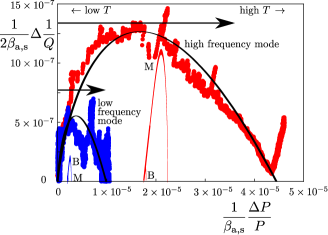
Therefore, as previously discussed, it is essential to evaluate the complex response function , and the potential contributions to it. The data at both frequencies are presented in Fig. 4, as a Cole-Cole plot. The estimated contributions of the effects discussed in Beamish et al. (2012); Maris (2012), modelled using results for the complex shear modulus Syshchenko et al. (2010) (see Supplementary Information) are shown at both frequencies and are modest.
The key result we must account for is the striking difference of the Cole-Cole plots for the two frequencies 222There are possibly hints of this in the analysis of the double oscillator experiment of Aoki et al. (2007), by Graf et al. (2011). However the TO data is subject to large corrections from elastic effects, see Fig. 1 in Beamish et al. (2012).. We find that a self-consistent explanation of the frequency dependence, under the hypothesis that the response arises from glassy dynamics, is not possible. To model the glassy dynamics of the 4He sample, we can introduce an effective moment of inertia, which might take the Cole-Cole Cole and Cole (1941) form or the Davidson-Cole Davidson and Cole (1951) form . We also consider a generalization of these, the the special Havriliak-Negami 333The Havriliak-Negami function S. Navriliak Jr. and Negami (1966) is a two-parameter generalization of the Cole-Cole and the Cole-Davidson functions with the form . The special form corresponds to the limiting case Havriliak and Havriliak (1994). form . The features of our plots rule out the first two: the asymmetry of the plots is incompatible with the Cole-Cole form which describes the chord of a circle, while the Davidson-Cole form cannot accommodate the asymmetry and the aspect ratio of the data. We adopt the special Havriliak-Negami form. This (as do all these forms) predicts that the plots for the two modes collapse onto a single curve, which is clearly not the case. A choice of exponent , corresponding to simple Debye relaxation with a single relaxation time, predicts an aspect ratio of the imaginary to real part of the Cole-Cole plot of 0.5, far away from the observed values of 0.04 for the low frequency mode and 0.03 for the high frequency mode. In other words the frequency shift is much larger than the corresponding dissipation maximum of this simple model, as found previously at a single frequency Hunt et al. (2009); the Cole-Cole plot is highly stretched along the normalised period shift axis. While this shape can be fitted at each frequency by adjusting the exponent , no consistent description can be found for the two modes; we find exponents and 0.07 for the high and low modes respectively – these are the solid lines through the data in Fig. 4.
The exponent may be regarded as characterizing a distribution of relaxation times Bertelsen and Lindgård (1974). Our values, close to zero, are striking; they correspond to a very flat distribution in ln . In stark contrast, we find that if the complex shear modulus data Syshchenko et al. (2010) are plotted on a Cole-Cole plot (see Supplementary Information), they are well described by the Davidson-Cole form with an exponent . An analysis Su et al. (2010) of the same data has shown that the Cole-Cole plots of measurements at 2, 20 and 200 Hz collapse, a property of both Cole-Cole or Davidson-Cole distributions. The non-collapse of the torsional oscillator response at two frequencies, and the different functional form for the Cole-Cole plot, strongly argues that a different mechanism governs the TO response 444We can introduce an ad hoc frequency dependence by multiplying the effective moment of inertia by a factor . For our measurements an index would provide the appropriate horizontal scaling of the plots of Fig. 4, but not map the Cole-Cole plots onto each other..
In the light of these results and analysis, we make the conjecture that the strong frequency response observed is an intrinsic property of supersolidity in bulk solid 4He at non-zero temperature. Since the wavefunction of the novel quantum condensate that describes both superfluid and solid order is not established, its physical manifestation is unclear. It is not unreasonable that DC superflow, which simple analogy with a conventional superfluid might lead us to expect, is not in fact supported by this ground state. The supersolid is likely to possess properties not found in conventional superfluids. For example, the superfluid density of the hcp crystal may be anisotropic 555This might lead to a sample geometry/orientation dependence of oscillator measurements Allen et al. (1982). And might a superfluid-like response be observable only at finite frequency? Decoherence of the quantum condensate by mobile dislocations in solid 4He could be important. In the light of the intriguing signatures already reported in rotation experiments Choi et al. (2010, 2012); Yagi et al. (2011), the study of the interplay of angular oscillation at different frequencies with rotation may be a fruitful avenue of investigation. The theoretical grounds for the likely emergence of a coherent quantum condensate in a bosonic solid, recently reasserted Anderson (2014), continue to provide a strong motivation for this experimental search.
We would like to thank Dave Bosworth for making the torsional oscillator components and Alan Betts for assembling them. We thank Jeevak Parpia for helpful discussions. Financial assistance from EPSRC and SEPnet are gratefully acknowledged.
References
- Andreev and Lifshitz (1969) A. F. Andreev and I. M. Lifshitz, Sov. Phys. JETP 29, 1107 (1969).
- Chester (1970) G. V. Chester, Phys. Rev. A 2, 256 (1970).
- Leggett (1970) A. J. Leggett, Phys. Rev. Lett. 25, 1543 (1970).
- Kim and Chan (2004) E. Kim and M. H. W. Chan, Science 305, 1941 (2004).
- Chan (2008) M. H. W. Chan, Science 319, 1207 (2008).
- Prokof’ev (2007) N. Prokof’ev, Adv. in Phys. 56, 381 (2007).
- Balibar (2010) S. Balibar, Nature 464, 176 (2010).
- Boninsegni and Prokof’ev (2012) M. Boninsegni and N. V. Prokof’ev, Rev. Mod. Phys. 84, 759 (2012).
- Galli and Reatto (2008) D. E. Galli and L. Reatto, J. Phys. Soc. Japan 77, 111010 (2008).
- Hess and Fairbank (1967) G. B. Hess and W. M. Fairbank, Phys. Rev. Lett. 19, 216 (1967).
- Rittner and Reppy (2006) A. S. C. Rittner and J. D. Reppy, Phys. Rev. Lett 97, 165301 (2006).
- Kondo et al. (2007) M. Kondo, S. Takada, Y. Shibayama, and K. Shirahama, J. Low Temp. Phys. 148, 695 (2007).
- Penzev et al. (2007) A. Penzev, Y. Yasuta, and M. Kubota, J. Low Temp. Phys. 148, 677 (2007).
- Aoki et al. (2007) Y. Aoki, J. C. Graves, and H. Kojima, Phys. Rev. Lett. 99, 015301 (2007).
- Clark et al. (2007) A. C. Clark, J. T. West, and M. H. W. Chan, Phys. Rev. Lett. 99, 135302 (2007).
- Day and Beamish (2007) J. Day and J. Beamish, Nature 450, 853 (2007).
- Day et al. (2010) J. Day, O. Syshchenko, and J. Beamish, Phys. Rev. Lett. 104, 075302 (2010).
- Syshchenko et al. (2010) O. Syshchenko, J. Day, and J. Beamish, Phy. Rev. Lett. 104, 195301 (2010).
- Rojas et al. (2010) X. Rojas, A. Haziot, V. Bapst, S. Balibar, and H. Maris, Phys. Rev. Lett. 105, 145302 (2010).
- Haziot et al. (2013a) A. Haziot, X. Rojas, A. Fefferman, J. R. Beamish, and S. Balibar, Phys, Rev. Lett. 110, 035301 (2013a).
- Balibar et al. (2012) S. Balibar, A. D. Fefferman, A. Haziot, and X. Rojas, J. Low Temp. Phys. 168, 221 (2012).
- Beamish (2012) J. Beamish, J. Low Temp. Phys. 168, 194 (2012).
- Haziot et al. (2013b) A. Haziot, A. D. Fefferman, J. R. Beamish, and S. Balibar, Phys. Rev. B 87, 060509(R) (2013b).
- Balibar and Caupin (2008) S. Balibar and F. Caupin, J. Phys. Cond. Matt. 20, 173201 (2008).
- Maris and Balibar (2010) H. J. Maris and S. Balibar, J. Low Temp. Phys. 160, 5 (2010).
- Beamish et al. (2012) J. R. Beamish, A. D. Fefferman, A. Haziot, X. Rojas, and S. Balibar, Phys. Rev. B 85, 180501(R) (2012).
- Maris (2012) H. J. Maris, Phys. Rev. B 86, 020502(R) (2012).
- Yoo and Dorsey (2009) C.-D. Yoo and A. T. Dorsey, Phys. Rev. B 79, 100504(R) (2009).
- Reppy et al. (2012) J. D. Reppy, X. Mi, A. Justin, and E. J. Mueller, J. Low Temp. Phys 168, 175 (2012).
- Mi et al. (2014) X. Mi, A. Eyal, A. V. Talanov, and J. D. Reppy, Preprint arXiv:1407.1515 (2014).
- Kim and Chan (2014) D. Y. Kim and M. H. W. Chan, Preprint arXiv:1407.2132 (2014).
- Nussinov et al. (2007) Z. Nussinov, A. Balatsky, M. Graf, and S. Trugman, Phys. Rev. B 76, 014530 (2007).
- Hunt et al. (2009) B. Hunt, E. Pratt, V. Gadagkar, M. Yamashita, A. V. Balatsky, and J. C. Davis, Science 324, 632 (2009).
- Gadagkar et al. (2012) V. Gadagkar, E. J. Pratt, B. Hunt, M. Yamashita, M. J. Graf, A. V. Balatsky, and J. C. Davis, J. Low Temp. Phys. 169, 180 (2012).
- Bowley et al. (1998) R. M. Bowley, A. D. Armour, J. Nyeki, B. P. Cowan, and J. Saunders, J. Low Temp. Phys. 113, 399 (1998).
- Bishop and Reppy (1978) D. J. Bishop and J. D. Reppy, Phys. Rev. Lett. 40, 1727 (1978).
- Mohandas et al. (1995) P. Mohandas, C. P. Lusher, V. A. Mikheev, B. Cowan, and J. Saunders, J. Low Temp. Phys. 101, 481 (1995).
- Choi et al. (2010) H. Choi, D. Takahashi, K. Kono, and E. Kim, Science 330, 1512 (2010).
- Choi et al. (2012) W. Choi, D. Takahashi, D. Y. Kim, H. Choi, K. Kono, and E. Kim, Phys. Rev. B 86, 174505 (2012).
- Yagi et al. (2011) M. Yagi, A. Kitamura, N. Shimizu, Y. Yasuta, and M. Kubota, J. Low Temp. Phys. 162, 492 (2011).
- Degrift (1975) C. T. V. Degrift, Rev. Sci. Instrum. 46, 599 (1975).
- Note (1) A comparative analysis of the reduced response at higher drive levels for both modes implies a critical of 100 ms-1, as found by Aoki et al. (2007). See also Supplementary Information. We note that this contrasts with the critical amplitude (strain) effects observed in studies of the nonlinear elastic response Day et al. (2010).
- Mi and Reppy (2012) X. Mi and J. D. Reppy, Phys. Rev. Lett. 108, 225305 (2012).
- Kim and Chan (2012) D. Y. Kim and M. H. W. Chan, Phys. Rev. Lett 109, 155301 (2012).
- Note (2) There are possibly hints of this in the analysis of the double oscillator experiment of Aoki et al. (2007), by Graf et al. (2011). However the TO data is subject to large corrections from elastic effects, see Fig. 1 in Beamish et al. (2012).
- Cole and Cole (1941) K. S. Cole and R. H. Cole, J. Chem. Phy. 9, 341 (1941).
- Davidson and Cole (1951) D. W. Davidson and R. Cole, J. Chem. Phys. 19, 1484 (1951).
- Note (3) The Havriliak-Negami function S. Navriliak Jr. and Negami (1966) is a two-parameter generalization of the Cole-Cole and the Cole-Davidson functions with the form . The special form corresponds to the limiting case Havriliak and Havriliak (1994).
- Bertelsen and Lindgård (1974) J. V. Bertelsen and A. Lindgård, Journal of Polymer Science: Polymer Physics Edition 12, 1707 (1974).
- Su et al. (2010) J.-J. Su, M. J. Graf, and A. V. Balatsky, Phys. Rev. Lett. 105, 04530 (2010).
- Note (4) We can introduce an ad hoc frequency dependence by multiplying the effective moment of inertia by a factor . For our measurements an index would provide the appropriate horizontal scaling of the plots of Fig. 4, but not map the Cole-Cole plots onto each other.
- Note (5) This might lead to a sample geometry/orientation dependence of oscillator measurements Allen et al. (1982).
- Anderson (2014) P. W. Anderson, Preprint arXiv:1308.0556 (2014).
- Agnolet (1982) G. Agnolet, in Low Temperature Techniques, edited by R. C. Richardson (Cornell University, 1982).
- (55) Agnolet, [51] recommends using the shear modulus of BeCu for coin silver, namely Pa. However from measurements on oscillators such as the one used here, we have determined the value of the coin silver shear modulus to be Pa .
- Greywall (1977) D. S. Greywall, Phys. Rev. B 16, 5127 (1977).
- Graf et al. (2011) M. J. Graf, J.-J. Su, H. P. Dahal, I. Grigorenko, and Z. Nussinov, J. Low Temp. Phys. 162, 500 (2011).
- S. Navriliak Jr. and Negami (1966) S. Navriliak Jr. and S. Negami, Journal of Polymer Science C14, 99 (1966).
- Havriliak and Havriliak (1994) S. Havriliak and S. J. Havriliak, Journal of Non-Crystalline Solids 172, 297 (1994).
- Allen et al. (1982) A. Allen, M. Richards, and J. Schratter, J. Low Temp. Phys. 47, 289 (1982).