The story of Seyfert galaxy RE J2248-511: from intriguingly ultrasoft to unremarkably average
Abstract
RE J2248-511 is one of only 14 non-blazar AGN detected in the far ultraviolet by the ROSAT Wide Field Camera implying a large ultrasoft X-ray flux. This soft X-ray excess is strongly variable on year timescales, a common property of Narrow Line Seyfert 1s, yet its optical linewidths classify this source as a broad-lined Seyfert 1. We use four nearly simultaneous optical–X-ray SEDs spanning 7 years to study the spectral shape and long term variability of RE J2248-511.
Here we show that the continuum SED for the brightest epoch dataset is consistent with the mean SED of a standard quasar, and matches well to that from an XMM-SDSS sample of AGN with and . All the correlated optical and soft X-ray variability can be due entirely to a major absorption event. The only remarkable aspect of this AGN is that there is no measurable intrinsic X-ray absorption column in the brightest epoch dataset. The observed FUV flux is determined by the combination of this and the fact that the source lies within a local absorption ‘hole’. RE J2248-511, whose variable, ultrasoft X-ray flux once challenged its BLS1 classification, demonstrates that characterisation of such objects requires multi-epoch, multi-wavelength campaigns.
keywords:
galaxies: Seyfert - quasars: individual: RE J2248-5111 Introduction
The ultraviolet (UV) to X-ray spectral shapes seen in active galactic nuclei (AGN) clearly comprise multiple components and have been the subject of decades of study. There is an accretion disc, which peaks in the UV (forming the Big Blue Bump) in the standard optically thick, geometrically thin disc solutions (Shakura & Sunyaev, 1973). This emission forms the seed photons for Compton upscattering in a hot corona, producing a power law above 2 keV. However, an excess of soft ( keV) X-ray emission above this power law emission is seen ubiquitously in all high mass accretion rate AGN. The origin of this soft X-ray excess component is currently unknown but if this represents a true additional continuum (e.g. Laor et al., 1997; Magdziarz et al., 1998; Gierliński & Done, 2004), then it has very similar temperature in all sources (Czerny et al., 2003; Gierliński & Done, 2004; Middleton, Done & Gierliński, 2007). This apparent fine tuning led to alternative models where the soft excess instead arises via reflection/absorption from partially ionised material, so that atomic features set the fixed energy (Crummy et al., 2006; Gierliński & Done, 2004; Middleton, Done & Gierliński, 2007; Walton et al., 2013). However, both these scenarios predict strong atomic features, at odds with the observed smooth soft X-ray excess continuum. These features can be smoothed into a pseudo-continuum by strong velocity shear, but the velocities required appear too extreme to be plausible for an absorbing wind (Schurch & Done, 2007), and even in reflection require the very innermost edge of the disc around a high spin black hole (Crummy et al., 2006; Walton et al., 2013). Reflection also has the problem that the ionisation state must be fine-tuned (Done & Nayakshin, 2007), resurrecting the very issue that the model was designed to avoid.
The narrow-line Seyfert 1 (NLS1) subclass, objects where the FWHM of the broad component of the H line is km s-1 (Osterbrock & Pogge, 1985), show nearly ubiquitous strong, steep soft X-ray emission (Boller, Brandt & Fink, 1996; Grupe et al., 1999). These are most probably low mass black holes accreting at high mass accretion rates with respect to Eddington (, Boroson, 2002), so much of the soft excess may well be due to intrinsic emission from the accretion disc (Done et al. 2012, hereafter D12; Jin et al. 2012a, hereafter J12a). The combination of low mass and high predict that the NLS1 should have the highest intrinsic accretion disc temperature of all AGN, and that this can peak close to (or even in) the soft X-ray bandpass. These objects do still need an additional soft X-ray component ‘filling in’ smoothly between the disc and high energy power law, but this ‘true’ soft X-ray excess is a much smaller fraction of the inferred bolometric luminosity than in standard Broad Line Seyfert 1’s (D12; J12a).
A subset of NLS1 also show dramatic variability, with deep dips in X-ray flux. These dip spectra are extremely complex (Gallo, 2006), but can be fit with extremely smeared relativistic reflection (e.g. Fabian et al., 2009, 2013). However, the NLS1 which do not show such dips tend to have rather simple spectra (see Middleton et al. 2009, Jin et al 2009, J12a, and Jin, Ward & Done 2012c). In these ‘simple’ sources, the fast variability strongly favours the original model of a separate soft X-ray Comptonisation component (Jin et al., 2013). Standard broad line Seyferts also show growing evidence from variability studies for a separate soft X-ray component (e.g. Mehdipour et al., 2011; Noda et al., 2011, 2013; Lohfink et al., 2013). While the fine-tuning of the temperature is still an issue, such a component could arise from shock heating of the disc surface from the impact of a failed wind (Done et al., 2013).
Many AGN samples have been studied through their SEDs, facilitated by large extragalactic surveys undertaken with e.g. XMM-Newton, Chandra and the Sloan Digital Sky Survey (SDSS) and by the availability of simultaneous otical to X-ray datasets from XMM-Newton and Swift which avoid any confusion introduced by variability (e.g. Brocksopp et al., 2006; Vasudevan & Fabian, 2009; Grupe et al., 2010). While this has highlighted the diversity in broadband spectral shapes and their variability, it has also been possible to create mean spectra for particular classes (e.g. Elvis et al. 1994; J12a). A number of SED studies have concluded that Eddington ratio is a main driver for the SED shape (e.g. Vasudevan & Fabian 2007,2009; J12a). If this is true then the physics responsible for the soft X-ray excesses in NLS1 is likely to be closely tied to the Eddington ratio. Hence defining this class of objects on a single line width measure would then be inappropriate, missing higher mass black holes at similarly high (Collin et al., 2006; Sulentic, Marziani & Dultzin-Hacyan, 2000; Dultzin et al., 2011; Peterson, 2011). However, high mass, high AGN are rare in the local Universe, predominantly due to downsizing of activity in the Universe from , so the single line width criterion may not miss many local objects.
RE J2248-511 is a local (), EUV-selected Seyfert galaxy. It is classified as a broad-line Seyfert 1 (BLS1) due to its Balmer broad-line widths of FWHM3600 km s-1. For an estimated black hole mass of 108 M⊙, this source is highly variable in both optical and soft X-rays (Puchnarewicz et al., 1995; Breeveld, Puchnarewicz & Otani, 2001). ROSAT measured a soft X-ray spectral slope of and it was among the tiny fraction of ROSAT All Sky Survey (RASS) AGN also detected, and in this case discovered, by the ROSAT Wide Field Camera in the far ultraviolet (Pounds et al., 1993). Despite its soft X-ray slope, there is no evidence for strong Fe II emission (e.g. Wilkes, Elvis & McHardy, 1987; Boller, Brandt & Fink, 1996). This curious mixture of properties often places RE J2248-511 in the crossover of parameter space between BLS1 and NLS1.
RE J2248-511 is then an object where we can examine the nature of the soft X-ray excess and the relationship between the X-ray and optical/UV continua. To probe the underlying physics of this AGN we have gathered four epochs of quasi-simultaneous optical and X-ray observations using the SAAO 1.9m Radcliffe telescope, the Danish 1.54m telescope at La Silla, XMM-Newton and Swift, spanning 7 years from 2000 October to 2007 September. We also make a comparison to archival data. Section 2 describes the observations and in Section 3 we confirm the broad-line cloud velocities and estimate the black hole mass from our optical spectroscopy. We then determine whether the SEDs can be well represented by the broadband spectral models of D12 in Section 4, and evaluate spectral variability between epochs. We discuss our findings and conclude in Section 5.
| Waveband | Obs. date | Telescope and Instrument | Texp (s) | Reference |
| X-ray | 2007 September 26 | Swift XRT | 1919 | Grupe et al. (2010) |
| 2007 September 15 | Swift XRT | 22569 | Grupe et al. (2010) | |
| 2007 May 15-16 | XMM-Newton EPIC pn | 45058 | Dunn et al. (2010) | |
| 2007 May 15 | XMM-Newton EPIC MOS 1,2 | 57579,58848 | Dunn et al. (2010) | |
| 2006 November 01 | Swift XRT | 5769 | Grupe et al. (2010) | |
| 2006 September 21-22 | Swift XRT | 9759 | Grupe et al. (2010) | |
| 2001 October 31 | XMM-Newton EPIC pn | 9767 | ||
| 2001 October 31 | XMM-Newton EPIC MOS 1,2 | 14301,14304 | ||
| 2000 October 26 | XMM-Newton EPIC pn | 10089 | ||
| 2000 October 26 | XMM-Newton EPIC MOS 1,2 | 13789,13791 | ||
| 1997 May 17 | ASCA GIS2,GIS3 | 19960,19956 | Breeveld et al. (2001) | |
| 1993 April 21 | ROSAT PSPC | 4520 | Pounds et al. (1993); Puchnarewicz et al. (1995) | |
| UV | 2004 July 07 | FUSE | 3299 | Dunn et al. (2010) |
| 2002 September 24 | FUSE | 5534 | Dunn et al. (2010) | |
| 2002 September 24 | FUSE | 31301 | Dunn et al. (2010) | |
| 1992 November 23 | IUE SWP | 10799.8 | Dunn et al. (2006) | |
| optical | 2007 May 16 | SAAO 1.9m (low-res blue,red) | 900 | |
| 2006 August 29 | Danish 1.54m DFOSC B,V,R | 180,2x120,60 | ||
| 2001 October 15 | SAAO 1.9m (blue grating) | 900 | ||
| 2000 October 19-20 | SAAO 1.9m (low-res blue,red) | 500,500 | ||
| 2000 October 19-20 | SAAO 1.9m (high-res blue,red) | 500,500 | ||
| 2000 October 21-22 | SAAO 1.9m (low-res blue,red) | 600,900 | ||
| 2000 October 21-22 | SAAO 1.9m (high-res blue,red) | 600,600 | ||
| 2000 October 23-24 | SAAO 1.9m (low-res blue,red) | 600,900 | ||
| 2000 October 23-24 | SAAO 1.9m (high-res blue,red) | 600,600 |
2 Observations
2.1 X-ray
RE J2248-511 was observed with XMM-Newton (Jansen et al., 2001) on 2000 October 26 (observations 0109070401 and 0109070501), 2000 October 31 (0109070601) and 2007 May 15 (0510380101) as listed in Table LABEL:tab:obs. We do not use observation 0109070501 due to sustained background flaring. All EPIC (Strüder et al., 2001) instruments were in small window mode with the medium filter applied, excepting the MOS cameras during the 2000 observation which were then in small window free running mode. The raw data were processed with the XMM SAS version 20110223_1801-11.0.0.
The source was observed with the X-Ray Telescope (XRT, Burrows et al., 2005) on board Swift (Gehrels et al., 2004) on 2006 September 21–22, 2006 November 1, and on 2007 September 15 and 26 (Table LABEL:tab:obs). We obtained the extracted spectra from the UK Swift Science Data Centre111www.swift.ac.uk/user_objects, combining the two 2007 observations into a single spectrum following the procedures of Evans et al. (2009). Data were processed with the Swift software version 3.9 using CALDB 3.9.
All X-ray spectra were grouped such that a minimum of 20 counts fell in each bin, and we used the energy range 0.3–10 keV for analysis of XMM-Newton and Swift X-ray spectra.
2.2 Optical
A bright star ( Gru with ) is located close (9.1 arcmin) to the AGN, which made observations with the XMM-Newton Optical Monitor and the Swift UV Optical Telescope impossible. Observations were, however, possible with ground-based telescopes, listed in Table LABEL:tab:obs.
RE J2248-511 was observed on 2000 October 19–24, 2001 October 15 and 2007 May 16 using the South African Astronomical Observatory’s 1.9m Radcliffe telescope with the grating-spectrograph and SITe CCD. These observations coincide with the XMM-Newton observations to within 2–6 days in 2000, 2.5 weeks in 2001 and 2 days in 2007. Spectra were taken using both a narrow slit (1.8′′) and a much wider slit, with overlapping blue (#7) and red (#8) gratings ( = 4600, 7800Å) in 2000 and 2007. Only the blue grating was used in 2001. Exposure times ranged from 500 s to 900 s per spectrum. Arc spectra were taken before and after every target and every standard spectrum using a CuAr lamp. The standard star LTT 9239 was observed for flux calibration of RE J2248-511. Spectra were reduced using standard tools within IRAF. In 2000 spectra were obtained on 3 separate nights and under variable weather conditions, during which no appreciable variability is seen. For continuum measurement and SEDs in 2000 October we use the spectra on 21st–22nd which were taken under the best seeing conditions. We use the wide-slit data for SED modelling and the narrow-slit data for spectral line measurements.
We observed RE J2248-511 on 2006 August 29 with the Danish 1.5 m telescope at La Silla, using the DFOSC instrument for optical photometry. These observations lie within 3 weeks of the first Swift pointing. The following filters and exposure times were used: 180 seconds in , seconds in and 60 seconds in . We chose the position of the AGN on the chip of DFOSC and the timing of the observations such that the bright star Gru is off the chip and diffraction spikes are not affecting the AGN. The data were reduced using standard procedures in IRAF, using sky flats and bias frames taken at the end of the night. Photometric calibrations of the and data were performed using magnitudes of field stars from the AAVSO Photometric All-Sky Survey (APASS) survey222http://www.aavso.org/apass data release 6. To calibrate the band we used a transformation of APASS Sloan and magnitudes to following Jordi, Grebel & Ammon (2006). We find the following magnitudes: , and , approximately equivalent to (3.90.3,2.30.1,1.460.08)10-15 erg cm-2 s-1 Å-1 respectively.
3 The black hole mass
The optical spectra show strong emission lines from H,,,, O II,O III, N II and Ne III. For this work we concentrate on the continuum and hydrogen line fits, in order to estimate the black hole mass. Optical spectral fitting was done with both the Starlink DIPSO v3.6 spectral fitting package and IRAF. The continuum under each line was approximated by a first order polynomial in the immediate vicinity of the line blend, Gaussian profiles were assumed for the line profiles and a least squares procedure was used to minimise the residuals of the fit. Both H and H were best fitted with three Gaussians representing narrow, intermediate and broad components (e.g. Figure 1). Towards the blue end of the spectrum the noise increased and the weaker broad lines of H and H required only double and single Gaussian components respectively. The positions of the line centres indicate a redshift of , consistent with the best published measurement of (Dunn et al., 2008).
| Amplitude | FWHM | FWHM | |
|---|---|---|---|
| Å | erg cm-2 s-1 Å-1 | Å | km s-1 |
| 5356.20.2 | (2.320.23)10-15 | 6.40.7 | 35840 |
| 5350.81.7 | (8.031.8)10-16 | 13.73.1 | 768174 |
| 5355.30.5 | (2.590.06)10-15 | 64.60.9 | 361951 |
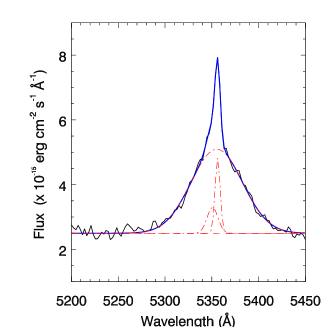
We use the H broad-line width (Table LABEL:tab:hbeta and Figure 1) together with either the luminosity from narrow-slit spectroscopy in 2000 October, or the continuum flux at 5100Å (restframe) of 1.3610-15 erg cm-2 s-1 Å-1 measured in the 2000 October 21/22 wide-slit data, to estimate the black hole mass. To convert flux to luminosity we used and H km s-1 Mpc-1. We follow the methods of (Vestergaard & Peterson, 2006, their Section 3.4) for black hole mass estimation, with both equations resulting in estimates of .
4 Spectral modelling
We combined the optical information with the X-ray data for our four quasi-simultaneous epochs. We removed the emission lines from the optical spectra and fitted the continua with a double power law which we use in the broadband fits (e.g. Vanden Berk et al., 2001). All modelling is performed in the X-ray spectral fitting package Xspec (Arnaud, 1996). We use abundances from Wilms, Allen & McCray (2000) and the cross-sections of Verner et al. (1996). We fixed Galactic () X-ray absorption to 9.431019 cm-2 (LAB H I Survey, Kalberla et al. 2005), and set reddening to /1022 (Bessell, 1991) as employed in J12a (and references therein). We note that does not change significantly with respect to the LAB value when using the new method of Willingale et al. (2013), but is lower than the value of 1.41020 cm-2 used in the earlier X-ray studies Puchnarewicz et al. (1995) and Breeveld, Puchnarewicz & Otani (2001).
For the epochs 2000 and 2001, we fitted the X-ray data with a simple absorbed power law plus blackbody model with all parameters excepting redshift and Galactic absorption free. This provided a good fit to the overall shape of the spectra, so a constant factor was included for the MOS spectra to determine the offsets between the XMM-Newton EPIC pn and MOS. These could then be fixed in more complex physical modelelling, to 1.09 (MOS1), 1.11 (MOS2) in 2000 and 1.06 (MOS1), 1.05 (MOS2) in 2001. The same procedure was carried out for the 2007 X-ray data, but a further two blackbodies were introduced in order to adequately reproduce the spectral shape: the Swift XRT spectrum did not require an offset, MOS1 was set to 1.02 and MOS2 to 1.01 with respect to pn. We did not allow offsets of the optical data with respect to the X-ray data. Clearly, a combination of multiple power laws and blackbodies is sufficient to describe the spectral shape at all epochs, but this is not a physically motivated model. We therefore go on to model each epoch in turn with more viable models for the emission mechanisms in AGN, which are necessarily more complex. All plots are shown in the observer frame.
4.1 Epoch 2001
We began by modelling the SED taken in 2001, when the source flux was at its highest. The data at this epoch comprise XMM-Newton EPIC pn and MOS, and optical spectroscopy in the blue grating of the 1.9m Radcliffe telescope.
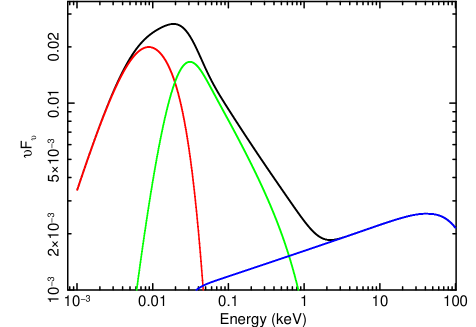
We adopted the physical model optxagnf of D12. This comprises a colour temperature corrected accretion disc spectrum with Comptonisation of both low temperature optically thick disc material and high temperature optically thin material in a corona. Black hole mass was fixed at 108.1 M⊙ from the H broad-line measurement (Section 3), and distance fixed at , again as measured from the optical spectra. We also fixed the black hole spin to zero and outer disc radius to 105 Rg. In addition to the fixed Galactic column, we allowed for an intrinsic absorber (tbabs, Wilms, Allen & McCray 2000) and correlated reddening /1022 (Bessell, 1991).
Fitting this model to the data using minimisation we found the best-fitting power law slope to be . The resulting black hole accretion rate was (resulting in / = 1172/1058). The parameters resulting from this fit are very similar to those of one of the mean AGN spectra presented in J12a, Jin, Ward & Done 2012b and D12 in which and . Our measured is consistent with that measured by Grupe et al. (2010) from Swift data alone and using different models. Remarkably, no intrinsic absorption was required at all.
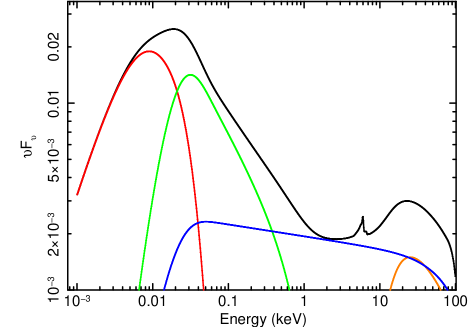
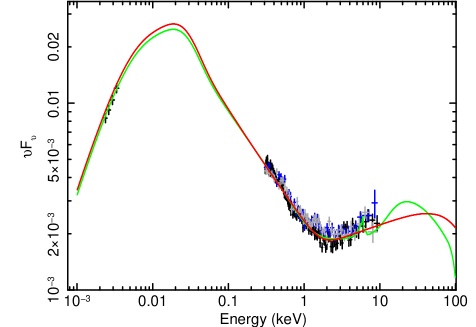
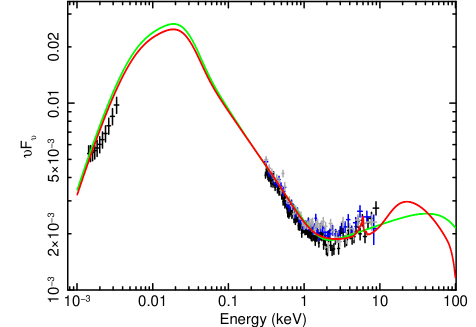
At energies above 2 keV, where our data are less constraining, this model assumes a pure power law. Many AGN are, however, well fitted with reflection off the disc above 2 keV, so we went on to include a reflection component with the pexmon Xspec routine (Magdziarz & Zdziarski, 1995). We assumed fixed solid angle , inclination angle 30∘ and tied to the photon index of the disc+Comptonisation model, using rdblur (based on Fabian et al. 1989) with Rg to smear the Fe K line since no narrow emission lines are apparent at this epoch. The total disc+Comptonisation+reflection model is a good representation of the broadband data (/ = 1156/1058), again with no measurable intrinsic neutral absorption. The power law photon index steepens a little from to 2.07 when reflection is included, while the soft X-ray components and inferred accretion rate remain approximately the same (). The Comptonisation component responsible for the soft X-ray excess here is optically thick. Both models and their contributing components are shown in Figure 2, and the data are shown with these models in Figure 3. The best fits for both models are listed in Table LABEL:tab:sedparams. These can be compared with Table 3 of D12, and appear to be similar to their mean AGN model M2.
We note that, while we have no reason for allowing an offset between the optical and X-ray, if we do that no dramatic changes in the remaining free parameters are required and we obtain a comparable fit statistic. The optical constant factor goes to 0.8.
| Model | parameter | unit | optxagnf | optxagnf+(rdblur*pexmon) |
|---|---|---|---|---|
| 1020 cm-2 | 0 | 0 | ||
| =1.7x mag | 0 | 0 | ||
| Index | - | 3 fixed | ||
| Rg | - | 15 fixed | ||
| Rg | - | 400 fixed | ||
| Incl | deg | - | 30 fixed | |
| - | 2.07∗ | |||
| keV | - | 1000 fixed | ||
| rel_refl | - | -1 fixed (R=1) | ||
| abund | - | 1 fixed | ||
| Fe_abund | - | 1 fixed | ||
| Incl | deg | - | 30 fixed | |
| norm | - | 0.002 fixed | ||
| log() | -0.57 | -0.61 | ||
| astar | 0 fixed | 0 fixed | ||
| Rg | 34 | 33 | ||
| log(Rout) | Rg | 5.0 fixed | 5.0 fixed | |
| keV | 0.28 | 0.21 | ||
| 13 | 15 | |||
| 1.87 | 2.07∗ | |||
| 0.30 | 0.36 | |||
| norm | 1.0 fixed | 1.0 fixed | ||
| / | 1172/1058 | 1156/1058 |
The distinction between these models lies primarily above a few tens of keV. The 15–50 keV Swift BAT data do not show any detection, even in the averaged flux considered for the BAT Survey (Baumgartner et al., 2013). The upper limit on its 70-month averaged flux is approximately 1 mCrab, which does not allow discrimination between these models.
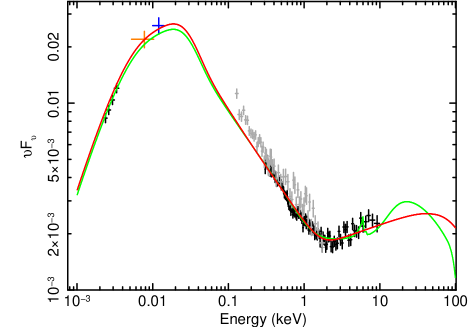
To extend the energy coverage towards the peak of the SED we overplotted the archival ROSAT PSPC spectrum (Breeveld, Puchnarewicz & Otani, 2001; Puchnarewicz et al., 1995), and de-absorbed this according to the 2001 spectrum with extrapolation using our optxagnf model (Figure 4). The soft X-ray spectrum in the PSPC data shows that the source had a strong soft excess in 1993 which is consistent with the 2001 data (it appears a little softer, which has been noted previously for PSPC spectra - see Section 2.3.1 of Breeveld, Puchnarewicz & Otani 2001 for further details). We also estimated the approximate UV continuum flux in the IUE SWP (taken in 1992, Dunn et al., 2006) and combined FUSE (taken 2002–2004, Dunn et al., 2010) observations using published spectra, and de-absorbed these using the LAB Survey Galactic value. Both are consistent with a UV spectrum rising to shorter wavelengths (within the 10 per cent errors we have assumed in Figure 4), but we caution that source flux estimation in the UV is heavily absorption-model dependent.
We note that Puchnarewicz et al. (1995) performed SED fitting of the 1993 PSPC spectrum with the ROSAT WFC point and an optical spectrum taken 2 years previously with the SAAO 1.9m Radcliffe telescope, and also found an optical continuum rising to the blue and forming a big blue bump with the soft X-ray data.
Our model gives a monochromatic, unabsorbed luminosity at 200 eV of , somewhat lower than the WFC luminosity of (Edelson et al., 1999). Some of this discrepancy is due to the larger Galactic absorption column used ( compared to our cm-2, Edelson et al., 1999). However, this only increases our to , so there may be some intrinsic variability such that the source was brighter during the WFC survey than in our dataset.
4.2 Epoch 2000
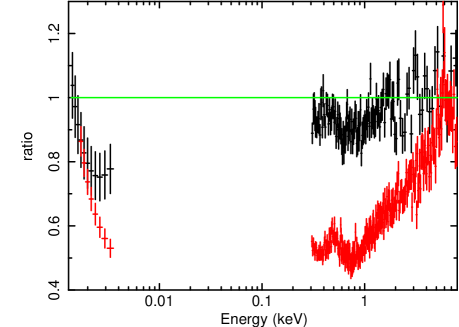
The model parameters which describe the epoch 2001 SED are also a reasonable representation of the epoch 2000 SED (comprising EPIC pn, MOS1+2 and optical spectra), as shown in Figure 5. We do, however, have a small flux deficit in optical and soft X-rays (Figure 6), and this can be accounted for most simply by additional intrinsic X-ray absorption (using tbabs) of cm-2, and additional intrinsic optical reddening of mag. The resulting fit statistic for the optxagnf model is / = 1307/1071, and we note that to achieve this fit we untied the optical extinction and it converged at a value much greater than . The key point here is that it is possible to keep the same continuum as seen in 2001, and change only the absorption to describe the 2000 SED. We also tried fixing all parameters but the power law photon index and we obtain a good fit to the X-ray data with a flatter , while the optical data are still overpredicted by the model and additional reddening must be included.

4.3 Epoch 2007
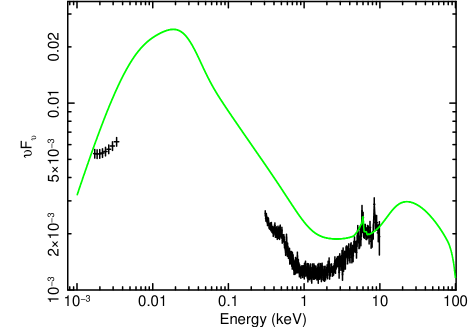
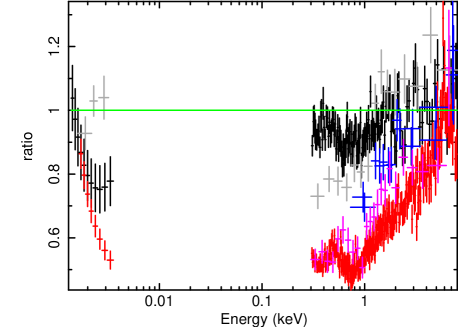
A simple overlay of the models adopted for the 2001 epoch is a poor description of the SED in 2007 (comprising EPIC pn, MOS1+2, Swift XRT and optical data), as can be seen in Figure 7. An event must have occurred that suppressed both the bluemost optical and soft X-ray flux, yet left the hard ( 5 keV) X-ray and redmost optical flux unaltered. The sharp features seen in residuals are strongly suggestive of absorption (Figures 6 and 7).
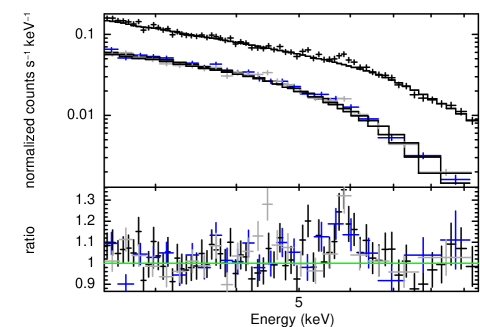
The 2007 XMM-Newton observation was the longest X-ray observation of RE J2248-511 with exposure of almost 60 ks. In these data an Fe line is detected, and fitting a Gaussian we measure an observed line centre of 5.820.04 keV (i.e. rest frame 6.4 keV) and line width keV as shown in Figure 8. This leads us to prefer a model for the continuum which includes reflection.
Maintaining the same underlying disc+Comptonisation+reflection continuum, and fitting for additional intrinsic neutral absorption (tbabs) and reddening (E(B-V)) did not result in an acceptable fit and the SED shape was not well fitted (/ = 147538/2049). We then added a partial covering neutral absorber, pcfabs, and left E(B-V) and tbabs at the source free to vary independently, and obtained a much improved fit. The resulting partial covering column density required was cm-2 with covering fraction, , 0.4, and the neutral, fully covering absorbing column remained small (see Table LABEL:tab:abs). This was the simplest absorption model that could explain the large drop in optical to soft X-ray flux between 2001 and 2007, although it is likely that any absorption is far more complex in nature. Replacing the fully covering neutral absorber with an ionised absorber we found that the depth of the Fe Unresolved Transition Array (e.g. Sako et al., 2001) was greatly overpredicted.
We examined data from the high resolution XMM-Newton Reflection Grating Spectrometer to shed further light on the details of the X-ray absorber. Unfortunately, there was insufficient signal to measure any spectral features.
| Model | parameter | unit | value |
|---|---|---|---|
| 1020 cm-2 | 1.0 | ||
| =1.7x mag | 0.11 | ||
| 1022 cm-2 | 5.8 | ||
| 0.4 | |||
| / | 3038/2049 |
4.4 Epoch 2006
We fitted the September-November 2006 SED last because neither XMM-Newton data nor optical spectroscopy were available. The Swift XRT X-ray spectrum is similar in shape to that of 2007 with some small increase in flux (Figure 9). We can therefore confirm that the strong X-ray absorption seen in 2007 was also present in 2006, to a lesser extent. The X-ray data are not of sufficient signal-to-noise to discriminate between differing models, however, nor to extract details of either the continuum or the absorption model.
The optical photometry, reported in Section 2, includes a contribution from the emission lines. We estimated and removed the line contributions using previous optical spectra. The resulting and band fluxes are higher than measured in 2007 via spectroscopy, while the band flux is approximately the same. When plotted with the X-ray data in space the optical continuum shows little deviation from the 2001 model in contrast to the X-ray spectrum at this epoch (Figure 9), but we caution that the errors may be underestimated if there are significant systematic uncertainties.
Finally, we overplotted the archival ASCA GIS spectra (Breeveld, Puchnarewicz & Otani, 2001) taken in 1997, and find that these lie between the 2001 and 2007 spectra examined here (Figure 9).
4.5 Long term variability: summary of all epochs
These data allow the long-term spectral shape to be assessed at 6 epochs between 1992 and 2007. In 1993, the ROSAT spectrum agrees well with our model for the 2000 and 2001 data, as do the 1992 IUE and 2002–2004 average FUSE continua (with the caveat of strong absorption model dependency), suggesting the source was not significantly absorbed at these epochs. The ASCA spectra, taken in 1997, cover the portion of the spectrum dominated by Compton upscattering and reflection in our model. The fit residuals show a decline towards softer energies when compared with the 2001 model. In particular the lowest GIS energy bins covering 0.7–1.0 keV show 0.65–0.8 times the flux seen in 2001, but this is not conclusive and without coverage of soft X-ray or optical/UV regimes we cannot infer the presence or absence of absorption. In 2006 the XRT spectrum lies below the 2001 data, and we can infer that absorption is present when assuming the 2001 best-fitting model. In 2007 the XRT, EPIC and optical spectra show a large deficit in flux below 5 keV which we interpret as absorption.
5 Discussion
The optical to X-ray SED of RE J2248-511 can be well represented by a colour temperature corrected accretion disc spectrum with Comptonisation of both low temperature optically thick disc material and high temperature optically thin material in a corona, plus a reflection component which is evident above 5 keV. In 2000–2001 little or no intrinsic absorption is required. The detection of this object in the FUV by the ROSAT WFC similarly requires that there was little or no intrinsic absorption at this epoch (1990) also.
However, the spectrum dramatically altered over the space of 5 years in the soft X-ray and optical/UV, displaying a reduction in flux in both optical and X-ray, strongly suggestive of absorption. Indeed, additional fully and partially covering neutral absorbers plus additional reddening are able to explain the difference in SED shape seen in 2006–2007 whilst preserving the underlying continuum as seen in 2000–2001.
We know from detailed spectroscopic UV observations with IUE, FUSE and HST COS that complex absorbers exist in this system (Dunn et al., 2006, 2008, 2010; Borguet et al., 2012). These appear to lie at extremely large distances, (9-15 kpc from the AGN) i.e. out into the halo of the host galaxy, so they possibly represent a galactic wind. Thus their density is extremely low, so they cannot vary in response to the changing illumnation from the AGN, and indeed these are observed to remain constant.
The X-ray absorption we find here went unnoticed in the aforementioned work by Dunn et al. (2010). These authors looked only at the 2007 XMM-Newton spectrum, and were therefore unable to detect variability in the spectral shape and model any constant, underlying continuum. They concluded the X-ray spectrum was not absorbed, and compared this with the FUSE UV spectra taken in 2002 and 2004 which show evidence for significant absorption. From this they suggested that the source does not follow the 1:1 correspondence between UV and X-ray absorption claimed for low redshift AGN (Crenshaw et al., 1999; Kriss, 2006). Our findings show, however, that RE J2248-511 is strongly absorbed in the optical/UV to X-rays at some epochs and indeed these appear to be partially correlated.
A plausible scenario is that an absorbing cloud (system) crossed into our line-of-sight to the central AGN between 2005 and 2007, dramatically altering the optical to X-ray SED. The neutral X-ray absorber required an increase in column density of 1020 cm-2, plus 0.3 magnitudes of optical extinction (), while an additional 40% partially covering X-ray absorber was invoked, with a large column of 51022 cm-2 if neutral. This could be the onset of a new outflow, or a discrete episode of mass ejection. It is possible that a similar event occurred around 1997 as viewed by ASCA (Breeveld, Puchnarewicz & Otani, 2001), or at least occurred some time in between the epochs of 1993 and 2000 when strong soft excesses are clearly present; this is possibly also the case in 1992 when a flat optical continuum was noted (Mason et al., 1995) in contrast both to the bluer spectrum observed in 1991 (Grupe et al., 1998, 1999) and large soft X-ray excess seen with ROSAT in 1993 (Puchnarewicz et al., 1995, see also Breeveld et al. 2001).
To put RE J2248-511 in the wider context, we compare it to sources among the similarly analysed sample presented in J12a,b,c. J12a took an X-ray/optically selected sample of unobscured XMM-SDSS Type I AGN, and modelled the SEDs with optxagnf as we have done here. Their sample contained 51 AGN, among which 20% were NLS1. They concluded that these AGN could be carved up into 3 SED types and they reported the main parameters for each. The 2001 SED for RE J2248-511 is entirely consistent with their mean SED which has , , , , , and . The Eddington fraction is perhaps the most likely parameter to be driving the spectral shape, and while NLS1s are around Eddington in most samples, we find a value of , confirming RE J2248-511 as a typical BLS1s (e.g. Vasudevan & Fabian, 2009; Grupe et al., 2010, J12a).
RE J2248-511 lies in a direction of low Galactic absorption. Combined with the total lack of measurable intrinsic absorption and reddening, this means we are seeing the AGN through a ‘hole’ in the Galactic and host galaxy column density. The continuum flux, which peaks at EUV energies, arrives uninhibited and as a consequence RE J2248-511 appears in EUV-selected samples. Given the very typical BLS1 continuum model parameters we obtain when fitting the non-absorbed epoch SEDs, this explanation is very attractive. This suggestion was originally made by Puchnarewicz et al. (1995), but with the potential for such dramatic changes caused by absorption alone, it is only with multi-epoch, multi-wavelength data that we can now confirm this. The ROSAT WFC Extragalactic Survey AGN sample (Edelson et al., 1999) in which RE J2248-511 was catalogued, contains 4–5 AGN among the sample of 19 (including BL Lacs) with Galactic columns cm-2. The low intrinsic column and ROSAT WFC, IUE and FUSE detections show that there can be a high escape fraction for EUV and FUV photons from such AGN, which can be important for the AGN contribution to re-ionisation of the Universe, both in terms of hydrogen and helium.
In summary, RE J2248-511 is a high black hole mass, broad-lined AGN in the local Universe, with an Eddington ratio similar to broad-lined quasars. Our modelling demonstrates that this spectral shape can be accommodated with a colour temperature corrected accretion disc spectrum with Comptonisation of both low temperature optically thick disc material and high temperature optically thin material in a corona, plus a reflection component. On timescales of a few years the soft excess shows dramatic variability, which can be readily explained by the onset of absorption from both fully and partially covering material. We conclude that rather than an unusual, ultrasoft AGN which defies classification, RE J2248-511 is in fact a typical broad-lined Seyfert 1 that is fortuitously viewed through a ‘hole’ in the line-of-sight column density.
6 Acknowledgments
RLCS acknowledges financial support from a Royal Society Dorothy Hodgkin Fellowship. We thank Jens Hjorth and Johan Fynbo for generously giving us observing time at the Danish Telescope, and Francois van Wyk for assistance during our first observing run at SAAO. We thank Hans Krimm and Wayne Baumgartner for assistance with the Swift BAT data, and Steve Sembay and Roberto Soria for useful discussions. KW acknowledges support from STFC. KLP acknowledges support from UKSA. This work is based on observations obtained with XMM-Newton, an ESA science mission with instruments and contributions directly funded by ESA Member States and the USA (NASA). This work made use of data supplied by the UK Swift Science Data Centre at the University of Leicester, and data provided by the High Energy Astrophysics Science Archive Research Center (HEASARC), which is a service of the Astrophysics Science Division at NASA/GSFC and the High Energy Astrophysics Division of the Smithsonian Astrophysical Observatory. This paper uses observations made at the South African Astronomical Observatory (SAAO). We acknowledge use of the AAVSO Photometric All-Sky Survey (APASS), funded by the Robert Martin Ayers Sciences Fund. IRAF (Image Reduction and Analysis Facility) is distributed by the National Optical Astronomy Observatories, which are operated by AURA, Inc., under cooperative agreement with the National Science Foundation.
We dedicate this work to the memory of Liz Puchnarewicz, who brought this source to the fore and inspired its further study.
References
- Arnaud (1996) Arnaud K. A., 1996, ASPC, 101, 17
- Baumgartner et al. (2013) Baumgartner W. H., Tueller J., Markwardt C. B., Skinner G. K., Barthelmy S., Mushotzky R. F., Evans P., Gehrels, N., 2013, ApJS, 207, 19
- Bessell (1991) Bessell M. S., 1991, A&A, 242, L17
- Boller, Brandt & Fink (1996) Boller T. H., Brandt W. N., Fink H., 1996, A&A, 305, 53
- Borguet et al. (2012) Borguet B. C. J., Edmonds D., Arav N., Dunn J. P., Kriss G., 2012, ApJ, 751, 107
- Boroson (2002) Boroson T. A., 2002, ApJ, 565, 78
- Breeveld, Puchnarewicz & Otani (2001) Breeveld A. A., Puchnarewicz E. M., Otani C., 2001, MNRAS, 325, 772
- Brocksopp et al. (2006) Brocksopp C., Starling R. L. C., Schady P., Mason K. O., Romero-Colmenero E., Puchnarewicz E. M., 2006, MNRAS, 366, 953
- Burrows et al. (2005) Burrows D. et al, 2005, SSRv, 120, 165
- Collin et al. (2006) Collin S. et al., 2006, A&A, 456, 75
- Crenshaw et al. (1999) Crenshaw D. M., Kraemer S. B., Boggess A., Maran S. P., Mushotzky R. F., Wu C.-C., 1999, ApJ, 516, 750
- Crummy et al. (2006) Crummy J., Fabian A. C., Gallo L., Ross R. R., 2006, MNRAS, 365, 1067
- Czerny et al. (2003) Czerny B., Nikołajuk M., Różańska A., Dumont A.-M., Loska Z., Zycki P. T., 2003, A&A, 412, 317
- Done & Nayakshin (2007) Done C., Nayakshin S., 2007, MNRAS, 377, L59
- Done et al. (2012) Done C., Davis S. W., Jin C., Blaes O., Ward M., 2012, MNRAS, 420, 1848
- Done et al. (2013) Done C., Jin C., Middleton M. J., Ward M., 2013, MNRAS, 434, 1955
- Dultzin et al. (2011) Dultzin D., Martínez M. L., Marziani P., Sulentic J. W., Negrete A., 2011, Proc. of ‘Narrow-Line Seyfert 1 Galaxies and their place in the Universe’. April 4-6, 2011. Milano, Italy, April 4-6, 2011. Ed. L. Foschini, PoS NLS1, 12
- Dunn et al. (2006) Dunn J. P., Jackson B., Deo R. P., Farrington C., Das V., Crenshaw D. M., 2006, PASP, 118, 572
- Dunn et al. (2008) Dunn J. P., Crenshaw D. M., Kraemer S. B., Trippe M. L., 2008, AJ, 136, 1201
- Dunn et al. (2010) Dunn J. P., Crenshaw D. M., Kraemer S. B., Trippe M. L., 2010, ApJ, 713, 900
- Edelson et al. (1999) Edelson R., Vaughan S., Warwick R., Puchnarewicz E., George I., 1999, MNRAS, 307, 91
- Elvis et al. (1994) Elvis M. et al., 1994, ApJS, 95, 1
- Evans et al. (2009) Evans P. A. et al. 2009, MNRAS, 397, 1177
- Fabian et al. (1989) Fabian A. C., Rees M. J., Stella L., White N. E., 1989, MNRAS, 238, 729
- Fabian et al. (2009) Fabian A. C. et al., 2009, Nature, 459, 540
- Fabian et al. (2013) Fabian A. C. et al., 2013, MNRAS, 429, 2917
- Gallo (2006) Gallo L. C., 2006, MNRAS, 368, 479
- Gehrels et al. (2004) Gehrels N. et al., 2004, ApJ, 611, 1005
- Gierliński & Done (2004) Gierliński M., Done C., 2004, MNRAS, 349, L7
- Grupe et al. (1998) Grupe D., Beuermann K., Thomas H.-C., Mannheim K., Fink H. H., 1998, A&A, 330, 25
- Grupe et al. (1999) Grupe D., Beuermann K., Mannheim K., Thomas H.-C., 1999, A&A, 350, 805
- Grupe et al. (2010) Grupe D., Komossa S., Leighly K. M., Page K. L., 2010, ApJS, 187, 64
- Grupe et al. (2012) Grupe D. et al., 2012, ApJS, 199, 28
- Jansen et al. (2001) Jansen F. et al., 2001, A&A, 365, L1
- Jin et al. (2009) Jin C., Done C., Ward M., Gierliński M., Mullaney J., 2009, MNRAS, 398, L16
- Jin et al. (2012a) Jin C., Ward M., Done C., Gelbord J., 2012a, MNRAS, 420, 1825
- Jin, Ward & Done (2012b) Jin C., Ward M., Done C., 2012b, MNRAS, 422, 3268
- Jin, Ward & Done (2012c) Jin C., Ward M., Done C., 2012c, MNRAS, 425, 907
- Jin et al. (2013) Jin C., Done C., Middleton M., Ward M., 2013, MNRAS in press, arXiv:1309.5875
- Jordi, Grebel & Ammon (2006) Jordi K., Grebel E. K., Ammon K., 2006, A&A, 460, 339
- Kalberla et al. (2005) Kalberla P. M. W., Burton W. B., Hartmann Dap, Arnal E. M., Bajaja E., Morras R., Pöppel W. G. L., 2005, A&A, 440, 775
- Kriss (2006) Kriss G. A., 2006, Astrophysics in the Far Ultraviolet: Five Years of Discovery with FUSE, 348, 499
- Laor et al. (1997) Laor A. et al., 1997, ApJ, 477, 93
- Lohfink et al. (2013) Lohfink A. M., Reynolds C. S., Mushotzky R. F., Nowak M. A., 2013, Mem. S.A.It. Vol. 84, 1
- Longinotti et al. (2013) Longinotti A. L. et al., 2013, ApJ, 766, 104
- Magdziarz & Zdziarski (1995) Magdziarz P., Zdziarski A., 1995, MNRAS, 273, 837
- Magdziarz et al. (1998) Magdziarz P., Blaes O. M., Zdziarski A. A., Johnson W. N., Smith D. A., 1998, MNRAS, 301, 179
- Mason et al. (1995) Mason K. O. et al., 1995, MNRAS, 274, 1194
- Mehdipour et al. (2011) Mehdipour M. et al., 2011, A&A, 534, 39
- Middleton, Done & Gierliński (2007) Middleton M., Done C., Gierlińksi M., 2007, MNRAS, 381, 1426
- Middleton et al. (2009) Middleton M., Done C., Ward M., Gierlińksi M., Schurch N., 2009, MNRAS, 394, 250
- Noda et al. (2011) Noda H., Makishima K., Yamada S., Torii S., Sakurai S., Nakazawa K., 2011, PASJ, 63, S925
- Noda et al. (2013) Noda H., Makishima K., Nakazawa K., Uchiyama H., Yamada S., Sakurai S., 2013, PASJ, 65, 4
- Osterbrock & Pogge (1985) Osterbrock D. E., Pogge R. W., 1985, ApJ, 297, 166
- Peterson (2011) Peterson B. M., 2011, “Narrow-Line Seyfert 1 Galaxies and their place in the Universe”, April 4-6, 2011, Milano, Italy. Eds. L. Foschini, M. Colpi, L. Gallo, D. Grupe, S. Komossa, K. Leighly and S. Mathur, PoS (NLS1), 32
- Pounds et al. (1993) Pounds K. A. et al., 1993, MNRAS, 260, 77
- Puchnarewicz et al. (1995) Puchnarewicz E. M., Branduardi-Raymont G., Mason K. O., Sekiguchi K., 1995, MNRAS, 276, 1281
- Sako et al. (2001) Sako M. et al., 2001, A&A, 365, L168
- Schurch & Done (2007) Schurch N. J., Done C., 2007, MNRAS, 381, 1413
- Shakura & Sunyaev (1973) Shakura N. I., Sunyaev R. A., 1973, A&A, 24, 337
- Strüder et al. (2001) Strüder L. et al., 2001, A&A, 365, L18
- Sulentic, Marziani & Dultzin-Hacyan (2000) Sulentic J. W., Marziani P., Dultzin-Hacyan D., 2000, ARA&A, 38, 521
- Turner et al. (1993) Turner T. J. et al., 1993, ApJ, 407, 556
- Vanden Berk et al. (2001) Vanden Berk D. E. et al., 2001, AJ, 122, 549
- Vasudevan & Fabian (2007) Vasudevan R. V., Fabian A. C., 2007, MNRAS, 381, 1235
- Vasudevan & Fabian (2009) Vasudevan R. V., Fabian A. C., 2009, MNRAS, 392, 1124
- Verner et al. (1996) Verner D. A., Ferland G. J., Korista K. T., Yakovlev D.G., 1996, ApJ, 465, 487
- Vestergaard & Peterson (2006) Vestergaard M., Peterson B.M., 2006, ApJ, 641, 689
- Walton et al. (2013) Walton D. J., Nardini E., Fabian A. C., Gallo L. C., Reis R. C., 2013, MNRAS, 428, 2901
- Wilkes, Elvis & McHardy (1987) Wilkes B. J., Elvis M., McHardy I., 1987, ApJ, 321, L23
- Willingale et al. (2013) Willingale R., Starling R. L. C., Beardmore A. P., Tanvir N. R., O’Brien P. T., 2013, MNRAS, 431, 394
- Wilms, Allen & McCray (2000) Wilms J., Allen A., McCray R., 2000, ApJ, 542, 914