1–4
Interpretation of the oscillation spectrum of HD 50230 — a failure of richness
Abstract
Attempts to interpret the observed oscillation spectrum of the SPB star HD 50230 are reported. We argue that a nearly equidistant period spacing found in the oscillation spectrum of the star is most likely accidental. The observed period distribution requires excitation of modes with the degree . Much more may be learned from the rich oscillation spectrum of the star but most of the work is still ahead of us.
keywords:
stars: oscillations, stars: rotation, stars: individual: HD 502301 Introduction
HD 50230 is a star of the B3 V spectral type and a visual brightness of 8.95 mag. The star had been regarded as constant until its first satellite observations were conducted. [Degroote et al. (2010), Degroote et al. (2010, 2012)] detected more than 500 significant peaks in the CoRoT data. With their spectroscopic observations they discovered that HD 50230 is a double-lined spectroscopic binary with projected equatorial velocity of 7 and 117 km s-1 for the primary and secondary, respectively. For the primary component, they determined effective temperature of K and surface gravity of dex. For the secondary component they found only an upper limit K and assumed dex.
2 Peaks almost uniformly spaced in period
In the rich oscillation spectrum of HD 50230 [Degroote et al. (2010)] extracted eight peaks almost uniformly spaced in period. Invoking the asymptotic theory, they interpreted these peaks as a sequence of modes with the same spherical harmonic degree, , azimuthal order, , and consecutive radial orders, . Assuming and they found that main-sequence star models with a mass of 7–8 can reproduce the observed period spacing.
To test Degroote’s interpretation we re-analysed the CoRoT data. Using the Lomb-Scargle periodogram we found 515 significant frequency peaks comparing to 556 frequencies found by Degroote at al. (2012). Most our frequencies are consistent with the Degroote’s determinations. Surprisingly, we found in our set many sequences of peaks nearly uniformly spaced in periods. Unfortunately, these sequences do not yield sufficient clues to mode identification and are likely accidental.
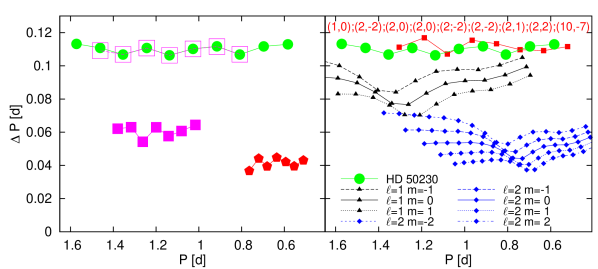
In the left panel of Fig. 1, we present examples of three sequences (filled symbols). For comparison, as open squares, a sequence found by [Degroote et al. (2012)] is also shown. We chose these sequences because if we assume that frequencies with the period spacing of d are dipole modes then, according to the asymptotic theory, those with 0.06 and 0.04 d correspond to modes with and 3, respectively. Unfortunately, they have some common frequencies. Thus, at best, there must be some missing modes.
For further analysis, we selected nine frequencies from the sequence with d. Two frequencies with the shortest periods were omitted because they have too low radial orders and may not follow the asymptotic theory. Next, we tried to reproduce these nine frequencies adopting two approaches. Neglecting the effects of rotation, we reached the best fits for models with the following parameters: , , , and , , , . Here, is the metal abundance by mass fraction and is the overshooting parameter from the convective core expressed in the terms of pressure scale height, . However, the corresponding do not allow us to accept these solutions. A better fit was obtained when we took into account rotational splitting. Then, interpreting the sequence as retrograde dipole modes for a model with , , , , and km s-1 we got . These large values of result from very small frequency errors.
3 Theoretical modes nearly equally spaced in period
Since oscillation spectra of high- and moderate-order g modes are dense, we may expect that modes with different values of spherical harmonic degree , and azimuthal order , can accidentally form period sequences nearly equally spaced in period. To demonstrate such cases, we calculated pulsation modes with for models with and different rotational velocities. Then, in the same way as we did for the observations, we searched for modes equally spaced in period, considering only unstable modes. We found many sequences with different mean period spacings composed of modes with different pairs (). An example is shown in the right panel of Fig. 1 as squares. The nearly constant period spacing is accidental and in no way is related to the asymptotic property of g modes. The calculated sequences at fixed and , depicted in the same figure, show lower mean spacing and much larger deviation from constancy. These results support the conclusion that, in dense oscillation spectra, appearance of equally spaced sequences may be accidental and they should be treated with caution.
4 Comparing histograms of observed and calculated frequencies
When we realized that the observed period spacing cannot be interpreted according to the asymptotic theory we lost the clue to mode identification which is prerequisite for deriving seismic constraints on stellar parameters. Since the prospects for progress looked to us rather grim, we decided to look for a different application of the rich frequency data on HD 50230.
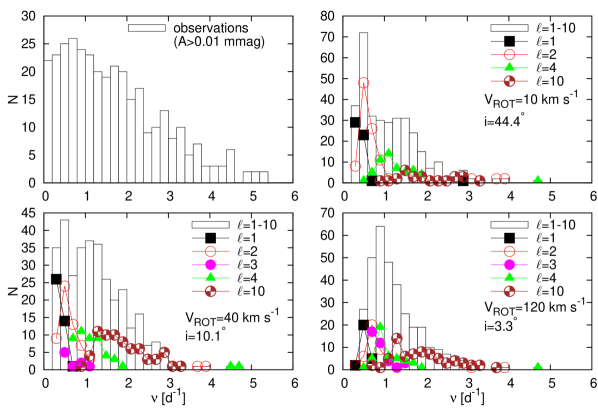
One unsolved problem in the stellar pulsation theory is the amplitude limitation in stars with a large number of unstable modes. The observed distribution of peaks over period ranges may yield an important hint leading us to the solution of this difficult problem. To this aim the observed distribution must be confronted with simulations based on linear nonadiabatic calculations for models constrained by measured values of , and . The linear calculations do not yield mode amplitudes and this information we want to extract from data. We should search for the best fit to the observed distribution assuming various mode-selection principles. The set of considered modes, which all must be unstable, may be terminated at some sufficiently high if the observational threshold cannot be reached.
In the histograms shown in Fig. 2, we assume the random distribution of the r.m.s. amplitude of relative variations of the stellar radius, the intrinsic amplitude of a mode, and considered modes with the photometric amplitudes mmag. We included modes with degrees up to , because our simulations showed that for higher , the amplitudes in the CoRoT band do not exceed the value of mmag. We use the same model reproducing the central values of and (see Sect. 1) for the primary but with three distinct rotation rates: km s-1. The values of the inclination angle result from km s-1 which was kept constant. These rotation rates are higher than those estimated by [Degroote et al. (2010), Degroote et al. (2010, 2012)] based on analysis of high-order p modes. However, their estimate is uncertain and refers to the different part of the interior. The effects of rotation were included in the framework of the traditional approximation, e.g., [Lee & Saio (1997)], [Townsend (2003), Townsend (2005), Townsend (2003, 2005)]. For comparison, the observed histogram was shown in the left upper panel of Fig. 2.
As one can see, we were unable to reproduce the observed distribution of frequencies. Independently of rotation, we have a shortage of unstable and “visible” ( mmag) theoretical modes with the shortest as well as with highest frequencies, above about 2 d-1. For higher rotation rate, one could expect that retrograde modes complement the lowest frequency range. But the higher values of imply the lower values of the inclination angle which in turn favor the axisymmetric modes (). We considered also a possibility that some of the low-amplitude peaks may result from combinations and found it unlikely. Our results give certain limits on the intrinsic amplitudes of modes.
5 Conclusions
In dense oscillation spectra such as in the case of HD 50230, equidistant period spacings can be very likely accidental and one should be cautious when interpreting such structures. Although the dream of rich oscillation spectra in the B-type pulsators has come true, we still do not have any clue to identify angular numbers of observed frequencies. Without additional observations which would allow for mode identification, a reliable seismic stellar model of the star cannot be constructed.
We see prospects for gaining new insight into nonlinear mode selection in stars from available data on HD 50230. Our efforts toward explaining the observed distribution of peaks in its oscillation spectrum will continue.
Acknowledgements.
WD was supported by Polish NCN grant DEC-2012/05/B/ST9/03932. WS was supported by Polish NCN grant 2012/05/N/ST9/03905. Calculations have been carried out using resources provided by Wrocław Centre for Networking and Supercomputing (http://wcss.pl), grant No. 265.References
- [Degroote et al. (2010)] Degroote, P., Aerts, C., Baglin, A., et al. 2010, Nature, 464, 259
- [Degroote et al. (2012)] Degroote, P., Aerts, C., Michel, E., et al. 2012, ApJ, 542, 88
- [Lee & Saio (1997)] Lee, U., & Saio, H. 1997, ApJ, 491, 839
- [Townsend (2003)] Townsend, R.H.D. 2003, MNRAS, 340, 1020
- [Townsend (2005)] Townsend, R.H.D. 2005, MNRAS, 360, 465