New Constraints on the Escape of Ionizing Photons from Starburst Galaxies Using Ionization-Parameter Mapping
Abstract
The fate of ionizing radiation in starburst galaxies is key to understanding cosmic reionization. However, the galactic parameters on which the escape fraction of ionizing radiation depend are not well understood. Ionization-parameter mapping provides a simple, yet effective, way to study the radiative transfer in starburst galaxies. We obtain emission-line ratio maps of [Siii]/[Sii] for six, nearby, dwarf starbursts: NGC 178, NGC 1482, NGC 1705, NGC 3125, NGC 7126, and He 2-10. The narrow-band images are obtained with the Maryland-Magellan Tunable Filter at Las Campanas Observatory. Using these data, we previously reported the discovery of an optically thin ionization cone in NGC 5253, and here we also discover a similar ionization cone in NGC 3125. This latter cone has an opening angle of (0.4 ster), indicating that the passageways through which ionizing radiation may travel correspond to a small solid angle. Additionally, there are three sample galaxies that have winds and/or superbubble activity, which should be conducive to escaping radiation, yet they are optically thick. These results support the scenario that an orientation bias limits our ability to directly detect escaping Lyman continuum in many starburst galaxies. A comparison of the star-formation properties and histories of the optically thin and thick galaxies is consistent with the model that high escape fractions are limited to galaxies that are old enough ( 3 Myr) for mechanical feedback to have cleared optically thin passageways in the ISM, but young enough ( 5 Myr) that the ionizing stars are still present.
Subject headings:
galaxies: evolution – galaxies: ISM – galaxies: starburst – ISM: general – diffuse radiation – radiative transfer1. Introduction
Between and , the universe experienced a change of state known as cosmic reionization (e.g., Shull et al., 2012; Fan et al., 2006, 2001). The source for cosmic reionization is still unclear; the primary contenders are star-forming galaxies and quasars. However, the space density of quasars peaks at and drops below the threshold needed to supply the required amount of ionizing radiation at (Madau et al., 1999; Fan et al., 2001; Meiksin, 2005; Shankar & Mathur, 2007). The massive stars found in high-redshift star-forming galaxies have the potential to provide enough ionizing radiation, but whether they contribute significantly to the intergalactic ionizing emissivity is not yet established (e.g., Yajima et al., 2012). In order to account for cosmic reionization, the mean fraction of ionizing radiation that escapes the galaxy population , needs to be at least 20% (e.g., Bouwens et al., 2010).
In theory, starburst galaxies should be porous to ionizing radiation (e.g., Clarke & Oey, 2002; Paardekooper et al., 2011). Stellar winds and supernovae, in conjunction with radiation pressure, will punch holes in the interstellar medium (ISM) (e.g., Mac Low & McCray, 1988), and thereby create low density passageways through which ionizing radiation may escape (e.g., Dove et al., 2000). Feedback from massive stars is strongest in galaxies with high star-formation rates, making starbursts attractive candidates for the source of cosmic reionization.
The observational evidence for significant at high redshift is inconclusive. Using a sample of 29 Lyman break galaxies (LBG), Steidel et al. (2001) showed that at least some starbursts have large escape fractions. However, Lyman continuum narrow-band imaging studies with larger galaxy samples found escaping Lyman continuum in only 10% of the galaxies observed (e.g., Shapley et al., 2006; Iwata et al., 2009). Observations by Nestor et al. (2011), put the mean escape fraction at . Is it important to note that Vanzella et al. (2012) recently illustrated that a majority of narrowband Lyman continuum detections could actually be low interlopers, which would drive the observational even lower.
At intermediate to low redshift, some evidence exists for significant from LGB analogs. A subset of these galaxies with extreme feedback have favorable conditions for escaping Lyman continuum, such as low opacity in the ISM (Heckman et al., 2011). However, the fraction of galaxies with these conditions is still small, indicating a low mean (e.g., Siana et al., 2010). Looking at galaxies, the detection rate drops further, with only two examples of local starbursts that have measurable (Leitet et al., 2013, 2011). Most other studies find no direct evidence for escaping Lyman continuum in local starbursts (Bridge et al., 2010; Grimes et al., 2009; Heckman et al., 2001; Leitherer et al., 1995).
In order to determine the mean galactic from observed escape fractions, we need to disentangle the effects of observational biases from trends with intrinsic galaxy properties. In the massive-star feedback-driven model, the escape fraction will depend on the star formation rate, the ISM morphology and density (Fernandez & Shull, 2011; Benson et al., 2012), and distribution of star formation. However, the winds that clear the ISM are not isotropic, which leads to a preferred direction for escape and finite opening angles (Veilleux et al., 2005). These effects create observational dependencies with the orientation of the host galaxy. Finally, measuring the Lyman continuum at any redshift is a challenge. Most of the flux is absorbed by the intergalactic medium, thus the signal is low, which requires long integration times. For targets at higher redshift, low-redshift interlopers confuse the statistics (Vanzella et al., 2012). Some studies measure the optical depth to UV lines in the ISM in lieu of direct measurements of the Lyman continuum. They obtain the escape fraction after making assumptions about the gas distribution and the relative optical depths in the Lyman continuum and the observed ion (e.g., Heckman et al., 2011).
In this study we use a method that is complementary to other established approaches for investigating the factors that affect the escape of ionizing radiation from starbursts. We map the ionization structure of extended ionized gas in six local starbursts using emission-line ratio images. Spatial changes in emission-line ratios reveal the passage of ionizing radiation through the galaxy (Pellegrini et al., 2012). Thus, by studying the ionization structure of extended ionized gas in our sample, we can determine the optical depth of the galaxies and evaluate the likelihood of escaping Lyman continuum.
2. Method and Data
2.1. Method
Determining the fate of ionizing radiation in starburst galaxies is a challenging observational problem. Here, we present an approach that uses the technique of ionization parameter mapping (IPM; Pellegrini et al., 2012). Spatial changes to the ionization parameter, which evaluates the ionizing photon density relative to the gas density, trace the passage of ionizing radiation through the ISM. In order to track these spatial changes, we create maps of the starbursts using the [Siii]/[Sii] line ratio, which acts as a proxy for the ionization parameter. Optically thin and thick regions exhibit different ionization parameter morphologies. In regions that are optically thick, there is a transition from high to low ionization states at the interface of the ionized region and the neutral environment, whereas optically thin regions lack this transition zone (Pellegrini et al., 2012). Thus, by using ratio maps of two ions, one can distinguish between optically thick and thin regions (Pellegrini et al., 2012). Across an entire galaxy, one can thus use the ionization structure to evaluate whether and in what manner ionizing radiation escapes the galaxy (e.g., Zastrow et al., 2011; Pellegrini et al., 2012). This method has the advantage that it can be accomplished with narrow-band ground-based imaging, which makes it more observationally straightforward than other methods.
2.2. Data
The galaxies selected for this study are all nearby dwarf starbursts. They have star formation rates (SFR) of 0.05–5 /yr and stellar masses log(M∗) . Since massive star feedback is thought to play a key role in the escape of Lyman continuum (LyC) photons (Heckman et al., 2011), we select galaxies that have evidence in the literature for winds and expanding bubbles. Table 1 shows the properties of our sample. We calculate the stellar masses (Column 2) using the -band magnitudes from Skrutskie et al. (2003) and the mass to light (/) ratios following Bell et al. (2003), which use the galaxies’ or colors to derive . We restrict this study to starbursts within 45 Mpc, which corresponds to spatial scales of pc/arcsec, to ensure high enough spatial resolution to trace the ionization structure of the extended gas.
We obtained narrow-band emission-line imaging in H, [Sii], and [Siii] on the nights of 2009 July 7–11 and 2010 February 12–14. The wavelengths quoted above are the rest frame wavelengths of the emission lines. We imaged the galaxies using the Maryland-Magellan Tunable Filter (MMTF; Veilleux et al., 2010), which is mounted on the Inamori-Magellan Areal Camera and Spectrograph (IMACS) on the Magellan Baade telescope at Las Campanas Observatory. For every emission-line image, we obtained paired continuum exposures of the galaxies. Our observing log is presented in Table 2. For each galaxy (Column 1), we list the targeted emission line and central bandpass (Columns 2, 3), exposure times (Columns 4), and the 3 surface brightness limit in the reduced image (Columns 5).
We reduced the MMTF data using version 1.4 of the MMTF data reduction pipeline111http://www.astro.umd.edu/~veilleux/mmtf/datared.html. This pipeline performs bias and flatfield corrections and then subtracts the sky using an azimuthal averaging. Next, it corrects cosmic rays and bad CCD pixels before mosaicking the different CCD chips into one image. Finally, it averages the individual emission-line and continuum images. We flux calibrated the images using standard stars LTT 1020, 6248 and 7987 (Hamuy et al., 1994). We note that for the February 2010 observing run, our measured H fluxes are a factor of 2–3 lower than the H fluxes reported in the literature. A combination of shallower exposure times, combined with errors in the velocity offsets of our central bandpass, wind activity that shifts flux out the narrow MMTF bandpass, and uncertainty in the [Nii] correction factors for the literature values, lead to this offset. However, a comparison with long-slit spectra confirms that the line ratios are sound.
In order to cleanly subtract the continuum from the emission-line images, we first aligned the emission-line and continuum frames using IRAF222IRAF is distributed by NOAO, which is operated by AURA, Inc., under cooperative agreement with the National Science Foundation. tasks wregister and imalign. Next, we used psfmatch to convolve the image with the better seeing with the psf from the other. Finally, we used several bright stars in the field and the task mscimatch to determine the proper scaling to match counts in the stars between the images. This last step was performed iteratively until we obtained a clean continuum subtraction. We present the final continuum-subtracted H images and three-color composite images of the galaxies in our sample in Section 3.
Scattered light in the instrument causes an optical artifact that is not easily corrected for and that stretches across CCD chips 3 and 5. For the most part, we avoid this issue by placing our targets on the other chips. However, for NGC 178, most of our observations have the galaxy sitting on chips 3 or 5. To mitigate the artifact, we mask the affected region in the flat field. While this increases the flux error on this galaxy, this effect is much less significant than the alteration in flux caused by the artifact on the flat.
We also note that the data from the 2009 July observing run are bright time observations. As a result of scattered light in the f/2 camera and the MMTF instrument, these observations are challenging to reduce. The emission-line images of NGC 178 and NGC 7126 show many background sky features that are caused by these effects (Figure 11 and 13).
| Galaxy | log()a | Distance | Refb | |
|---|---|---|---|---|
| [] | [Mpc] | [erg s] | ||
| NGC 178 | 9.24 | 20.6 | (5),(8) | |
| NGC 1482 | 10.56 | 22.6 | (2) | |
| NGC 1705 | 8.37 | 5.1 | (3),(7) | |
| NGC 3125 | 9.09 | 11.5 | (1),(7) | |
| NGC 5253 | 9.05 | 3.8 | (9),(7) | |
| NGC 7126 | 10.44 | 45.5 | (5),(8) | |
| He 2-10 | 9.50 | 9 | (6),(4) |
| Galaxy | band | Exp time | ||
|---|---|---|---|---|
| Name | Å | [s] | [erg/s/cm2/″] | |
| NGC 178 | H | 6594 | ||
| [Sii] | 6749 | |||
| [Siii] | 9113 | |||
| NGC 7126 | H | 6628 | ||
| [Sii] | 6783 | |||
| [Siii] | 9159 | |||
| NGC 1705 | H | 6572a | ||
| [Sii] | 6730 | |||
| [Siii] | 9087 | |||
| He 2-10 | H | 6582 | ||
| [Sii] | 6735 | |||
| [Siii] | 9095 | |||
| NGC 3125 | H | 6587 | ||
| [Sii] | 6740 | |||
| [Siii] | 9102 | |||
| NGC 1482 | H | 6602 | ||
| [Sii] | 6759 | |||
| [Siii] | 9121 | |||
3. Results
In this section we present and discuss the ionization parameter maps of the galaxies individually. In section §4, we discuss the results from the sample as a whole.
3.1. Galaxies with Extended emission
3.1.1 NGC 5253
NGC 5253 is a nearby dwarf galaxy currently undergoing an extreme burst of star formation. Using [Siii]/[Sii] ratio maps, Zastrow et al. (2011) discovered an optically thin ionization cone in this amorphous elliptical galaxy (Figure 2 of Zastrow et al., 2011). The ionization cone is narrow with an opening angle and is detected out to pc from the starburst. The measured opening angle implies a solid angle for the cone that spans of 4 steradians on the sky, assuming axisymmetry about the cone axis (Zastrow et al., 2011). If many starbursts have similar geometry, this suggests that an orientation bias may limit our ability to detect escaping LyC in starburst and high-redshift galaxies.
3.1.2 NGC 3125
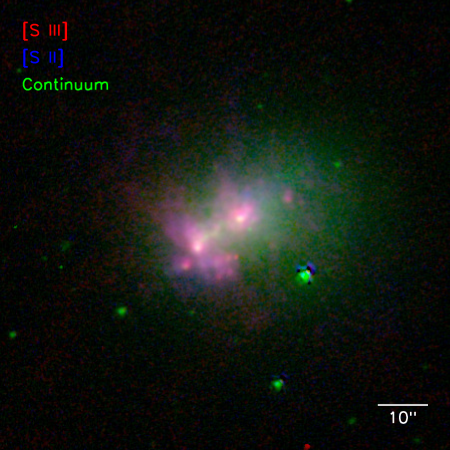
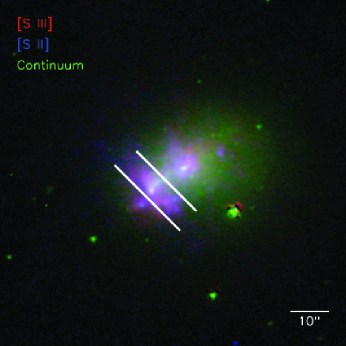
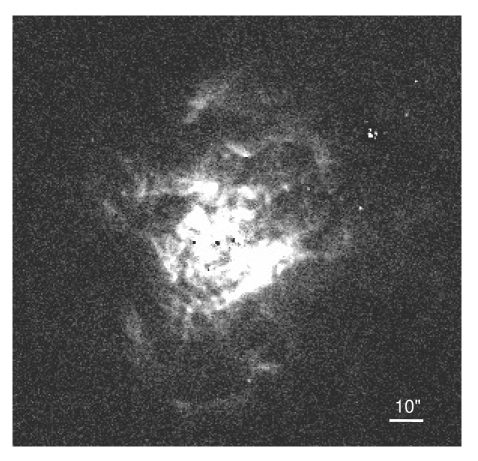
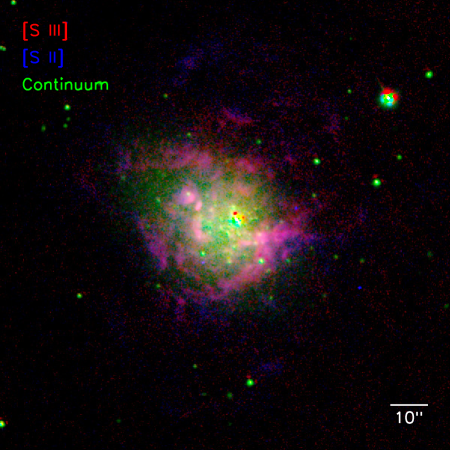
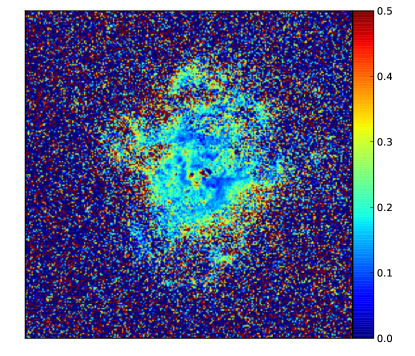
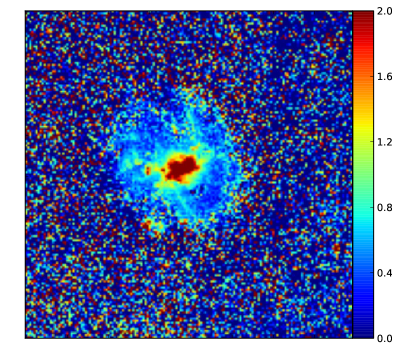
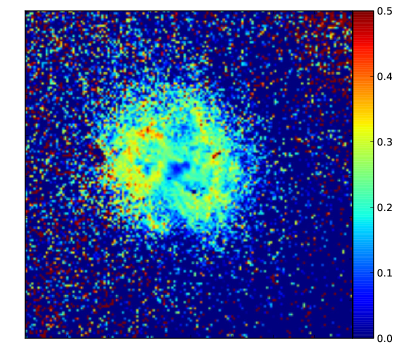
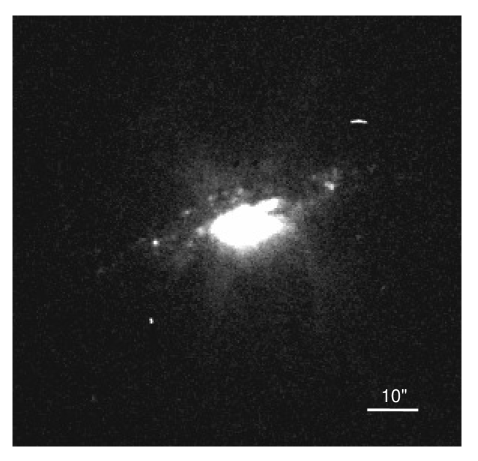
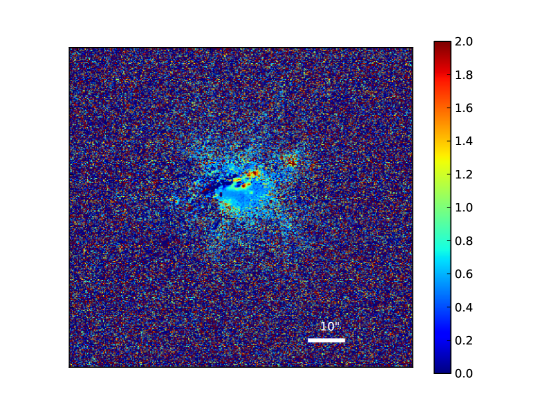
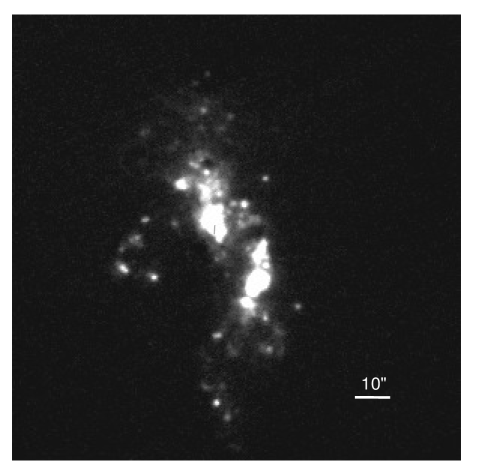
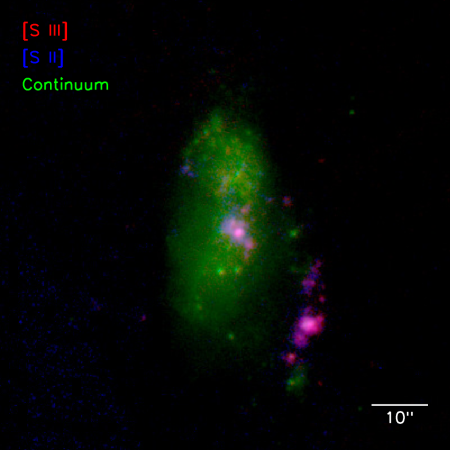
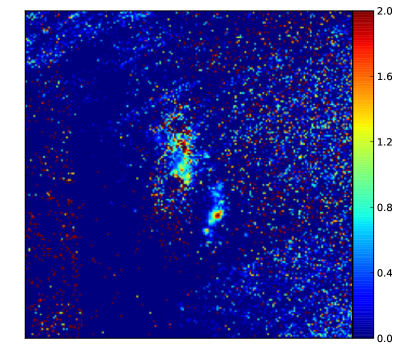
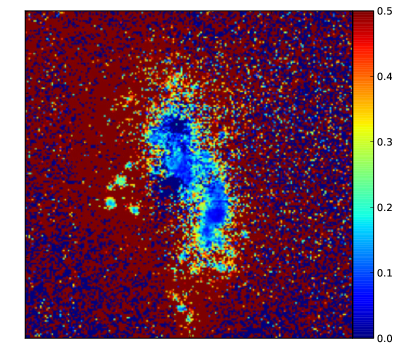
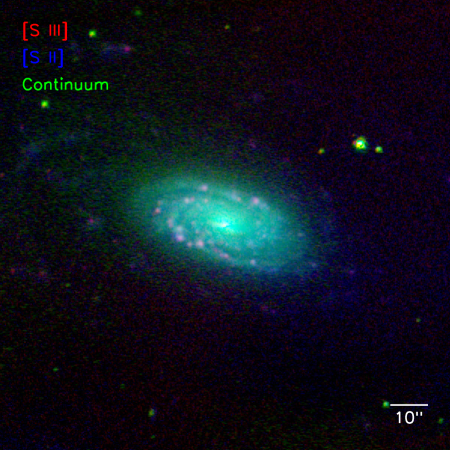
NGC 3125 is a dwarf galaxy that has a bursty star formation history with roughly three recent epochs of star formation (Vanzi et al., 2011). This galaxy has two prominent star forming knots, knot A to the northwest and knot B to the southeast (Vacca & Conti, 1992); both contain massive star clusters and are the main hosts for the Wolf-Rayet population in the galaxy. The ionized gas in NGC 3125 is concentrated around the star-forming knots towards the eastern side of the galaxy relative to the overall stellar distribution (Figure 1). Figure 2 shows the emission-line ratio maps for NGC 3125.
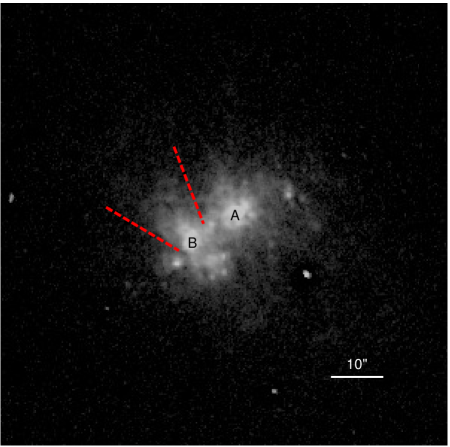
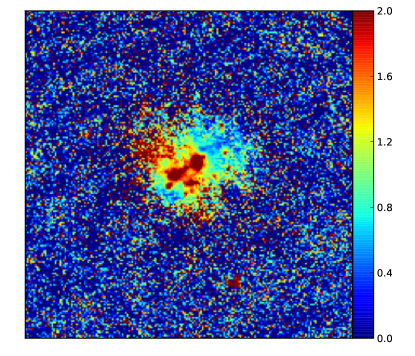
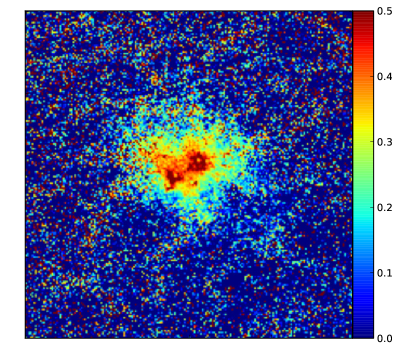
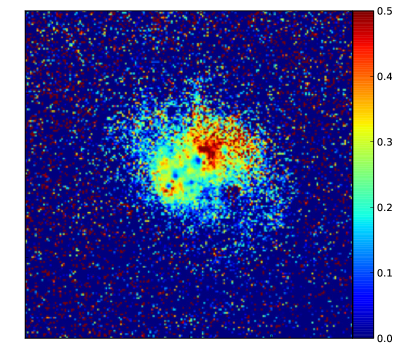
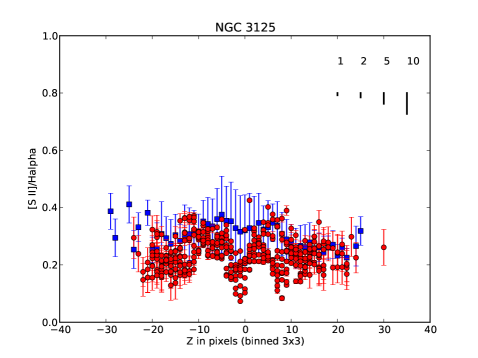
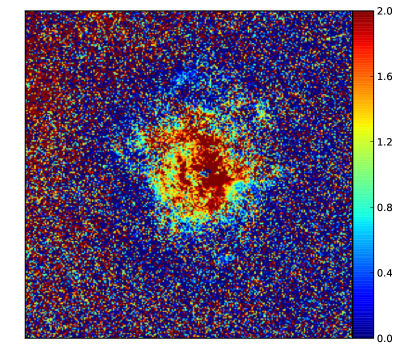
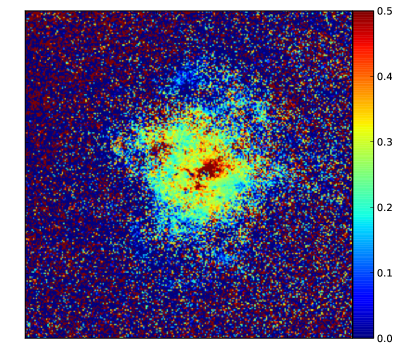
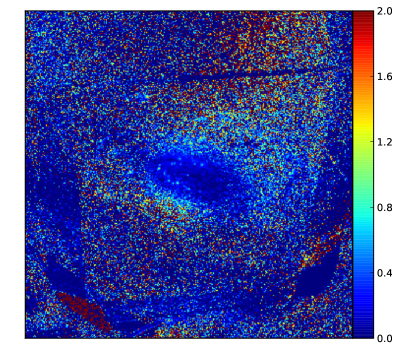
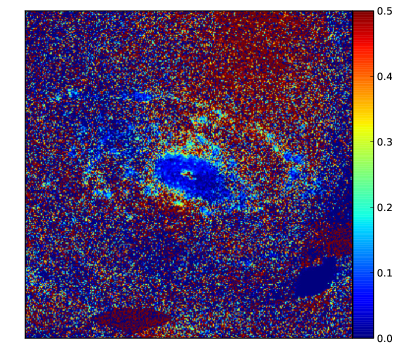
We discover a bipolar ionization cone in the emission-line gas extending northeast and southwest of knot B. To the northeast this ionization cone has an opening angle of . We obtain this measurement using the lines parallel to the edges of the cone, which are shown by the red dotted lines on the H image in Figure 1. As can be seen in the [Siii]/[Sii] ratio map (Figure 2(a)), the ionization cone to the northeast of knot B exhibits high [Siii]/[Sii] throughout. The lack of transition to low values of [Siii]/[Sii] at the edge implies that the ionization cone is optically thin. This conclusion is supported by the low [Sii]/H observed throughout this portion of the cone (Figure 2(c)), which is consistent with expectations for optically thin gas (Pellegrini et al., 2012). To the southwest, the line ratios are less conclusive. While they transition to low [Siii]/[Sii] as one moves away from knot B, there seems to be another transition to high [Siii]/[Sii] near the outer edge. However, the line ratios are less certain in this region.
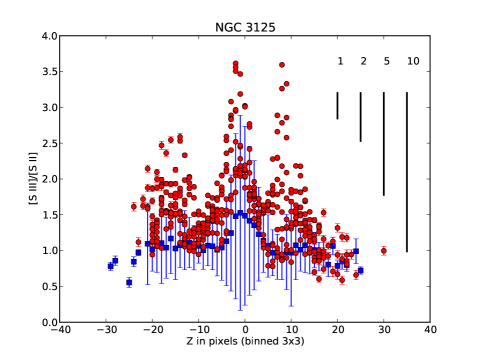
In Figure 3, we quantitatively compare the line ratios in the ionization cone to those of the rest of the galaxy. Figure 3 shows the line ratios from the binned ratio maps (Figure 2) as a function of , the projected distance above and below the major axis of the galaxy. The red points represent the line ratios from the ionization cone, selected from the region between the white lines shown in the bottom panel of Figure 3. The blue points are the mean line ratios from the rest of the galaxy at that . The error bars on the blue points represent either the standard deviation of the line ratios at that or the error on the mean, whichever is more. All points originate from pixels that have a minimum 2 detection in all three emission-line bands in the 33 binned images. From the top and middle plots in Figure 3, we see a clear excess in [Siii]/[Sii] and a deficiency of [Sii]/H in the NE side of the cone. This behavior is consistent with expectations for optically thin gas.
The trends in the line ratios discussed above are robust, even after considering the effects of internal reddening on the ratio maps. The lines shown on the upper right of Figure 3 indicate how the line ratios would change with different levels of reddening. In order to explain the observed [Siii]/[Sii] excess, the reddening would have to have . We note that the measured reddening toward knots A and B are and 0.21, respectively (Hadfield & Crowther, 2006), which correspond roughly to . Based on polarimetric observations most of the dust is located in the plane of the galaxy (Alton et al., 1994). Thus it is reasonable to expect that the extinction in the cone is much less than that toward knots A and B. Furthermore, while strong reddening would enhance the [Siii]/[Sii] ratio, correcting for it would drive the [Sii]/H ratio even lower, which strengthens the argument for optically thin gas.
Marlowe et al. (1995) study the kinematics of the H gas in NGC 3125 using echelle spectra. They detect a Doppler ellipse along the ionization cone to the northeast, showing that it is a bubble expanding with km/s. This detected bubble is consistent with the idea that massive star feedback clears low-density passages in the ISM through which ionizing radiation may escape. To add further support to this picture, low-resolution X-ray observations show that the X-ray distribution is elongated along the minor axis of the galaxy (Fabbiano et al., 1992), suggestive of feedback related activity. Furthermore, the ionization cone occurs at the edge of the galaxy, which may make it easier for ionizing radiation to escape (Gnedin et al., 2008; Paardekooper et al., 2011). The kinematics towards the southwest are less clear, and Marlowe et al. (1995) do not detect a Doppler ellipse in this region.
We also see ionized gas extending to the northeast of knot A. Figure 2(a) shows that while the gas near the cluster has high ionization parameter, it clearly transitions to a low ionization parameter as the distance from the cluster increases. The transition indicates that the galaxy is optically thick in that direction. The line ratio comparison in Figure 3 supports this analysis.
As discussed in §2.2, our H observations are missing a significant amount of flux due to a combination of wavelength calibration uncertainties, velocity offsets, and shallow integration. For this reason, we use the H observations of Gil de Paz et al. (2003), to measure the H flux in the ionization cone. After correcting for an expected 10% contribution to the flux from the nearby [Nii] lines, we obtain erg s-1 cm-2, which corresponds to a rate of ionizing photons of log()=51.02. This means that the equivalent of at least 100 () O7 stars ionize the cone, assuming = for an O7 star at the metallicity of NGC 3125 (Smith et al., 2002). Knot B has the equivalent of O7 stars based on H flux (Hadfield & Crowther, 2006, adjusted to the same per O7 star). Based on these numbers, roughly 8% of the ionizing radiation generated by the cluster needs to escape into the NE cone.
The ionization cone in NGC 3125 is narrow and appears somewhat collimated, with an opening angle of . This angle corresponds to a solid angle of % of 4 steradians, assuming axisymmetry about the cone axis. We note that this value is not inconsistent with the 8% escape fraction estimated from the H flux, above. Since knot B is smaller than the base of the cone, the covering fraction of the cone relative to the cluster is larger than that of the cone on the sky. We note that the 8% quoted here only refers to the cluster in knot B. Using the total (H)=3.4 erg s-1 cm-2 (Marlowe et al., 1995), the cone represents of the ionizing flux of the galaxy.
The presence of an optically thin ionization cone suggests that ionizing radiation is escaping this starburst. At the very least, we see that ionizing radiation is escaping the main body of the galaxy and traveling into the halo. The small implied solid angle, in conjunction with a preferred direction is similar to the geometry for NGC 5253, again supporting the possibility that an orientation bias affects our ability to detect escaping Lyman continuum in starbursts and LBGs.
3.1.3 NGC 1705
NGC 1705 is a nearby starburst galaxy with a stunning starburst-driven galactic wind (Meurer et al., 1992). NGC 1705 has a combined stellar and gas mass of (Meurer et al., 1992). The metallicity measurements range from 12+log(O/H) = 8.21 to 8.46 (Lee & Skillman, 2004; Storchi-Bergmann et al., 1994; Meurer et al., 1992). Like similar dwarf starbursts, NGC 1705 has a bursty star formation history with two recent star forming epochs in the last 15 Myr (Annibali et al., 2003, 2009). One of these bursts formed the well known super-star cluster (SSC) at the center, which has log() and an age of Myr (Melnick et al., 1985; O’Connell et al., 1994; Ho & Filippenko, 1996). This SSC generates most of the UV luminosity and is consistent with a population dominated by B stars (Heckman & Leitherer, 1997). That same 10–15 Myr old burst of star formation is thought to have launched the galactic wind (Annibali et al., 2003, 2009). This burst was followed by a more recent epoch of star formation, Myr ago that may have been triggered by the wind (Annibali et al., 2003, 2009).
In emission-line gas, NGC 1705 shows filamentary extended substructure as a result of its galactic wind (Meurer et al., 1992). Based on H observations, the superbubble has an expansion velocity 50–132 km/s (Marlowe et al., 1995; Meurer et al., 1992). Heckman & Leitherer (1997) studied the kinematics using UV interstellar absorption lines and found further evidence for an expanding wind. X-ray observations show that the wind has similar size and morphology to the optically detected gas (Strickland et al., 2004). The star-forming nucleus resides on the axis of symmetry for the superbubble, which further supports that the wind is driven by star formation (Meurer et al., 1992). Shocks contribute only a small amount to the ionization in the wind, as most of the emission-line gas is photo-ionized (Marlowe et al., 1995; Veilleux et al., 2003). Our emission-line images and ratio maps for NGC 1705 are shown in Figures 4, and 5. The ionized gas associated with the wind is clearly detected in both [Siii] and [Sii].
The spatial changes in the [Siii]/[Sii] ratio map suggest that the wind in NGC 1705 is optically thick. Close to the starburst, the [Siii]/[Sii] ratio is high, as expected from photoionized gas near the ionization source. However, as one looks further into the wind, there is a clear transition towards lower [Siii]/[Sii] ratios, and at the far edge of the shells, the line ratios indicate the [Sii] emission is dominant. This is further supported by the [Sii]/H and [Siii]/H ratio maps in Figures 5(c) and 5(b). In these maps, the [Sii]/H ratio increases at the edges of the filament, and, as expected based on Figure 5(a), the [Siii]/H ratio decreases. While this behavior is consistent with optically thick gas, we note that if the radiation field is dominated by hot stars with softer ionizing spectra, as in the case of NGC 1705, the gas may simultaneously exhibit a low-ionization transition zone and be optically thin (Pellegrini et al., 2012).
In addition to evaluating the optical depth in the plane of the sky, the ratio maps can be used to evaluate the optical depth along the line of sight. For gas with abundances similar to that of the LMC, [Sii]/H is a diagnostic for optically thin photoionized gas along the line of sight. Of particular interest is the region around NGC 1705-1, the super star cluster. Heckman & Leitherer (1997) estimated a very low absorbing HI column, , toward NGC 1705-1. This column is an order of magnitude smaller than the column measured from 21 cm observations, which suggests that the cluster is either sitting in front of most of the HI or that we are observing the SSC through a hole in the ISM (Heckman & Leitherer, 1997). Either scenario increases the likelihood for escaping Lyman continuum. However, Figure 5(c) shows that [Sii]/H over the entire nuclear region, which indicates that the nuclear region is optically thick in the line of sight. The low HI column combined with optical [Sii]/H implies that even though the neutral gas may have large variations in column density, the majority of sight lines are optically thick.
It is expected that strong starburst feedback, such as that present in NGC 1705, is conducive to escaping Lyman continuum. However, our observations indicate that the wind in NGC 1705 is optically thick. Both the strength of the radiation field and the amount of gas available to absorb the ionizing radiation will determine whether the galactic wind is optically thick or thin. While there have been two recent epochs of star formation, one 10-15 Myr ago and one Myr ago (Annibali et al., 2003, 2009), the ionizing population is dominated by B stars (Heckman & Leitherer, 1997). This means that there are relatively fewer ionizing photons being emitted and the radiation field is softer than if there were significant numbers of O stars. In addition to a reduced radiation field, a ‘spur’ of HI gas is associated with the outflow (Meurer et al., 1998). This spur of neutral gas is likely co-spatial with the optically detected galactic wind based on its kinematics and orientation (Meurer et al., 1998; Elson et al., 2013). The feature has an HI column density of , which is more than high enough to be optically thick to Lyman continuum. Thus, despite the presence of a strong galactic wind, NGC 1705 is likely optically thick due to a combination of population age and gas morphology.
3.1.4 He 2-10
He 2-10 is one of the prototypical HII galaxies (Allen et al., 1976). It is 9 Mpc away (Vacca & Conti, 1992) and has dynamical mass (Kobulnicky et al., 1995). In emission-line gas there are many notable loops and filaments (Figure 6) whose kinematics suggest expanding bubbles and possible outflows (Méndez et al., 1999). These bubbles are centered on sites of recent star formation. He 2-10 is the host of nearly 80 SSCs (Johnson et al., 2000). The central starburst contains a handful of clusters in ultra-compact Hii regions that contain the ionizing equivalent of 700-2600 O7 stars each (Johnson & Kobulnicky, 2003). In addition to prodigiously forming stars, SFR 0.87 - 2 /yr (Calzetti et al., 2010; Reines et al., 2011), this galaxy was recently found to be the host of an AGN (Reines et al., 2011).


In the [Siii]/[Sii] ratio map (Figure 7(a)), the central star forming region stands out with high [Siii]/[Sii], as would be expected for a region hosting thousands of O stars. As the radius from the center increases, [Siii]/[Sii] drops considerably. There is a local maximum to the east around the location of the second SSC. However, even here the emission-line gas transitions to low [Siii]/[Sii] toward the edge of the expanding bubble. The contrast at the edges of the bubbles is seen more clearly in the [Sii]/H ratio map (Figure 7(c)), where a clear enhancement of [Sii]/H is present. In contrast the [Siii]/H ratio (Figure 7(b)) falls off as the distance from the ionizing source increases, as would be expected for an optically thick nebula.
The spatial changes in the line ratio maps are consistent with expanding superbubbles. High ionization parameter gas is present close to the ionizing source, while the edges of the bubbles have low ionization parameter and possible contribution to [Sii] from shocks. Studies of the H kinematics indicate a potential Doppler ellipse in the NE bubble and velocities differences of up to km/s across the galaxy (Méndez et al., 1999). Using UV interstellar lines, Johnson et al. (2000) determined that the bulk motion of the ISM indicates an outflow with km/s. The velocities reported by both works are in excess of the escape velocity km/s (Johnson et al., 2000). However, the closed loops of the outflow seen in the H images suggest that these bubbles have not yet broken out of the ISM to form a galactic fountain. Bubble walls severely hinder the passage of ionizing radiation, and can delay the escape of Lyman continuum radiation until has dropped considerably (Dove et al., 2000; Fujita et al., 2003).
He 2-10 is unique in our sample, in that it is the only galaxy that contains a confirmed AGN. This AGN was discovered by Reines et al. (2011) as a radio and X-ray point source and is located near the star forming region of knot A. The accretion rate onto the AGN is modest, but may have been greater in the past (Reines et al., 2011). Thus, the presumed tracers for massive-star feedback, such as the large expanding bubbles, may be contaminated by contributions from the AGN as opposed to being driven by star formation.
The distribution of gas in the ISM plays a critical role in the passage of ionizing radiation in a galaxy. The HI observations from Kobulnicky et al. (1995) show that the neutral ISM extends significantly beyond the optically detected ionized gas. This observation is consistent with the observations of optically thick bubbles. However, if this overall HI envelope has a clumpy distribution, it is still possible to have small low-density passages through which ionizing radiation may escape the starburst. The [Sii]/H ratio map shows two locations that have [Sii]/H and may be optically thin. We note these locations with small circles on Figure 6. One of these regions coincides with the location of the AGN, and the other lies 4″ to the SE from the first. While our data cannot establish the presence of an optically thin path from the galaxy conclusively, these observations are suggestive that feedback from the AGN or star formation in the region have cleared out a small hole in the ISM. The variable reddening measurements derived from different wavelengths and positions in the galaxy further suggest an inhomogeneous distribution of gas and dust throughout the galaxy (e.g., Sauvage et al., 1997). The presence of small local holes is also supported by the fact that many of the probably young SSCs do not show commensurate H emission, which suggests that gas has been evacuated in the regions of these clusters (Johnson et al., 2000). If this is the case, it supports the picture that ionizing radiation escapes galaxies through small holes and that an orientation bias affects our ability to detect escaping Lyman continuum. We note that these line ratios have not been corrected for reddening. However, any reddening correction would drive the [Sii]/H line ratio lower, strengthening the argument for optically thin gas along the line of sight.
3.1.5 NGC 1482
NGC 1482 is an SA0 (de Vaucouleurs et al., 1991) with a well known galactic wind (Hameed & Devereux, 1999). At a distance of 22.6 Mpc (Kennicutt et al., 2011), this starburst is a highly inclined disk with a prominent dust lane (de Vaucouleurs et al., 1991). The wind was first discovered by (Hameed & Devereux, 1999) in optical emission-lines, with later optical and X-ray observations confirming its nature as a wind (Veilleux & Rupke, 2002; Strickland et al., 2004).
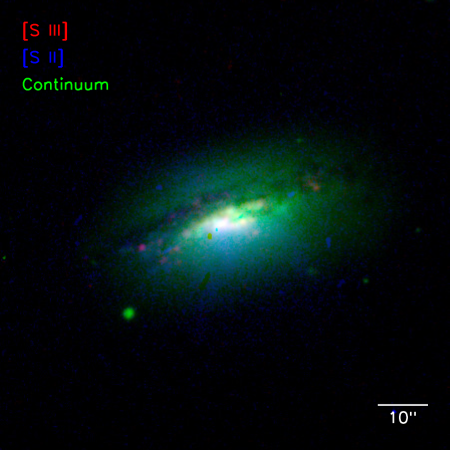
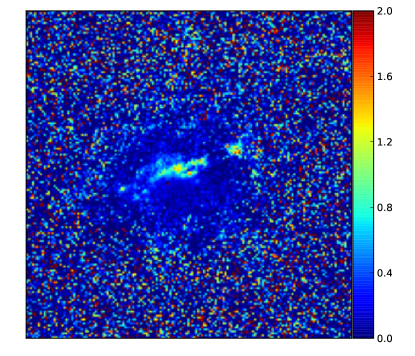
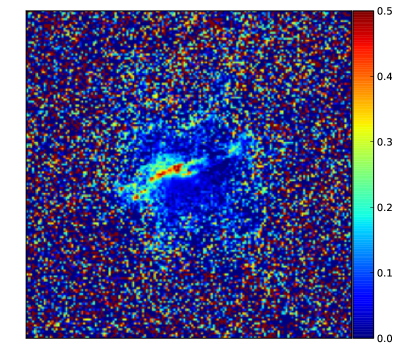
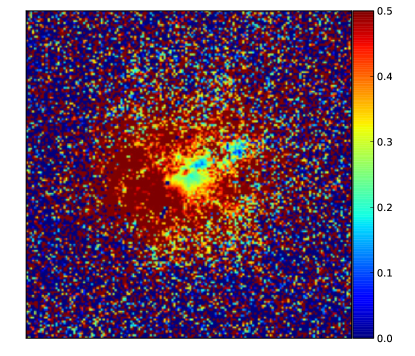
In our emission-line images (Figure 8) and ratio maps (Figure 9), we primarily detect the wind in [Sii] and H. The [Siii] emission is confined to the star forming region in the inner disk. The ionization parameter map shows strong evidence for radiation bounding in NGC 1482. High [Siii]/[Sii] traces the disk star forming region, and the line ratio drops precipitously as one moves further into the wind (Figure 9(a)). Veilleux et al. (2003) found the wind to be dominated by shock ionization based on [Nii]/H observations. Our [Sii]/H map (Figure 9(c)) confirms this picture with [Sii]/H in the wind.
In reality, the emission observed in the wind will be a combination of shock- and photoionized gas. In order to put strong constraints on the [Siii]/[Sii] line ratio in the wind, we explore correcting the line ratios for the shock ionization as follows. As discussed by Jaskot & Oey (2013), the observed line ratio can be written as:
| (1) |
where A and B correspond to the emission lines in question, and the subscripts , , and indicate the observed, shocked, and photoionized line strengths, respectively. To convert our observed line ratios to the line ratios of photoionized gas, we need to solve for the fraction of shock-ionized relative to photoionized gas,
| (2) |
Together with Equation 1, this yields:
| (3) |
.
In Equation 3, can be replaced by the predicted line strengths from MAPPINGS III shock models (Allen et al., 2008). Since Veilleux & Rupke (2002) observed velocities of up to km/s in the wind, we explore shocks with km/s (assuming strong shocks). For this calculation we use the MAPPINGS III shock-only models, which provide the most optimistic correction factor for high [Siii]/[Sii] from photoionization. The precursor component to the shock would increase the relative contribution of shocks to the [Siii], thus moving the corrected line ratios more towards optically thick than the shock only models. To solve for , we write Equation 3 for each emission line ratio, [Siii]/[Sii], [Siii]/H, and [Sii]/H. By combining the resultant equations, we finally solve for :
| (4) |
where
| (5) |
and and are the corresponding values for [Sii]/H and [Siii]/H, respectively. After solving for , we use that value in Equation 3 to create a new [Siii]/[Sii] map (Figure 10). We find that the [Siii]/[Sii] maps remain strongly radiation bounded.
Since there is evidence that the wind has cleared gas from the ISM of NGC 1482, it is somewhat surprising that this object does not show evidence for an optically thin wind. HI observations reveal a hole in the HI distribution at the location of the wind (Hota & Saikia, 2005; Omar & Dwarakanath, 2005). Further evidence that the wind has cleared material from the center of the galaxy is found by Sharp & Bland-Hawthorn (2010). They generate a [Sii] ratio map and see a sharp gradient at the base of the wind, which suggests clearing of the inner disk by the wind (Sharp & Bland-Hawthorn, 2010). Both of these lines of evidence suggest that ionizing radiation can escape along the wind. Perhaps the massive star population in NGC 1482 has aged in the time since the wind launched, and, thus, has dropped significantly. Another explanation could be that dust entrained in the wind (Vagshette et al., 2012) provides additional material that absorbs radiation as it travels away from the galaxy.
We note here that some of the emission may be shifted out of our very narrow bandpasses. For km/s, the emission will shift by 5Å and 7Å for [Sii] and [Siii], respectively. This is comparable to half the bandpass in each of those filters. Exacerbating this effect, our central bandpass in [Siii] is shifted from the appropriate central bandpass for the redshift of NGC 1482. This means that for NGC 1482 we do not detect some of the redshifted emission from [Siii] in the wind, although we should detect all of the blueshifted component. That being said, the wind exhibits the transition from high to low ionization parameter gas relatively close to the disk of the galaxy. Furthermore, the [Siii]/[Sii] line ratio is well below 0.5 for most of the wind. Even if we assume that we are missing half of the [Siii] flux in the wind because of the velocity offset, the difference does not push the [Siii]/[Sii] ratio high enough to match our expectations for optically thin emission. Given the 5 kpc extent of the wind (Strickland et al., 2004), the location of the transition zone makes it less likely that the transition is a spurious one.
3.2. Non-Detections
3.2.1 NGC 178
NGC 178 is forming stars at a rate of 0.55 /yr (Oey et al., 2007) and lies 20.6 Mpc away (Meurer et al., 2006). In the emission-line images we see that ionized gas is split between two areas, one around the bulk of the observed continuum, and a separate extra-planar region (Figure 11). Since ionizing radiation emitted at the edge of galaxies is more likely to escape (Gnedin et al., 2008), it might be reasonable to expect to find some evidence of density bounding in this region of the ionization parameter map.
However, the ionization parameter map shows that all nebular regions are optically thick. The ionized gas to the west is comprised of a few separate peaks in the [Siii]/[Sii] ratio map (Figure 12), all of which exhibit a clear transition to low ionization parameter gas at the edges.

The [Sii]/H map (Figure 12) is intriguing. There appears to be an envelope of high [Sii]/H surrounding the galaxy. This envelope could be caused by the well known [Sii]/H gradient in the warm, ionized medium of galaxies (Rand, 1998) or could be a signature of shocked gas surrounding the galaxy. We note, however, that there are significant sky gradients and background features around the galaxy that are caused by scattered light within the instrument and by bright time observing conditions (§2.2). These sky features make it challenging to determine the nature of the surrounding low ionization parameter envelope.
3.2.2 NGC 7126
NGC 7126 is an SA(rs)c galaxy (de Vaucouleurs et al., 1991). At 45.5 Mpc away (Meurer et al., 2006), it is the most distant galaxy in our sample. The emission-line images reveal an extended spiral structure filled with Hii regions (Figure 13). HI observations show that it is interacting with its nearby companion NGC 7125 (Nordgren et al., 1997). NGC 7126 does not have a catalogued wind, and, with its high star formation rate, acts as a control against this parameter in the sample (Hanish et al., 2010).


The emission-line ratio maps are shown in Figure 14. The [Siii]/[Sii] map shows a remarkably low ratio of [Siii]/[Sii]. While the spiral structure is detected, it does not show up as clearly as it does in the H ratio maps. In the [Sii]/H ratio map, the Hii regions themselves appear with line ratios consistent with photoionized gas. As one moves to the edges of the individual regions, [Sii]/H increases. This is consistent with expectations of the warm, ionized medium in galaxies (Rand, 1998). We note, however, that these line ratios are a bit high, and they approach values consistent with shock ionization. The [Siii]/H map exhibits relatively low line ratios throughout, even at the centers of the observed Hii regions. This could be indicative that the ionizing stellar population is composed primarily of B or late O type stars.
4. Discussion
The full sample of seven galaxies provides examples of both optically thin and optically thick extended emission-line gas. By comparing the properties of these galaxies we can gain insight on the processes and properties that influence the escape of ionizing radiation. Table 3 presents relevant properties for each galaxy in the sample. Columns 1 and 2 are the galaxy name and HI mass, respectively; Columns 3, 4, and 5 present the H derived SFR, SFR surface density (), and the specific SFR (sSFR), respectively. Column 6 provides the references for the star formation rates, HI masses and H radii. Finally, Column 7 indicates whether the galaxy shows wind and/or expanding bubble activity, and Column 8 shows the ratio of HI mass to stellar mass (Table 1).
| Galaxy | log() | SFR | a | sSFR | Refb | Wind or | MHI/M |
|---|---|---|---|---|---|---|---|
| [] | [/yr] | [] | Gyr-1 | Bubbles? | |||
| Optically thin extended emission | |||||||
| NGC 3125 | 0.461 | 0.0826 | 0.374 | (1),n/a, (2) | Y (3) | ||
| NGC 5253 | 8.22 | 0.428 | 1.04 | 0.382 | (1),(4),(5) | Y (3) | 0.006 |
| Optically thick extended emission | |||||||
| NGC 1482 | 9.13 | 3.39 | 0.0271 | 0.093 | (1),(6),(7) | Y (8) | 0.037 |
| NGC 1705 | 7.96 | 0.057 | 0.0091 | 0.241 | (1),(4),(9,7) | Y (10) | 0.389 |
| He 2-10 | 8.49 | 0.872 | 0.340 | 0.276 | (1),(11),(12) | Y (13) | 0.098 |
| No detected extended emission | |||||||
| NGC 178 | 9.40 | 0.549 | 0.019 | 0.315 | (14),(4),(4) | N | 1.445 |
| NGC 7126 | 10.57d | 5.21 | 0.0467 | 0.188 | (14),(4),(4) | N | 1.349 |
4.1. Orientation bias
The interpretation of escaping Lyman continuum observations in starbursts and LBGs is challenging because of the need to disentangle observational effects from intrinsic trends. One issue under debate is whether the relatively few () galaxies that have significant are representative of the fraction of galaxies that have escaping Lyman continuum. Potential challenges that can modify the intrinsic distribution of include low redshift interlopers, a preferred direction of escape, and small covering fractions for the escaping Lyman continuum (e.g., Vanzella et al., 2012; Nestor et al., 2011). Examining the morphologies of the ionization cones observed in this work can shed light on this issue.
Two of the seven starburst galaxies studied here show strong evidence for optically thin ionization cones. In both NGC 5253 (see also Zastrow et al., 2011) and NGC 3125, the cones are aligned along the minor axis. This behavior is consistent with the expectations of massive-star feedback-driven models (e.g., Murray et al., 2011; Kim et al., 2012). The observed alignment implies a preferred direction; feedback will punch holes in the ISM more easily along the minor axis (e.g., Veilleux et al., 2005). In a study of low redshift LBG analogs, Heckman et al. (2011) measured extreme wind velocities () in all galaxies with low optical depth to Lyman continuum. The high velocities indicate the direction of the wind must be nearly aligned with the line of sight to the galaxy. This relationship between low optical depth and high outflow velocities further strengthens the argument that Lyman continuum escape has a preferred direction (Zastrow et al., 2011). Furthermore, the ionization cones exhibit narrow morphologies and subtend an estimated 4% of steradians. This implies that the covering fraction of escaping radiation will be much less than unity, and is consistent with the results from studies of high redshift star-forming galaxies (e.g., Nestor et al., 2011; Kreimeyer & Veilleux, 2013). We note that the narrow ionization cones do not necessarily imply small . If the physical size of the cone’s base is significantly larger than the size of the ionizing cluster, then large fractions of the ionizing flux produced by the cluster may still escape through the angularly narrow cone. The combination of small opening angles and preferred directions suggest that if one tried to directly detect escaping Lyman continuum, the axis of escape would need to be close to the observer’s line of sight in order to obtain a strong detection. If more galaxies are like NGC 3125 and NGC 5253, then an orientation bias makes it more challenging to detect escaping Lyman continuum in starbursts and LBGs.
4.2. Possible Trends with Galaxy Properties
In light of the massive-star feedback-driven model discussed previously, the first galactic property to examine is the presence of a galactic wind. All of the galaxies that show evidence for extended emission also have evidence for either a galactic wind or superbubble expansion out of the galaxy. Thus confirming the link between winds and the fate of ionizing radiation (e.g., Heckman et al., 2011). However, NGC 1705 and NGC 1482, the two galaxies that have the most clearly established winds, both appear optically thick. We note that both galaxies without extended emission, NGC 178 and NGC 7126, do not have galactic winds. Thus, as discussed in Heckman & Leitherer (1997), we see that while wind activity is important for the escape of Lyman continuum, other factors clearly play a determining role.
Another critical property to examine is star formation rate. Models predict that escaping ionizing radiation will be associated with extreme feedback from strongly star forming systems (e.g., Clarke & Oey, 2002; Wise & Cen, 2009; Paardekooper et al., 2011). From Table 3, it is immediately apparent that SFR(H) is not directly correlated with the optical depth of extended emission. The galaxy with the highest SFR, NGC 7126, is one that most clearly does not have extended optically thin emission. Furthermore, the galaxy with the second highest SFR, NGC 1482, is optically thick.
A more meaningful comparison is to look at the and the specific SFR. These measures of the SFR take into account the sizes and masses of the galaxies. A more massive galaxy would need a higher SFR to produce enough feedback for ionizing radiation to escape. Table 3 shows that NGC 178 and NGC 7126, which show no evidence for extended emission, do have low , which is consistent with our expectations. However, distinguishing between the galaxies that have optically thin and thick emission is more challenging. NGC 5253 has the highest , but NGG 3125 has lower than He 2-10, which is likely optically thick. One explanation is that the higher SFR in He 2-10 contains contamination from its AGN. However, the AGN in He 2-10 is not particularly luminous in H (Reines et al., 2011) making the significance of its contribution unclear. NGC 1705 has comparatively low . Paired with the lower of NGC 1482, the rates are consistent with the hypothesis that optical depth is correlated with . However, we cannot extrapolate any conclusions on trends with based only on our findings for these individual galaxies.
The comparison between sSFR is similarly fraught. NGC 5253 and NGC 3125 do have among the highest sSFR, but their sSFRs are not significantly higher than those of the galaxies with optically thick emission. Furthermore, NGC 178, which doesn’t have clear evidence for extended emission, has a rather high sSFR. Thus, our small sample supports previous work in its conclusion that strong SFR is necessary but not sufficient for significant (Heckman et al., 2001). We caution the reader that our sample is small, and the range of star-formation rates is also small. Therefore, our sample does not provide the leverage to firmly establish any apparent correlation between optical depth and or sSFR. As an additional consequence of the small sample size, the galaxies that seem anomalous, such as NGC 178 with its high sSFR but lack of extended emission and He 2-10, which is optically thick despite its high , may not be significant outliers.
In addition to SFR, the recent star formation history will have an influential role on the escape of ionizing radiation. As a stellar population ages, the rate of ionizing photons produced () decreases and the hardness of the radiation field softens. The ages of the clusters responsible for the ionization cones in both NGC 5253 and NGC 3125 are between 2-5 Myr old (Calzetti et al., 1997; Westera et al., 2004; Chandar et al., 2005; Raimann et al., 2000). In contrast with this, NGC 1705 is in a post-burst state (cluster ages Myr) in which most of the O stars in the main super star clusters have died off (Heckman & Leitherer, 1997). Thus, the softer and fainter B stars dominate the radiation field and do not provide enough ionizing radiation to allow for escape. This may similarly offer a partial explanation for the line ratios observed in He 2-10. While the main star forming region, embedded in the center of the galaxy, contains many young clusters with ages ranging from 2-20 Myr (Johnson et al., 2000), the second star-forming region, further towards the eastern edge of the galaxy is likely much older with fewer of its massive stars remaining. Furthermore, visual examination of the images of He 2-10 show closed bubbles, rather than fractured filaments (Figure 6). We note that for radiation fields dominated by late type stars, the relationship between the ionization parameter map and the optical depth is complicated. In these situations, a transition to [Sii] dominated gas does not necessarily indicate an optically thick nebula (Pellegrini et al., 2012). If the radiation field is soft but sufficiently strong, it is possible that not enough gas is present to absorb the lower energy photons, yet, the ionization parameter map still exhibits a transition zone to [Sii].
Furthermore, whether the population is a single burst or an extended burst also influences the fate of ionizing radiation. While feedback generates low density passageways in the ISM, simulations of superbubble evolution show that there is a delay between superbubble formation and the actual escape of ionizing radiation (Dove et al., 2000; Fujita et al., 2003). During the phase prior to superbubble break-out, ionizing radiation gets trapped by the bubble walls (Fujita et al., 2003). Once the bubble breaks out of the disk, ionizing radiation may escape relatively unhindered. However, by this point in time, the rate of ionizing photons produced by the massive star population is considerably weaker than in the first few Myr (Dove et al., 2000; Fujita et al., 2003). If the starburst occurs over a short duration, essentially a single burst, then it is less likely to leak significant ionizing radiation. If instead the burst is more extended, the later episodes of star formation can capitalize on the passageways carved by prior star forming episodes. Observationally, McQuinn et al. (2010) showed that extended bursts with typical timescales of hundreds of Myr are common in dwarf starbursts.
Our data further support this scenario. In NGC 5253, the current burst of star formation occurred within the last 3–5 Myr (Calzetti et al., 1997). While it is unlikely that any superbubbles formed from this epoch will have broken from the disk, there is evidence for prior star formation episodes with ages on the order of 10–100 Myr (Caldwell & Phillips, 1989). Thus, the ionization cone in NGC 5253 probably formed through low density regions cleared out by feedback from earlier episodes of star formation. In NGC 3125, the super star cluster at the base of the ionization cone has an age between 1–3 Myr, while the region surrounding it has an overall mean age of between 8–10 Myr (Westera et al., 2004; Chandar et al., 2005). While the initial episode of star formation in this burst is younger than that shown for NGC 5253, the dominant star formation is on the periphery of the galaxy, which makes it easier for ionizing radiation to escape (Gnedin et al., 2008). Furthermore, Raimann et al. (2000) stacked a sample of similar HII galaxies in which NGC 3125 was the dominant source and found that 65% of the stellar population is younger than 5 Myr, 32% is between 5 and 100 Myr, and the remaining 3% of the population us is older than 100 Myr. While the SFH analysis is not based solely on NGC 3125 it does point in the direction of NGC 3125 having multiple recent episodes of star formation.
The young ages of the ionizing populations in NGC 3125 and NGC 5253 may represent a special age range needed to find escaping ionizing radiation. In a recent paper, Jaskot & Oey (2013) study a sample of galaxies whose extremely high [Oiii]/[Oii] suggest that they are likely optically thin. These galaxies all have ionizing populations that are between 3-5 Myr (Jaskot & Oey, 2013), similar to the ages observed in galaxies with ionization cones studied in this work. Furthermore, the two local galaxies that have direct measurements, both have significant populations of young stars (Leitet et al., 2013, 2011).
Finally, it has been suggested that the mass of the galaxy is correlated with the escape fraction of ionizing radiation. There are some simulations that predict higher with larger galaxy mass (e.g., Gnedin et al., 2008). Others claim the opposite because the smaller galaxy’s weaker potential well would make escape easier (Yajima et al., 2011; Razoumov & Sommer-Larsen, 2010). Based on our small sample here, we do not find evidence for or against either claim. The two galaxies for which the extended ionized gas is optically thin have masses that are in the middle to low range of masses in the sample (Tables 1 and 3). Interesting to note, these two galaxies have significantly higher fractions of HI relative to the stellar mass of the galaxy (Table 3) than the sample galaxies with extended ionized gas. Meanwhile, NGC 5253 has an exceedingly low HI mass fraction, even when compared to the other galaxies with winds. This is consistent with the idea that the clearing, or consumption, of the neutral gas in the galaxy plays a role in regulating the escape of ionizing radiation.
5. Conclusions
The passage of ionizing radiation through, and possibly out of, a galaxy has ramifications on our understanding of cosmic reionization. In this paper, we study the extended, low surface brightness, emission-line gas of seven dwarf starburst galaxies. Using narrowband [Siii], [Sii], and H images and the technique of ionization parameter mapping, we evaluate the optical depth of the extended emission.
In two of the galaxies, we discover optically thin ionization cones extending along the minor axis. These cones suggest that ionizing radiation is escaping the main body of the galaxy. The narrow morphology suggests that ISM morphology is a critical determinant of whether ionizing photons will escape a galaxy. In three of the galaxies, we find that the established galactic winds are most likely optically thick. These galaxies, despite the presence of strong feedback do not show clear evidence for escaping ionizing radiation. The two remaining galaxies, despite the strong star formation show little evidence of extended emission.
Our most convincing examples of optically thin emission are found in narrow ionization cones. These narrow cones illustrate a scenario in which the covering fraction of Lyman continuum is significantly less than unity, as has been suggested by other work (e.g., Nestor et al., 2011). Furthermore, both cones are aligned with the minor axis of the galaxy, indicating a preferred direction. The small opening angle and preferred direction suggest that unless the galaxy orientation is such that the axis of escape aligns with the line of sight, it will be challenging to directly detect escaping radiation. If other starbursts are similar to NGC 3125 and NGC 5253, an orientation bias at least partially explains the low detection rate of ionizing radiation in starburst galaxies and LBGs.
In addition to observational biases, we explore the galactic properties that may regulate the escape of ionizing radiation. While galactic winds and bubble activity encourage escaping radiation, not all starbursts with galactic wind have escaping Lyman continuum. One explanation is that by the time the bubble or wind breaks out of the ISM, the ionizing population has aged and is no longer producing ionizing radiation as prodigiously (e.g., Dove et al., 2000; Fujita et al., 2003). Alternatively, the ionizing population is too young to have carved sufficient low-density paths out of the ISM for escape. This suggests an optimal age between 3-5 Myr for the escape of ionizing radiation. Based on the recent star-formation histories of NGC 3125 and NGC 5253, a starburst with a few recent star forming episodes strikes the balance between the time it takes for bubbles to burst and maximizing the number of ionizing photons produced that have clear passage out of the galaxy.
Another potential contributing factor is the concentration of star formation in the burst. In the examples of optically thin ionization cones, we see that they emanate from specific, concentrated star forming regions, rather than extended star-forming areas. In contrast, NGC 7126 shows no sign for feedback-driven extended emission, and has its copious star formation spread throughout the disk of the galaxy. This suggests that concentrated star formation will be more effective at clearing out the ISM. However, we must be careful in drawing strong conclusions from so few objects. He 2-10 and NGG 1705, which also have concentrated star formation, are most likely optically thick to ionizing radiation. Thus, while the concentration of star formation is important, the interplay between the star formation and the ISM morphology most likely regulates the escape of ionizing radiation from starbursts and Lyman break galaxies.
References
- Allen et al. (2008) Allen, M. G., Groves, B. A., Dopita, M. A., Sutherland, R. S., & Kewley, L. J. 2008, ApJS, 178, 20
- Allen et al. (1976) Allen, D. A., Wright, A. E., & Goss, W. M. 1976, MNRAS, 177, 91
- Aloisi et al. (2005) Aloisi, A., Heckman, T. M., Hoopes, C. G., et al. 2005, Starbursts: From 30 Doradus to Lyman Break Galaxies, 329, 2P
- Alton et al. (1994) Alton, P. B., Draper, P. W., Gledhill, T. M., et al. 1994, MNRAS, 270, 238
- Annibali et al. (2003) Annibali, F., Greggio, L., Tosi, M., Aloisi, A., & Leitherer, C. 2003, AJ, 126, 2752
- Annibali et al. (2009) Annibali, F., Tosi, M., Monelli, M., et al. 2009, AJ, 138, 169
- Atek et al. (2009) Atek, H., Kunth, D., Schaerer, D., Hayes, M., Deharveng, J.M., stlin, G., & Mas-Hesse, J.M., 2009, A&A, 506, L1
- Bell et al. (2003) Bell, E. F., McIntosh, D. H., Katz, N., & Weinberg, M. D. 2003, ApJS, 149, 289
- Benson et al. (2012) Benson, A., Venkatesan, A., & Shull, J. M. 2012, arXiv:1212.4452
- Bouwens et al. (2010) Bouwens, R. J., Illingworth, G. D., Oesch, P. A., et al. 2010, ApJ, 708, L69
- Bridge et al. (2010) Bridge, C. R., Teplitz, H. I., Siana, B., et al. 2010, ApJ, 720, 465
- Caldwell & Phillips (1989) Caldwell, N., & Phillips, M. M. 1989, ApJ, 338, 789
- Calzetti et al. (1997) Calzetti, D., Meurer, G. R., Bohlin, R. C., Garnett, D. R., Kinney, A. L., Leitherer, C., & Storchi-Bergmann, T. 1997, AJ, 114, 1834
- Calzetti et al. (1999) Calzetti, D., Conselice, C. J., Gallagher, J. S., III, & Kinney, A. L. 1999, AJ, 118, 797
- Calzetti et al. (2010) Calzetti, D., Wu, S.-Y., Hong, S., et al. 2010, ApJ, 714, 1256
- Cannon et al. (2006) Cannon, J. M., Smith, J.-D. T., Walter, F., et al. 2006, ApJ, 647, 293
- Chandar et al. (2005) Chandar, R., Leitherer, C., Tremonti, C. A., et al. 2005, ApJ, 628, 210
- Clarke & Oey (2002) Clarke, C., & Oey, M. S. 2002, MNRAS, 337, 1299
- de Vaucouleurs et al. (1991) de Vaucouleurs, G., de Vaucouleurs, A., Corwin, H. G., Jr., et al. 1991, Third Reference Catalogue of Bright Galaxies. Volume I: Explanations and references. Volume II: Data for galaxies between 0h and 12h. Volume III: Data for galaxies between 12h and 24h., by de Vaucouleurs, G.; de Vaucouleurs, A.; Corwin, H. G., Jr.; Buta, R. J.; Paturel, G.; Fouqué, P.. Springer, New York, NY (USA), 1991, 2091 p., ISBN 0-387-97552-7, Price US$ 198.00. ISBN 3-540-97552-7, Price DM 448.00. ISBN 0-387-97549-7 (Vol. I), ISBN 0-387-97550-0 (Vol. II), ISBN 0-387-97551-9 (Vol. III).,
- Dove et al. (2000) Dove, J. B., Shull, J. M., & Ferrara, A. 2000, ApJ, 531, 846
- Elson et al. (2013) Elson, E. C., de Blok, W. J. G., & Kraan-Korteweg, R. C. 2013, MNRAS, 429, 2550
- Fabbiano et al. (1992) Fabbiano, G., Kim, D.-W., & Trinchieri, G. 1992, ApJS, 80, 531
- Fan et al. (2001) Fan, X., Narayanan, V. K., Lupton, R. H., et al. 2001, AJ, 122, 2833
- Fan et al. (2006) Fan, X., Carilli, C. L., & Keating, B. 2006, ARA&A, 44, 415
- Fujita et al. (2003) Fujita, A., Martin, C. L., Mac Low, M.-M., & Abel, T. 2003, ApJ, 599, 50
- Gil de Paz et al. (2003) Gil de Paz, A., Madore, B. F., & Pevunova, O. 2003, ApJS, 147, 29
- Gnedin et al. (2008) Gnedin, N. Y., Kravtsov, A. V., & Chen, H.-W. 2008, ApJ, 672, 765
- Grier et al. (2011) Grier, C. J., Mathur, S., Ghosh, H., & Ferrarese, L. 2011, ApJ, 731, 60
- Grimes et al. (2009) Grimes, J. P., Heckman, T., Aloisi, A., et al. 2009, ApJS, 181, 272
- Fernandez & Shull (2011) Fernandez, E. R., & Shull, J. M. 2011, ApJ, 731, 20
- Hadfield & Crowther (2006) Hadfield, L. J., & Crowther, P. A. 2006, MNRAS, 368, 1822
- Hanish et al. (2010) Hanish, D. J., Oey, M. S., Rigby, J. R., de Mello, D. F., & Lee, J. C., ApJ, 725, 2029
- Hameed & Devereux (1999) Hameed, S., & Devereux, N. 1999, AJ, 118, 730
- Hamuy et al. (1994) Hamuy, M., Suntzeff, N. B., Heathcote, S. R., et al. 1994, PASP, 106, 566
- Heckman & Leitherer (1997) Heckman, T. M., & Leitherer, C. 1997, AJ, 114, 69
- Heckman et al. (2001) Heckman, T. M., Sembach, K. R., Meurer, G. R., et al. 2001, ApJ, 558, 56
- Heckman et al. (2011) Heckman, T. M., Borthakur, S., Overzier, R., et al. 2011, ApJ, 730, 5
- Ho & Filippenko (1996) Ho, L. C., & Filippenko, A. V. 1996, ApJ, 472, 600
- Ho et al. (2011) Ho, L. C., Li, Z.-Y., Barth, A. J., Seigar, M. S., & Peng, C. Y. 2011, ApJS, 197, 21
- Hota & Saikia (2005) Hota, A., & Saikia, D. J. 2005, MNRAS, 356, 998
- Iwata et al. (2009) Iwata, I., Inoue, A. K., Matsuda, Y., et al. 2009, ApJ, 692, 1287
- Jaskot & Oey (2013) Jaskot, A. E., & Oey, M. S. 2013, ApJ, 766, 91
- Johnson & Kobulnicky (2003) Johnson, K. E., & Kobulnicky, H. A. 2003, ApJ, 597, 923
- Johnson et al. (2003) Johnson, K. E., Indebetouw, R., & Pisano, D. J. 2003, AJ, 126, 101
- Johnson et al. (2000) Johnson, K. E., Leitherer, C., Vacca, W. D., & Conti, P. S. 2000, AJ, 120, 1273
- Kennicutt et al. (2011) Kennicutt, R. C., Calzetti, D., Aniano, G., et al. 2011, PASP, 123, 1347
- Kennicutt et al. (2009) Kennicutt, R. C., Jr., Hao, C.-N., Calzetti, D., et al. 2009, ApJ, 703, 1672
- Kennicutt et al. (2008) Kennicutt, R. C., Jr., Lee, J. C., Funes, S. J., José G., Sakai, S., & Akiyama, S. 2008, ApJS, 178, 247
- Kim et al. (2012) Kim, J.-h., Krumholz, M. R., Wise, J. H., et al. 2012, arXiv:1210.3361
- Kobulnicky et al. (1995) Kobulnicky, H. A., Dickey, J. M., Sargent, A. I., Hogg, D. E., & Conti, P. S. 1995, AJ, 110, 116
- Kobulnicky et al. (1999) Kobulnicky, H. A., Kennicutt, R. C., Jr., & Pizagno, J. L. 1999, ApJ, 514, 544
- Kreimeyer & Veilleux (2013) Kreimeyer, K., & Veilleux, S. 2013, arXiv:1306.5669
- Lee & Skillman (2004) Lee, H., & Skillman, E. D. 2004, ApJ, 614, 698
- Lee et al. (2009) Lee, J. C., Gil de Paz, A., Tremonti, C., et al. 2009, ApJ, 706, 599
- Leitherer et al. (1995) Leitherer, C., Ferguson, H. C., Heckman, T. M., & Lowenthal, J. D. 1995, ApJ, 454, L19
- Leitet et al. (2011) Leitet, E., Bergvall, N., Piskunov, N., & Andersson, B.-G. 2011, A&A, 532, A107
- Leitet et al. (2013) Leitet, E., Bergvall, N., Hayes, M., Linné, S., & Zackrisson, E. 2013, A&A, 553, A106
- Mac Low & McCray (1988) Mac Low, M.-M., & McCray, R. 1988, ApJ, 324, 776
- Madau et al. (1999) Madau, P., Haardt, F., & Rees, M. J. 1999, ApJ, 514, 648
- Marlowe et al. (1995) Marlowe, A. T., Heckman, T. M., Wyse, R. F. G., & Schommer, R. 1995, ApJ, 438, 563
- Martini et al. (2003) Martini, P., Regan, M. W., Mulchaey, J. S., & Pogge, R. W. 2003, ApJS, 146, 353
- McQuinn et al. (2010) McQuinn, K. B. W., Skillman, E. D., Cannon, J. M., et al. 2010, ApJ, 724, 49
- Meiksin (2005) Meiksin, A. 2005, MNRAS, 356, 596
- Melnick et al. (1985) Melnick, J., Moles, M., & Terlevich, R. 1985, A&A, 149, L24
- Mendez & Esteban (1997) Mendez, D. I., & Esteban, C. 1997, ApJ, 488, 652
- Méndez et al. (1999) Méndez, D. I., Esteban, C., Filipović , M. D., et al. 1999, A&A, 349, 801
- Meurer et al. (1992) Meurer, G. R., Freeman, K. C., Dopita, M. A., & Cacciari, C. 1992, AJ, 103, 60
- Meurer et al. (1998) Meurer, G. R., Staveley-Smith, L., & Killeen, N. E. B. 1998, MNRAS, 300, 705
- Meurer et al. (2006) Meurer, G. R., Hanish, D. J., Ferguson, H. C., et al. 2006, ApJS, 165, 307
- Moustakas et al. (2010) Moustakas, J., Kennicutt, R. C., Jr., Tremonti, C. A., et al. 2010, ApJS, 190, 233
- Murray et al. (2011) Murray, N., Ménard, B., & Thompson, T. A. 2011, ApJ, 735, 66
- Nestor et al. (2011) Nestor, D. B., Shapley, A. E., Steidel, C. C., & Siana, B. 2011, ApJ, 736, 18
- Nordgren et al. (1997) Nordgren, T. E., Chengalur, J. N., Salpeter, E. E., & Terzian, Y. 1997, AJ, 114, 913
- O’Connell et al. (1994) O’Connell, R. W., Gallagher, J. S., III, & Hunter, D. A. 1994, ApJ, 433, 65
- Oey et al. (2007) Oey, M. S., Meurer, G. R., Yelda, S., et al. 2007, ApJ, 661, 801
- Omar & Dwarakanath (2005) Omar, A., & Dwarakanath, K. S. 2005, Journal of Astrophysics and Astronomy, 26, 1
- Paardekooper et al. (2011) Paardekooper, J.-P., Pelupessy, F. I., Altay, G., & Kruip, C. J. H. 2011, A&A, 530, A87
- Pellegrini et al. (2012) Pellegrini, E. W., Oey, M. S., Winkler, P. F., et al. 2012, ApJ, 755, 40
- Rand (1998) Rand, R. J. 1998, ApJ, 501, 137
- Raimann et al. (2000) Raimann, D., Bica, E., Storchi-Bergmann, T., Melnick, J., & Schmitt, H. 2000, MNRAS, 314, 295
- Razoumov & Sommer-Larsen (2010) Razoumov, A. O., & Sommer-Larsen, J. 2010, ApJ, 710, 1239
- Reines et al. (2011) Reines, A. E., Sivakoff, G. R., Johnson, K. E., & Brogan, C. L. 2011, Nature, 470, 66
- Sakai et al. (2004) Sakai, S., Ferrarese, L., Kennicutt, Jr., R. C., & Saha, A. 2004, ApJ, 608, 42
- Sandage (1978) Sandage, A. 1978, AJ, 83, 904
- Sauvage et al. (1997) Sauvage, M., Thuan, T. X., & Lagage, P. O. 1997, A&A, 325, 98
- Schaerer et al. (1999) Schaerer, D., Contini, T., & Pindao, M. 1999, A&AS, 136, 35
- Shankar & Mathur (2007) Shankar, F., & Mathur, S. 2007, ApJ, 660, 1051
- Shapley et al. (2006) Shapley, A. E., Steidel, C. C., Pettini, M., Adelberger, K. L., & Erb, D. K. 2006, ApJ, 651, 688
- Sharp & Bland-Hawthorn (2010) Sharp, R. G., & Bland-Hawthorn, J. 2010, ApJ, 711, 818
- Shull et al. (2012) Shull, J. M., Harness, A., Trenti, M., & Smith, B. D. 2012, ApJ, 747, 100
- Siana et al. (2010) Siana, B., Teplitz, H. I., Ferguson, H. C., et al. 2010, ApJ, 723, 241
- Skrutskie et al. (2003) Skrutskie, M. F., Cutri, R. M., Stiening, R., et al. 2003, VizieR Online Data Catalog, 7233, 0
- Smith et al. (2002) Smith, L. J., Norris, R. P. F., & Crowther, P. A. 2002, MNRAS, 337, 1309
- Steidel et al. (2001) Steidel, C. C., Pettini, M., & Adelberger, K. L. 2001, ApJ, 546, 665
- Storchi-Bergmann et al. (1994) Storchi-Bergmann, T., Calzetti, D., & Kinney, A. L. 1994, ApJ, 429, 572
- Strickland et al. (2004) Strickland, D. K., Heckman, T. M., Colbert, E. J. M., Hoopes, C. G., & Weaver, K. A. 2004, ApJS, 151, 193
- Taylor et al. (2005) Taylor, V. A., Jansen, R. A., Windhorst, R. A., Odewahn, S. C., & Hibbard, J. E. 2005, ApJ, 630, 784
- Tosi et al. (2001) Tosi, M., Sabbi, E., Bellazzini, M., et al. 2001, AJ, 122, 1271
- Vacca & Conti (1992) Vacca, W. D., & Conti, P. S. 1992, ApJ, 401, 543
- Vagshette et al. (2012) Vagshette, N. D., Pandge, M. B., Pandey, S. K., & Patil, M. K. 2012, New A, 17, 524
- Vanzella et al. (2012) Vanzella, E., Guo, Y., Giavalisco, M., et al. 2012, ApJ, 751, 70
- Vanzi et al. (2011) Vanzi, L., Cresci, G., Sauvage, M., & Thompson, R. 2011, A&A, 534, A70
- Veilleux et al. (2010) Veilleux, S., Weiner, B. J., Rupke, D. S. N., et al. 2010, AJ, 139, 145
- Veilleux & Rupke (2002) Veilleux, S., & Rupke, D. S. 2002, ApJ, 565, L63
- Veilleux et al. (2003) Veilleux, S., Shopbell, P. L., Rupke, D. S., Bland-Hawthorn, J., & Cecil, G. 2003, AJ, 126, 2185
- Veilleux et al. (2005) Veilleux, S., Cecil, G., & Bland-Hawthorn, J. 2005, ARA&A, 43, 769
- Westera et al. (2004) Westera, P., Cuisinier, F., Telles, E., & Kehrig, C. 2004, A&A, 423, 133
- Wise & Cen (2009) Wise, J. H., & Cen, R. 2009, ApJ, 693, 984
- Yajima et al. (2011) Yajima, H., Choi, J.-H., & Nagamine, K. 2011, MNRAS, 412, 411
- Yajima et al. (2012) Yajima, H., Li, Y., Zhu, Q., et al. 2012, arXiv:1209.5842
- Zastrow et al. (2011) Zastrow, J., Oey, M. S., Veilleux, S., McDonald, M., & Martin, C. L. 2011, ApJ, 741, L17