TOWARDS A BETTER UNDERSTANDING OF THE DISTANCE SCALE FROM RR LYRAE VARIABLE STARS: A CASE STUDY FOR THE INNER HALO GLOBULAR CLUSTER NGC 672311affiliation: Partially based on observations made with telescopes operated by the SMARTS consortium.
Abstract
We present photometry for 54 variables in the metal-rich inner halo globular cluster NGC 6723. With the discovery of new RR Lyrae variables (RRLs), we obtain Pab = 0.541 0.066 and Pc = 0.292 0.030 day, n(c)/n(ab+c) = 0.167, and = 15.459 0.055. We carry out the Fourier decomposition analysis and obtain [Fe/H]ZW = 1.23 0.11 and = 0.063 0.015 for NGC 6723. By calibrating the zero-point from the recent absolute trigonometric parallax measurements for RR Lyr, we derive the revised -[Fe/H] relation, providing = 0.52 at [Fe/H] = 1.50 and = 18.54 for Large Magellanic Cloud (LMC), in excellent agreement with others. We obtain , equivalent to the distance from the Sun of 8.47 0.17 kpc, for NGC 6723 from various distance measurement methods using RRLs. We find that RRLs in NGC 6723 do not have magnitude dependency on the radial distance, due to a not severe degree of the apparent crowdedness. Finally, we show that there exists a relation between the degree of photometric contamination and the apparent crowdedness of the central region of globular cluster systems, . The use of this relation can play a significantly role on mitigating the discrepancy to establish a cosmic distance scale using RRLs in resolved stellar populations in the near-field cosmology.
1 INTRODUCTION
Understanding the formation and evolution of our Galaxy has always been one of the key quests in modern astrophysics for decades (e.g. Freeman & Bland-Hawthorn, 2002). Since RRLs are easily identifiable and they can provide a powerful means to probe the chemical compositions and dynamical properties of the old stellar populations, RRLs in the Galactic globular cluster (GC) systems or in the field are of particular importance to address the question of the early history of our Galaxy (see, for example, Smith, 1995). Also, being a primary distance indicator, the distance to RRLs can be accurately measured and RRLs can help to yield important insights into the structure of our Galaxy. Recent studies by Drake et al. (2013) or Pietrukowicz et al. (2012) are excellent examples of making use of RRLs to understand the substructures in the Galactic halo expected from the theory of the hierarchical structure formation, and to delineate the bar structure in the central part of our Galaxy.
With the advent of large aperture telescopes, the utility of RRL will increase further in the future in order to learn more about the early buildup of our Galaxy or nearby galaxies. For example, the Large Synoptic Survey Telescope (LSST) will be capable of detecting RRLs in the local group of galaxies out to 1 Mpc scale in several years of time span (Oluseyi et al., 2012), providing us wonderful opportunities to investigate the substructures of not only the outer halo in our Galaxy but also the nearby dwarf galaxies. Furthermore, the future 30- to 40-m class telescopes will have the capability of detecting RRLs in nearby groups of galaxies and the utility of RRLs not only as a primary distance indicator but also as an old stellar population tracer will become more important. In doing so, we need to calibrate the absolute dimensions of physical parameters of RRLs in our Galaxy using well understood samples of RRLs and then we can apply derived transformation relations of RRLs, such as a period-luminosity-metallicity relation, to establish a cosmic distance scale.
In recent years, the Fourier decomposition analysis of RRLs has become very popular, since this method can provide an efficient means to investigate fundamental stellar parameters, such as metallicity, absolute magnitude, intrinsic color, temperature, etc (see for example, Simon & Lee, 1981; Kovács & Jurcsik, 1996; Jurcsik, 1998; Kovács & Kanbur, 1998; Kovács & Walker, 1999, 2001; Kovács & Kupi, 2007). The practical application of Fourier parameters to characterize the RRLs in our Galaxy or in the Large Magellanic Cloud appears to be successful, but some worrisome signs also started to emerge lately. In their study of RRLs in the globular cluster M3, Cacciari et al. (2005) noticed that some fundamental physical parameters, such as the intrinsic color or the absolute visual magnitude, from Fourier or pulsational parameters do not agree with the observed ones.
Naturally, both the intrinsic color and the absolute visual magnitude of RRLs can affect the derived distance scale of RRLs. The uncertainty in the intrinsic color of RRLs can affect the foreground interstellar reddening value estimates and, subsequently, the distance scale of RRLs under consideration will be affected too, although defining a proper color of RRLs, especially that of RRab type variables with a large pulsational amplitude, is not a trivial task (e.g. Carney, Strom, & Jones, 1992). Achieving an accuracy of a 0.1 mag level for the absolute magnitude of RRLs is non-trivial and has been a difficult task for decades (Smith, 1995). Putting aside the discontinuity in the metallicity-luminosity relation of RRLs, = + [Fe/H], between the Oosterhoff I and II GCs seen in our Galaxy (Lee & Carney, 1999b), the zero-point in the above relation is poorly determined and is a major source of uncertainties in the distance measurement based on RRLs. Note that an uncertainty of 0.1 mag in the absolute magnitude results in a 5% error in the distance measurement. The recent results from the absolute trigonometric parallaxes of the five nearby RRLs using Fine Guidance Sensor (FGS) on Hubble Space Telescope (HST) prefer a brighter absolute visual magnitude level of RRL than those previously known, with = 0.45 0.05 at [Fe/H] = 1.50 dex111 It should be noted that the field RRLs also appear to show the Oosterhoff dichotomy, which is thought to be originated from the hierarchical formation of our Galaxy (Lee & Carney, 1999b). If we consider metallicity as a first approximation for the Oosterhoff classes of the field RRLs at the boundary of [Fe/H] 1.6 dex, XZ Cyg, UV Oct and RR Lyr correspond to the Oosterhoff group I while RZ Cep and SU Dra correspond to the Oosterhoff group II. (Benedict et al., 2011), which is 0.07 mag brighter than those from others, i.e. = 0.52 mag at [Fe/H] = 1.5 dex (e.g. see Walker, 2012; Cacciari, 2013, and references therein). Hence, if the recent measurement by Benedict et al. (2011) are true, the previous calibrations from the Fourier parameters or the theoretical horizontal-branch (HB) models based on the fainter absolute visual magnitude of RRL are in error. It would be very desirable to re-calibrate the zero-point in old transformation relations and to set up new distance scale of RRLs. It is expected that the zero-point of the absolute visual magnitude and the accuracy of the measurement will be dramatically improved with Gaia during the next decade (e.g. Cacciari, 2009).
This is the first of a series of papers addressing the distance scale from RRLs. In this paper, we present a high precision CCD photometry of RRLs in NGC 6723. Our main goal is to study the RRL population in NGC 6723 and scrutinize the distance scale from RRLs of the cluster by employing various methods. In section 2, we address the interesting aspects of the metal-rich inner halo GC NGC 6723. In section 3, data acquisition and data reductions are discussed, including our photometric calibration and the color-magnitude diagram (CMD). Section 4 describes the methods of period searching and the methods of searching for new variables. In section 5, we discuss the fundamental physical properties of RRLs from Fourier and pulsational parameters. In particular, we discuss the distance scale from RRLs in detail and we derive the new zero-point correction terms for the absolute visual magnitude of RRLs. In section 6, we show a relation between the degree of photometric contamination of RRLs and the apparent crowdedness of the GC systems. In the appendix, we discuss the evolutionary effect and the photometric contamination, such as blending, on the three RRLs in NGC 6723, V14, V15 and V16. We also show that two Sct variable stars and five W UMa type eclipsing binaries are off-cluster field stars based on the distance from the center of NGC 6723 and the true distance from the Sun.
2 THE METAL-RICH INNER HALO GC NGC 6723
NGC 6723 is an old metal-rich GC located 2.6 kpc from the Galactic center (Harris, 1996). It has long been thought that NGC 6723 is a genuine Galactic bulge GC owing to its rather high metallicity and its proximity to the Galactic center. For example, van den Bergh (1993) claimed that NGC 6723 is on a circular orbit about the Galactic center and it is a true resident of the central region of the Galaxy. However, by employing the absolute proper motion study of the cluster, Dinescu et al. (2003) showed that NGC 6723 has a highly inclined polar orbit. They suggested that the kinematics of NGC 6723 is more likely that of a halo object and is not likely a member of the rotationally supported system, although the bulge/disk/halo decomposition is not a trivial task in the central region of our Galaxy.
Nevertheless, several aspects still make NGC 6723 a very interesting metal-rich inner halo GC in investigating the formation of the Galactic inner halo: (i) It is metal-rich ([Fe/H] 1.2) and its metallicity is similar to (or slightly more metal-poor than) the mean metallicity of RRLs in the Baade’s Window (Walker & Terndrup, 1996; Kunder & Chaboyer, 2008; Pietrukowicz et al., 2012). (ii) It is very old (Fullton, 1995; Dotter et al., 2010). (iii) It is rich in the RRL population (Carney, Strom, & Jones, 1992). (iv) It suffers only small amount of foreground interstellar reddening, = 0.05 mag (Harris, 1996) and, therefore, is very suitable to investigate photometric parameters of RRLs. (v) Since NGC 6723 has been confined in the Galactic bulge (or the inner halo) region and never left the bulge (or the inner halo) due to lower total kinetic energy (Dinescu et al., 2003), NGC 6723 can play a role as the GC counterpart for the numerous field inner halo RRLs in Baade’s Window. Therefore, one may infer the formation epoch of the inner halo RRLs from that of NGC 6723, whose RRLs share common physical properties as the inner halo RRLs.
In spite of its importance, only a few studies have been done for the cluster. Menzies (1974) studied the variable star population in NGC 6723 and he presented light curves for 29 RRLs. He suggested that NGC 6723 has a heavily populated blue HB. Lee et al. (1994) also found that NGC 6723 has a rather blue HB morphology, 111, , and represent the numbers of blue HB stars, RRLs, and red HB stars, respectively. = 0.08 0.08, leading them to conclude that NGC 6723 is a very old GC. Rosenberg et al. (1999) carried out a homogenous photometry study of 34 GCs. They measured the magnitude difference between the turn-off (TO) and HB, , and reached the same conclusion that NGC 6723 is one the oldest GCs in our Galaxy. Various studies by others (Fullton, 1995; Fullton & Carney, 1996; Alcaíno et al., 1999; Dotter et al., 2010) using the model isochrone fitting method, for example, also showed that NGC 6723 has a very old age.
The previous metallicity measurements of NGC 6723 suggest that the metallicity of the cluster ranges from [Fe/H] 0.7 to 1.4. Smith (1981 and references therein) measured the metallicity of NGC 6723 using the method of five RRLs and he obtained [Fe/H] 0.7 on Butler’s abundance scale. Zinn & West (1984) derived [Fe/H] = 1.09 from the CMD morphology and the Q39 integrated light index. Later, Smith & Hesser (1986) obtained [Fe/H] = 1.14 from the DDO photometry system and Geisler (1986) obtained [Fe/H] = 1.35 from the Washington photometry system. Later, Fullton & Carney (1996) performed a high resolution spectroscopic study of three red-giant branch (RGB) stars and they obtained [Fe/H] = 1.26 0.09 for NGC 6723. They also found that NGC 6723 appears to have enhanced -elemental abundances, consistent with its old age. Rutledge, Hesser, & Stetson (1997) measured the metallicity of the cluster using the Ca II triplet lines of the RGB stars in near infrared passband and they obtained [Fe/H] = 1.12 0.07 on the Zinn & West’s abundance scale and 0.96 0.04 on the Carretta & Gratton’s abundance scale (Zinn & West, 1984; Carretta & Gratton, 1997).
3 OBSERVATIONS AND DATA REDUCTION
Our observations of the cluster were made with seven runs (29 nights in total) spanning nearly ten years, from August 2002 to July 2012, using the CTIO 0.9m and the CTIO 1.0m telescopes. The journal of observations is presented in Table 1. Also shown in the table are the number of observations per filter and per night. The CTIO 0.9m telescope was equipped with the Tektronix 2048 No. 3 CCD, providing a plate scale of 0.40 arcsec pixel-1 and a field of view of 13.5 13.5 arcmin. We used the CTIO 0.9m telescope for four runs in 2002, 2004 and 2012. The CTIO 1.0m telescope was equipped with an STA 4k4k CCD camera, providing a plate scale of 0.289 arcsec pixel-1 and a field of view of 20 20 arcmin. We used the CTIO 1.0m telescope for three runs in 2008, 2009 and 2010. The typical exposure times for the cluster were 300 s for Johnson -band and 200 s for -band filters for most runs. In total, we collected 383 frames in and 401 frames in .
The raw data were processed using the standard IRAF222IRAF (Image Reduction and Analysis Facility) is distributed by the National Optical Astronomy Observatories, which are operated by the Association of Universities for Research in Astronomy, Inc., under contract with the National Science Foundation. packages. The raw image frames were trimmed and bias-corrected. For 2002 and 2004 seasons, dome and sky flat images were applied to remove pixel to pixel variations and illumination corrections using sky flats were applied to eliminate the large scale structure. For other seasons, only sky flat images were applied.
Since both telescopes are equipped with an iris type shutter, the illumination across the CCD chips is not uniform and the shutter shading correction is non-trivial especially for short exposures. Therefore, we applied the shutter shading correction for science frames with less than 10 s exposure time. During the 2002 season, we obtained the series of dome flats with the exposure times of 1 s and 60 s using the CTIO 0.9m telescope. We normalized these two sets of dome flats and then we calculated the residual in the 60 s dome flats in the time unit and calculated shutter delay time across the CCD chip. The exposure time with the CTIO 0.9m telescope is 70 ms longer in the center than the upper-left or lower-right corners of the CCD chip and the shutter delay time is not uniform across the chip. For the CTIO 1.0m telescope, we also obtained shutter delay time correction images in each of three individual seasons. The shutter delay time for the CTIO 1.0m telescope is slightly shorter than that of the CTIO 0.9m telescope. The exposure time with the CTIO 1.0m telescope is 50 ms longer at the center of the CCD chip. We also found that the shutter delay time for the CTIO 1.0m telescope does not appear to have any temporal variations.
During August 2002, May 2004 and July 2012 seasons, we observed 26, 35 and 36 photometric standard stars from Landolt (1992, 2007, 2009). We selected stars with a wide range of colors and magnitudes. All standard frames were analyzed using the PHOTOMETRY task in DAOPHOTII, DAOGROW and CCDSTD (Stetson, 1990, 1993, 1995). In order to derive the transformation relations from the instrumental system to the standard system, we adopt the following equations:
| (1) | |||||
where is the airmass and , and () are the magnitudes and color on the standard system. In Figure 1, we show the residuals of and () in the sense Landolt (1992, 2007, 2009) minus our measurements and we show our transformation coefficients and residuals in magnitude and color in Table 2.
Point-spread function (PSF) photometry for all NGC 6723 science frames was performed using DAOPHOTII-ALLSTAR, ALLFRAME, COLLECT-CCDAVE-NEWTRIAL packages (Stetson, 1987, 1993, 1994, 1995; Turner, 1995). To achieve good PSFs on individual science frames, we used about 100 to 250 isolated bright stars, depending on the seeing conditions and exposure times, and at least three iterations were required to remove neighboring stars from our PSF stars. For the PSF calculation, we adopted a quadratically variable PSF for most cases. The total number of stars measured from our ALLFRAME run was more than 31,000 and our final CMD is shown in Figure 2.
Finally, astrometric solutions for individual stars in our field have been derived using the positional data extracted from the Naval Observatory Merged Astrometric Dataset (NOMAD, Zachairias et al., 2004). We achieved rms scatter in the residuals of 0.05 arcsec using the IRAF IMCOORS package. Then the astrometric fit was applied to calculate the equatorial coordinates for all stars measured in our science frames.
4 RR LYRAE VARIABLES
4.1 Periods and light curves
Menzies (1974) and Clement et al. (2001) list 32 variables in NGC 6723: 29 RRLs, two red variables and one variable. We used the finding charts provided by Menzies (1974) to identify those variables. Then we used his periods to estimate the photometric phases for our list of new standard and magnitudes and Heliocentric Julian Day (HJD), and drew light curves for each variable star. For all variables, the light curves showed phase shifts in their maxima or minima indicating that period adjustments were needed. Therefore, we determined new ephemerides and periods for the 29 previously known RRLs. To determine the periods, we used three methods: the string-length method (Lafler & Kinman, 1965), the phase dispersion minimization method (Stellingwerf, 1978), and the information entropy minimization method (Cincotta et al., 1995). In all cases, the periods were determined from both and data. In Figure 6, we show new light curves for previously known RRLs (Menzies, 1974; Clement et al., 2001). In Table 3, we show positions, new periods, pulsational amplitudes in and bandpasses and mean magnitudes for individual variable stars. In the table, and denote magnitude-weighted integrated magnitudes and and denote intensity-weighted integrated magnitudes of variables. For the RRLs, we also provide static mean magnitudes and colors as defined by Marconi et al. (2003);
| (2) | |||||
| (3) |
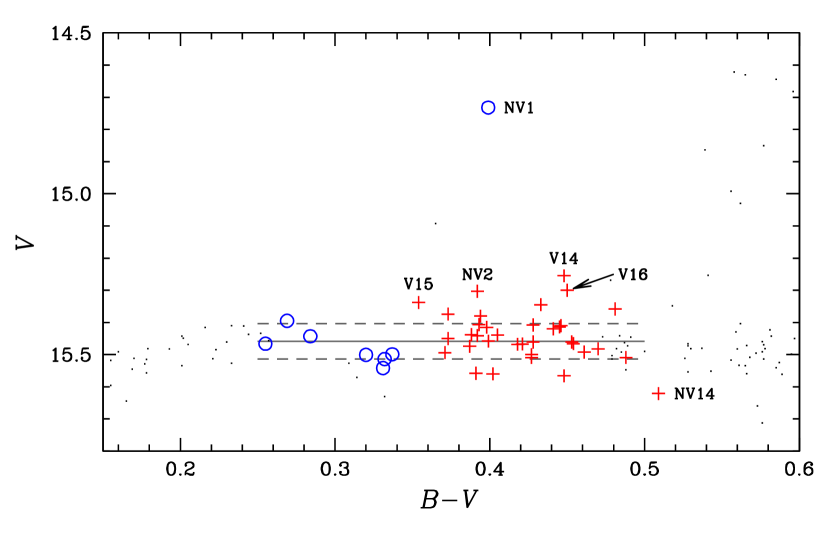
In Figure 7, we show the CMD of the HB region of NGC 6723. For RRLs, we adopted magnitude-weighted integrated colors, , and the intensity-weighted integrated magnitudes, . It should be noted that the results derived from Fourier parameters presented in Section 5 are for and . Since the energy generated by nuclear reaction inside the variable star is unaffected by the pulsation of the variable star, the should be the same as would be observed were the star not pulsating (Smith, 1995).
It is known that the gives the closest approximation to the color-temperature relation of the “equivalent static star” (Sandage, 1990). However, a caution should be advised on the average color of RRLs, in particular that of RRab type variable stars with large pulsational amplitude. As noted by Carney, Strom, & Jones (1992), either or (and ) do not represent the correct temperature measure for the RRLs due to excess emission in the passband during the rise from minimum to maximum radius. In Figure 8, we show comparisons of integrated colors of RRLs in NGC 6723. In the Figure, we show differences in colors, and , as functions of and the blue amplitude, . As can be seen in the Figure, the differences in color between different color systems are very small, 0.01 mag, for RRc type variable stars with symmetric sinusoidal light curves. However, the difference in color can be as large as 0.07 mag for RRab type variable stars with asymmetric light curves with large values. Figure 8 (b) and (d) suggest that the difference in the color of RRLs is closely correlated with the blue amplitude , in the sense that as the blue amplitude increases the discrepancy between different color systems increases.
4.2 New variables
Recent CCD photometry surveys of GCs reveal many new variables, especially RRLs with low amplitudes or in the crowded central part of GCs and we attempt to search for new variables in NGC 6723 following the method similar to Lee & Carney (1999a).
We collected PSF magnitudes for about 460 variable candidates returned from NEWTRIAL based on the variability index and calculated magnitude variations as a function of the HJD. We then calculated light curves of each variable candidate with the best estimated period. We employed the information entropy minimization method with an 88 grid size and the string-length method for this purpose.
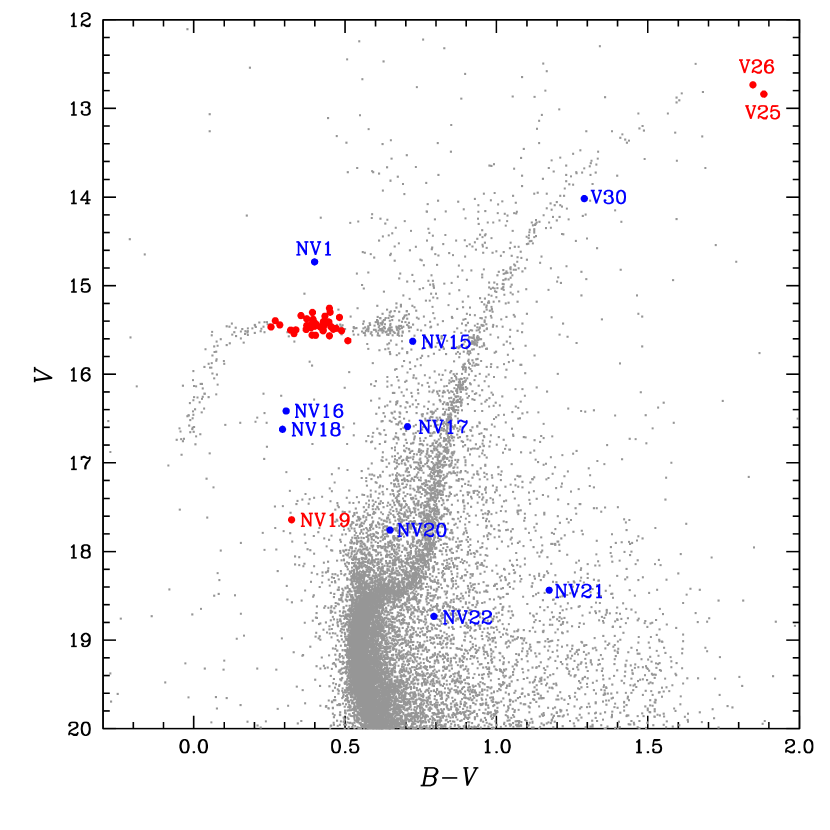
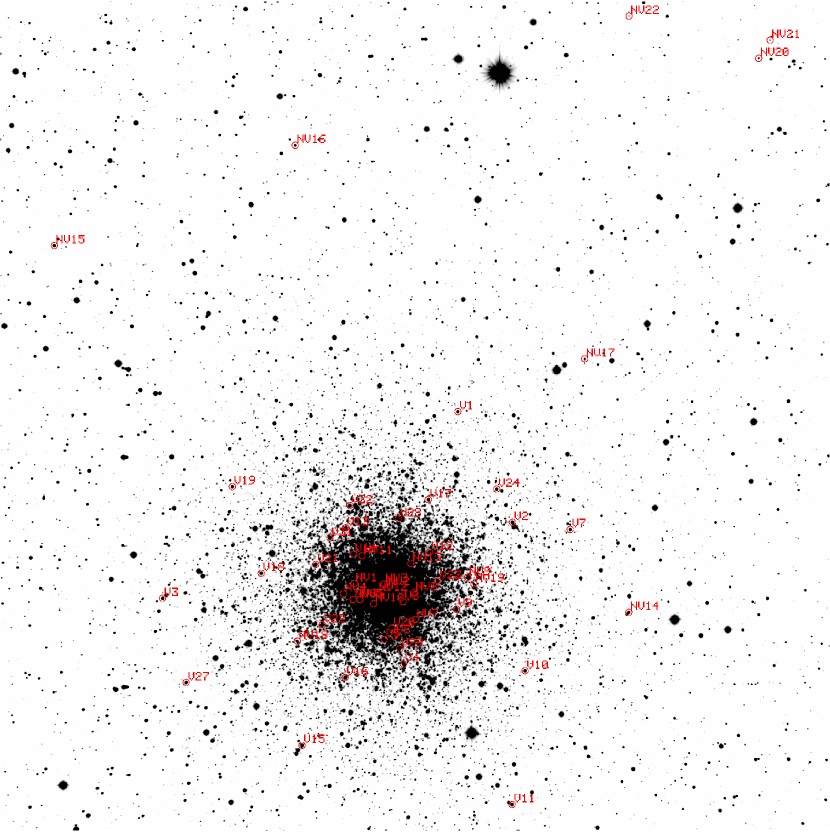
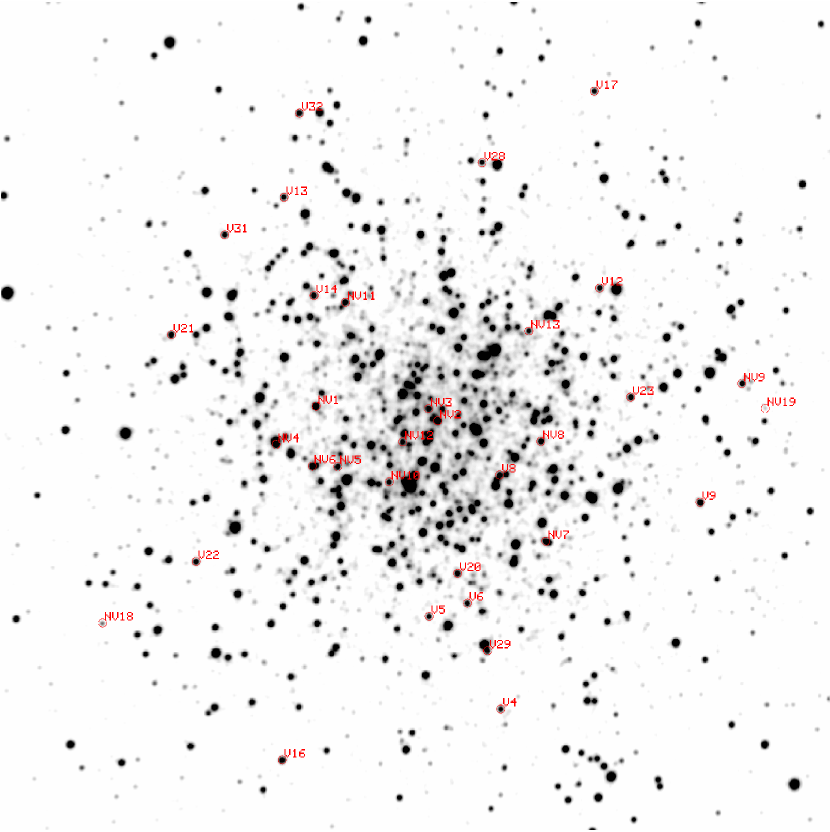
Visual examinations of plots of magnitude variations against the HJD and the phase-folded light curves for all variable candidate stars revealed 22 new variables; 14 RRLs, one SX Phe type and two Scuti type variable stars and five W UMa type eclipsing binaries. We also “rediscovered” all 29 previously known RRLs. Positions and photometric parameters for new variables are presented in Table 3 and light curves for the new variables are shown in Figure 9. As expected, most of the newly found variables lie near the central part of the cluster. Identification charts for the new variables are presented in Figures 10 and 11 for the outer (with a field of view of 15 15 arcmin) and inner part (4 4 arcmin) of the cluster, respectively. We also marked the previously known RRLs in the figures. Note that all new RRLs lie within the tidal radius of NGC 6723.
In an attempt to confirm the membership of the new RRLs, we examined the CMD near the HB region (see Figure 7) and the period-amplitude diagram (see Figure 12), since there is no previous proper motion study or radial velocity measurements are available for the new variables.
As shown in Figure 7, the RRc type variable NV1 appears to be too bright to be a regular RRc type variable star of NGC 6723. The average intensity-weighted integrated magnitude of the remaining seven RRc type variables including NV7 and NV11 is 15.480 0.019 mag and NV1 is 0.748 mag brighter than the mean magnitude. However, it should be noted that NV1 is located within the core radius of the cluster222The radial distance of NV1 is 36 arcsec from the center of the cluster and the core radius of the cluster is 56.4 arcsec (Harris, 1996). and its photometric metallicity, [Fe/H] = 1.28 dex, from the Fourier analysis presented in section 5.2 is consistent with the mean metallicity of the cluster, [Fe/H] 1.2 dex.333As discussed above, the Galactic bulge RRLs are slightly more metal-rich than NGC 6723 is. Therefore, metallicity alone may not be a proper indicator to distinguish the cluster member star.
It is suspected that NV1 may be a member of a binary system. We attempted to find out the secondary periodicity for NV1 using pre-whitened data but we failed to get any reliable secondary period of the variable. Since it lies about 36 arcsec from the center of the cluster, it may suffer from blending effect with nearby bright stars. We visually examined the point-spread function of NV1 in individual science frames and found no sign of blending. We also found no evidence of blending for NV1 from the images taken with the HST Advanced Camera for Surveys (ACS) by Sarajedini et al. (2007) which were retrieved via the Mikulski Archive for Space Telescopes (MAST)444STScI is operated by the Association of Universities for Research in Astronomy, Inc., under NASA contract NAS5–26555. Support for MAST for non-HST data is provided by the NASA Office of Space Science via grant NNX09AF08G and by other grants and contracts., leading us to believe that NV1 is most likely a non-member of the cluster and is most likely a foreground RRc type variable. However, follow-up monitoring of NV1 in the future would be desirable to reveal the potential binary nature of NV1.
The RRab type variable NV14 is slightly fainter and redder than the rest of RRab type variables of the cluster. However, the radial distance of NV14 from the center of the cluster is 264 arcsec and NV14 lies well within the tidal radius of the cluster, 630 arcsec. NV14 is in good agreement with other RRab type variable stars in NGC 6723 on the period-amplitude diagram in Figure 12, and on the Wesenheit function-period diagram in Figure 13. Also other physical parameters of NV14, such as metallicity, derived from the Fourier analysis do not disagree with those from other variable stars. This leads us to believe that NV14 is a cluster member with an excess differential foreground reddening effect by 0.03 mag.
In appendix, we present the membership status of other types of new variable stars in NGC 6723. The SX Phe type variable star NV19 is most likely a cluster member star while the two Sct type variable stars, NV16 and NV18, and the five W UMa type eclipsing binaries NV15, NV17, NV20, NV21 and NV22 do not appear to be cluster members, based on the radial distance from the center of the cluster and the true distance modulus.
With the discovery of new variables, the new mean periods of RRab and RRc variables are Pab = 0.541 0.066 day (35 stars) and Pc = 0.292 0.030 day (7 stars without NV1), respectively. The errors are those of the mean. The new RRL distribution is n(c)/n(ab+c) = 0.167. Our mean periods are in good agreement with those of Menzies (1974), who obtained 0.540 day and 0.291 day for Pab and Pc, respectively. However, our new n(c)/n(ab+c) value is slightly smaller than that of Menzies, n(c)/n(ab+c) = 0.172.
5 THE FOURIER ANALYSIS
During the last two decades, Fourier decomposition methods have been successfully applied to characterize the RRLs and other types of variables (see for example, Simon & Lee, 1981; Kovács & Jurcsik, 1996; Jurcsik, 1998; Kovács & Walker, 1999, 2001; Cacciari et al., 2005). We performed the Fourier analysis and derived Fourier coefficients and relevant physical parameters of the variables from the new photometry of the cluster. For our analysis, we used the FORTRAN programs kindly provided by Dr. Kovács.
5.1 Fourier Coefficients
Fourier coefficients of RRLs in NGC 6723 were derived for the band photometry by assuming that the variations in the observed magnitude can be reproduced by a Fourier sine series;
| (4) |
where = 2 is the angular frequency, is the epoch of observations, and the and are the Fourier coefficients. We reconstructed artificial light curves using the derived Fourier coefficients for each variable. Each artificial light curve was visually inspected by comparing it to the observed data. We show the Fourier coefficients for RRLs in Table 4, where , and ().
5.2 The Metallicity
Jurcsik & Kovác (1996) derived an empirical relation to estimate metallicity of RRab type variables from the Fourier parameters,
| (5) |
To apply this relation, Jurcsik & Kovác (1996) and Kovács & Kanbur (1998) introduced the deviation parameter to measure relative accuracy of the prediction, where is the observed parameter, is the calculated value from the other observed parameters, is the respective standard deviation in their Table 6 (see also Kovács & Kanbur, 1998). The compatibility condition parameter , which is defined to be the maximum of the deviation parameters , represents a compatibility test on the regularity of the shape of the light curves. Jurcsik & Kovác (1996) suggested that physical parameters, such as metallicity, of RRab type from the Fourier decomposition can be securely applicable if 3. In the last column of Table 4, we show deviation parameters for all RRab variables in NGC 6723 based on Jurcsik & Kovác (1996). It should be noted that V13, V18, NV2, NV3, NV5 and NV13 appear to be Blazhko variables in their light curves as shown in Figures 6 and 9, but their values are less than 3, suggesting that the compatibility condition may not be reliable. Cacciari et al. (2005) also found that the compatibility condition by Jurcsik & Kovác (1996), i.e. 3, may not be suitable to differentiate Blazhko variables. They noted that they detected as much as 40% of Blazhko variables with 3 and 60% with 5.
Using the original relation by Jurcsik & Kovác (1996), we obtained a mean metallicity of [Fe/H]JK96 = 0.93 0.22 dex from all 18 RRab type variable stars and 0.94 0.12 dex from the 10 regular RRab variable stars555 We do not use Blazhko variables V13, V18, NV2, NV3, NV5, NV13 and NV14 in our calculations. In addition to these, we do not include V14, which appear to suffer from blending effect with nearby faint companions. See Appendix A. for NGC 6723. To calculate more widely used metallicity scales for GC systems by Zinn & West (1984), we used the transformation relation given by Jurcsik (1995),
| (6) |
and we obtained [Fe/H]ZW = 1.27 0.09 dex from 10 RRab type variable stars in NGC 6723. We show the metallicity of each variable in column (2) of Table 5.
We also used an empirical relation given by Morgan, Wahl, & Wieckhorst (2007) to obtain Zinn & West metallicity scale for RRc type variables,
| (7) | |||||
where is the phase for cosine series. This cosine phase was transformed from our sine series phase using the following relation, , where is the modulus operator, and therefore, . We obtained [Fe/H]ZW = 1.18 0.15 dex for all 7 RRc variable stars and 1.18 0.20 dex for 4 regular RRc variable, consistent with that from RRab type variables of the cluster. We show our results for RRc type variable stars in Table 6.
The unweighted mean of the photometric metallicity of NGC 6723 in the Zinn & West metallicity scale becomes [Fe/H] = 1.23 0.11 dex. We conclude that our metallicity from the Fourier analysis of RRLs of NGC 6723 is in excellent agreement with that of Fullton & Carney (1996), who obtained [Fe/H] = 1.26 0.09 using high resolution spectroscopic abundance study of the three red-giant branch stars in the cluster.
5.3 Intrinsic Color of RRab type Variable Stars and Interstellar Reddening
The interstellar reddening values of GCs are of great interest since, for example, they affect the derived photometric temperature or metallicity from the observed color, the true distance modulus, etc. The previous estimates of interstellar reddening values of NGC 6723 range from 0.0 (Menzies, 1974) to 0.11 (Alcaíno et al., 1999). We explore the interstellar reddening by comparing the observed colors and intrinsic colors of RRLs in NGC 6723.
We calculated the intrinsic color of RRab type variables using the empirical relations given by Jurcsik (1998),
| (8) |
and by Kovács & Walker (2001),
| (9) |
Note that the above relations are for and these relations are based on the same program. Not surprisingly, the intrinsic colors of individual variable stars from both relations [Equations (8) and (9)] are in excellent agreement to within 0.002 0.004 and we show average of RRab type variable stars in column (3) of Table 5. In column (4) of the table, we also show our interstellar reddening estimates for each variable by comparing the intrinsic color with the observed magnitude-weighted integrated color of RRab type variables. For the mean interstellar reddening value of NGC 6723, we obtained = 0.087 0.014 mag from all 18 RRab type variable stars and 0.086 0.007 mag from 10 regular RRab type variable stars .
We also make use of an empirical period-amplitude-color-metallicity relation given by Piersimoni, Bono, & Ripepi (2002),
| (10) |
assuming [Fe/H] = 1.23 dex for NGC 6723 and we obtained = 0.089 0.013 for 35 RRab stars and = 0.086 0.010 for 23 regular RRab type variable stars in NGC 6723.
The interstellar reddening values from Equations (8), (9) and (10) are in good agreement with the mean value of = 0.086 0.017. Note that our mean interstellar reddening estimate appears to be slightly larger than the previous interstellar reddening value666Schlegel et al. (1998) have provided tools to estimate total reddening along essentially any line of sight, which should reflect the total reddening to the cluster. Their result is = 0.16 mag for the cluster and it is about three times larger than that of Harris (1996). Dutra & Bica (2000) noted that interstellar reddening estimates by Schlegel et al. (1998) for clusters near the Galactic plane appear to be larger than those based on stellar contents, possibly due to background dust. Arce & Goodman (1998) have cautioned their readers that Schlegel et al. (1998) may over-estimate reddening by a factor of 1.3 to 1.5 in regions with or so. Our results appear to confirm these cautionary remarks about the use of the Schlegel et al. (1998) reddening maps in regions of high reddening (see also Lee et al., 2001; Lee & Carney, 2006). by Harris (1996), = 0.05 but smaller than that of Alcaíno et al. (1999), who obtained = 0.11 0.01 based on photometry of the cluster.
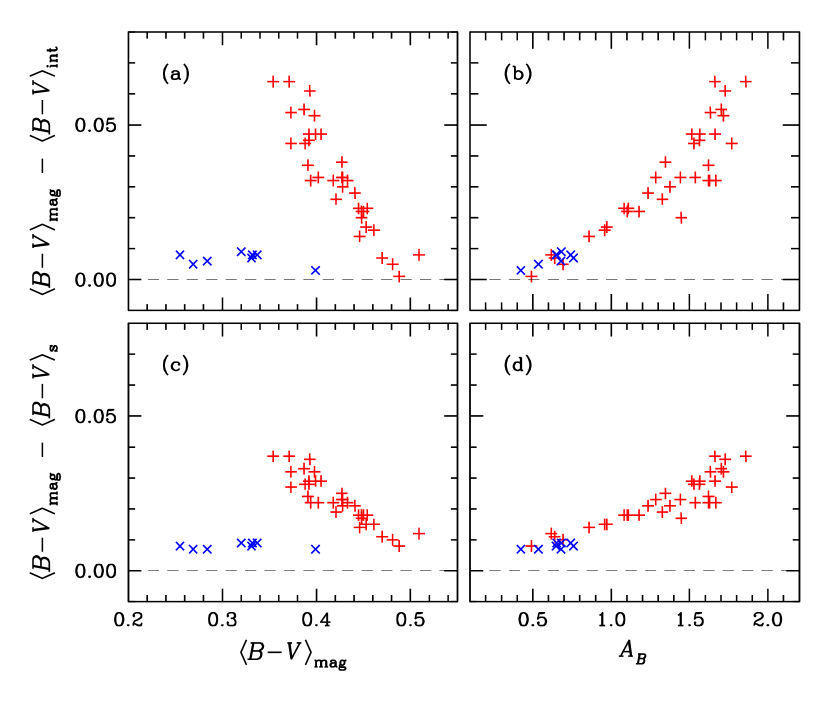
It should be noted that the calculated intrinsic colors of RRab type variable stars from Equations (8) – (10) have a significant gradient against the observed colors of RRab variables and weak gradients against periods and blue amplitudes , suggesting that Equations (8) – (10) are slightly wrong. In Figure 14 (a), we show the calculated intrinsic color of individual RRab type variable stars using Equations (8) – (10) as a function of the observed and we obtained the following relation,
| (11) |
The slope of this relation is not unity and, as a consequence, [ = ] has a substantial gradient against the observed color as shown in Figure 14 (b). Our result strongly suggests that the intrinsic color estimation for RRab type stars from the Fourier analysis or the pulsational properties fails to work. We propose that the previous empirical relations to derive the intrinsic color of RRab type variables using their pulsational parameters, such as Equations (8) – (10), should be re-examined in the future.
In their study of RRLs in M3, Cacciari et al. (2005) also found that there existed significant discrepancies between the intrinsic colors derived from Fourier parameters and the observed ones. They found that the distribution of the intrinsic colors derived from Fourier parameters using the transformation relation by Kovács & Walker (1999) is somewhat compressed and slightly blue-shifted with respect to the observe distribution. The narrowness of the range of their calculated intrinsic color can be naturally understood if our derived relation between the calculated and the observed [Equation (11)] is still valid for M3 RRLs.
As stated above, Equations (8) and (9) are for but we also investigate the interstellar reddening value from , i.e. = . We obtained the mean interstellar reddening value of = 0.064 0.021 from 18 RRab type variables and = 0.061 0.014 from 10 regular RRab type variables. We show our results in the column (5) of Table 5. Note that this value is in good agreement with that of Harris (1996). However, as can be seen in the relation between the observed and the calculated in Equation (11), the slope of the relation between the observed and the calculated deviates significantly from unity [see Figure 14 (c) and (d)]. We obtained the following relation;
| (12) |
Recently Dotter et al. (2010) presented interstellar reddening values of about 60 GCs in the HST ACS photometric system, , using isochrone fitting and they presented values for individual GCs in their Table 2. We compared by Dotter et al. (2010) to by Harris (1996) for 61 GCs and we obtained the following transformation relation,
| (13) |
For NGC 6723, Dotter et al. (2010) obtained = 0.073 and their value is equivalent to = 0.065 0.027. This result is in excellent agreement with our interstellar reddening estimate from the static color of RRab variables of the cluster, = 0.061 0.014, and is in agreement with that from , = 0.087 0.014, within measurement errors.
For the foreground interstellar reddening value of NGC 6723, we adopt the unweighted mean of those from the static color of RRLs and from the isochrone fitting by Dotter et al. (2010), = 0.063 0.015.
5.4 The visual magnitude of RR Lyrae variables
The average intensity-weighted integrated magnitude of the 7 RRc and 30 RRab type variables (excluding V14, V15, V16, NV1, NV2 and NV14)777In Appendix A, we discuss that V16 is a more evolved RRab type variable while V15 suffers from blending with nearby faint objects. V14 appears to suffer both effects. in NGC 6723 is = 15.459 0.055 mag. Our new is in good agreement with magnitudes by Menzies (1974), Fullton (1995) and Rosenberg et al. (1999), = 15.48, 15.47 0.02, and 15.45 0.05, respectively. It should be noted that our magnitude is not for the zero-age HB (ZAHB) but includes RRLs evolved away from the ZAHB as shown in Figure 7. Therefore, the maximum of regular RRLs of NGC 6723, which is = 15.514 mag for V7, should be close to the ZAHB.
5.5 The absolute visual magnitude of RR Lyrae variables
5.5.1 Old calibrations based on the fainter
Jurcsik (1998) provided an empirical relation to calculate the absolute visual magnitude of RRab type variables employing Fourier parameters,
| (14) |
Using this relation, we obtained an average absolute visual magnitude = 0.854 0.029 mag from 18 RRab type variables and = 0.852 0.020 mag from 10 regular RRab type variables in NGC 6723. We show the absolute visual magnitude for each star in column (6) of Table 5.
To estimate the absolute visual magnitude of RRc type variables, we used the relation given by Kovács (1998),
| (15) |
We obtained = 0.809 0.053 mag for the seven RRc type variables and = 0.820 0.021 mag for the four regular RRc type variables in NGC 6723. The absolute magnitudes of each variable star are listed in Table 6. The average absolute visual magnitude from the four regular RRc type variables is 0.032 mag brighter than that from 10 regular RRab type variables in NGC 6723 but both absolute magnitude scales are in good agreement within the errors. The combined absolute visual magnitude of NGC 6723 becomes = 0.843 0.025 mag from 10 regular RRab and four regular RRc variable stars.
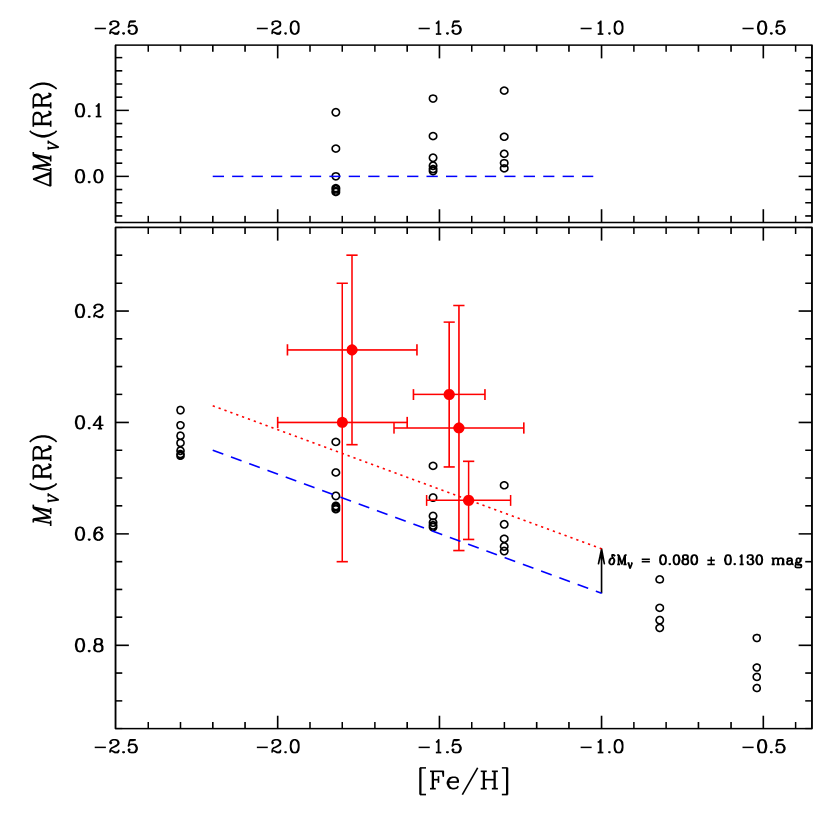
As a consistency check, we compare our for NGC 6723 derived from Fourier parameters with the recent estimates of . As nicely summarized by Cacciari (2013), recent theoretical or empirical versus [Fe/H] relations prefer = 0.52 mag at [Fe/H] = 1.50 dex. As a consequence, at [Fe/H] = 1.23 dex (i.e. the metallicity of NGC 6723) should be 0.578 mag or 0.588 mag depending on the slope of the versus [Fe/H] relation, 0.214 or 0.250, respectively. Our for NGC 6723 from Equation (14) or (15) is about 0.26 mag fainter than the current standard value.
Cacciari et al. (2005) also found that the derived absolute visual magnitude of RRLs from Fourier parameters is somewhat faint and they used the empirical relation by Kovács (1998) [Equation (15)] to derive RRc type variable stars in M3, with a brighter zero point by 0.2 mag [i.e. from 1.261 to 1.061 in their Equation (16)].
5.5.2 Is RR Lyrae an evolved star?
Recently, Benedict et al. (2011) measured absolute trigonometric parallaxes and proper motions of five nearby RRLs using the HST FGS. They presented the absolute visual magnitude of RRLs as a function of metallicity,
| (16) |
The metallicity-luminosity relation by Benedict et al. (2011) gives = 0.45 mag at [Fe/H] = 1.50 dex, which is about 0.07 mag brighter than those from others (see for examples Federici et al., 2012; Cacciari, 2013; Kollmeier et al., 2013). Although Benedict et al. (2011) claimed that their relation gives the absolute visual distance modulus of LMC of = 18.55 0.05 mag, the zero-point of Benedict et al. (2011), 0.45 0.05 mag, and the dereddened mean visual magnitude of RRLs in LMC by Clementini et al. (2003), 19.064 0.064 mag at [Fe/H] = 1.50 dex, can be translated into = 18.61 0.08 mag for LMC, significantly larger than those from other methods (Walker, 2012; Cacciari, 2013).
As kindly noted by the referee, the evolutionary status of RRLs studied by Benedict et al. (2011) does not appear to be well established. Fernley et al. (1998) suspected that SU Dra is likely an evolved RRL. More recently Catelan & Cortés (2008) claimed that RR Lyr is indeed an evolved RRL. They performed a careful study of the star using Strömgren photometry and they claimed that RR Lyr is overluminous by 0.06 mag for its metallicity. In their Equation (4a), Catelan & Cortés (2008) provided the following metallicity-luminosity relation;
Using this relation, one can find = 0.64 mag at [Fe/H] = 1.50 dex, which is 0.12 mag fainter than the current standard value, 0.52 mag. It should be noted that the result by Catelan & Cortés (2008) is based on the theoretical HB models by Catelan, Pritzl, & Smith (2004), whose RRL magnitude levels are 0.08 mag fainter than those from other works (for example, see Table 1 of Cacciari, 2013). At [Fe/H] = 1.50 dex in the Zinn-West metallicity scale, the theoretical models by Catelan, Pritzl, & Smith (2004) predicts = 0.60 mag and their models are 0.08 mag fainter than the current standard value, = 0.52 mag.
It is suspected that if one can make the zero-point of the theoretical models of Catelan, Pritzl, & Smith (2004) 0.08 mag brighter, then RR Lyr could have been thought as a normal RRL near the ZAHB.
Among 5 RRLs studied by Benedict et al. (2011), RR Lyr is of particular importance at least for two reasons. First, RR Lyr is the nearest RRL in their sample. Their absolute trigonometric parallax of RR Lyr using the HST is = 3.77 0.13 mas, equivalent to = 0.54 0.07 mag. Second, the duration of their HST observations of RR Lyr is over 13 years and they claimed that their parallax measurement for RR Lyr has been significantly improved compared to their previous study of the star (Benedict et al., 2002), = 3.82 0.2 mas (equivalent to = 0.61 0.10 mag). If we take their new absolute magnitude ( = 0.54 0.07 mag), the metallicity of RR Lyr ([Fe/H] = 1.41 0.13 dex) and the slope in the -[Fe/H] relation by Clementini et al. (2003) or Benedict et al. (2011) (0.214 0.047), the absoulte visual magnitude of RRLs becomes = 0.52 0.13 mag888The error in is dominated by the uncertainty in the metallicity measurement of RR Lyr, 0.13 dex. at [Fe/H] = 1.50 dex. This zero-point is in excellent agreement with the current standard value adopted by others. Therefore, Equation (16) can be re-written as
| (17) |
Our revised metallicity-luminosity relation for RRLs gives = 18.54 0.13 mag for LMC, if we use = 19.064 0.064 at [Fe/H] = 1.50 for RRLs in LMC by Clementini et al. (2003).
5.5.3 from Fourier parameters
Using the same method by Kinman (2002), we re-derive the of NGC 6723. Kinman (2002) used RR Lyrae and the empirical transformation relation by Kovács & Walker (2001),
| (18) |
where is a zero-point constant which should be determined. Using = 0.566837 day, = 0.31539 mag, = 0.09768 mag and = 0.61 0.10 of Benedict et al. (2002), Kinman (2002) obtained = 0.43.
As discussed above, the absolute magnitude of RR Lyr from Benedict et al. (2002) is 0.07 mag fainter than that of Benedict et al. (2011). Using the same , , values, but = 0.54 0.07 of Benedict et al. (2011) for RR Lyr, we obtained = 0.36.
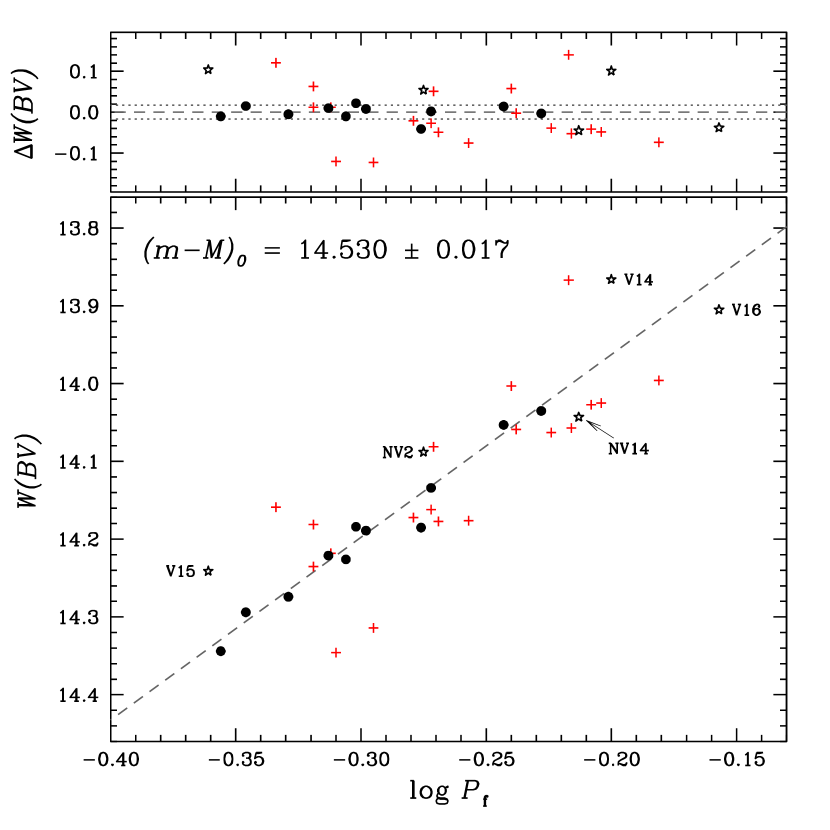
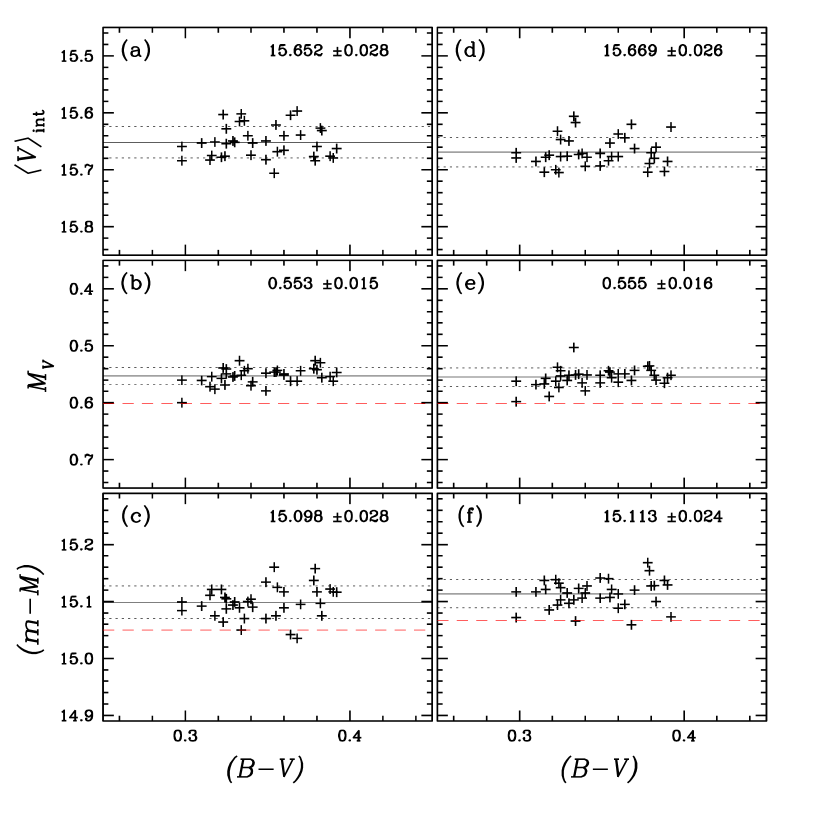
As a consistency check, we show of the globular cluster M3 using Equation (18) with our revised value and the apparent visual distance modulus in Figure 15. In panels (a) and (d), we show observed of RRab type variables in M3 by Cacciari et al. (2005) and Jurcsik et al. (2012), respectively. As can be seen in the figure, both results are in good agreement. Panels (b) and (e) show the calculated using Equation (18) with our revised zero-point, = 0.36. Note that Cacciari et al. (2005) obtained = 0.57 0.02 mag for M3 RRab stars and 0.57 0.04 mag for M3 RRc stars in their analyses, and their results are in good agreement with our results, 0.553 0.015 mag and 0.555 0.016 mag from RRL data by Cacciari et al. (2005) and Jurcsik et al. (2012), respectively. In panels (c) and (f), we show apparent visual distance modulus for M3 by comparing the observed and the calculated of RRab stars. We obtain apparent visual distance modulus values of 15.098 0.028 mag and 15.113 0.024 mag from Cacciari et al. (2005) and Jurcsik et al. (2012), respectively. Our apparent visual distance modulus values for M3 are in excellent agreement with that of Federici et al. (2012), who presented = 15.11 for the cluster, indicating that our revised value works correctly. Also shown in the figure with red dashed lines are and for M3 RRab type variables using the metallicity-luminosity zero-point by Catelan & Cortés (2008). If we use the zero-point by Catelan & Cortés (2008), is fainter and is smaller by about 0.05 mag than our results for M3.
5.5.4 for NGC 6723
We show of individual RRab variable stars in NGC 6723 using Equation (18) with = 0.36 in column (10) of Table 5. The mean absolute visual magnitude in this case is = 0.579 0.041 mag from all 18 RRab type variables and = 0.581 0.038 mag from 10 regular RRab type variables in NGC 6723. This value is in excellent agreement with our that expected from our revised metallicity-luminosity relation, = 0.578 0.133 mag. The difference in the absolute magnitude between that from the original relation by Jurcsik (1998) and that from the revised relation of Kovács & Walker (2001) with our new zero-point constant becomes 0.270 0.020 mag. Note that if we use the zero-point constant by Kinman (2002), = 0.43, then = 0.651 0.038 mag for 10 regular RRab type variables in NGC 6723.
Our results also support the idea that the zero-point constant in Equation (15) should be decreased by about 0.2 mag as suggested by Cacciari et al. (2005). If we use the reduced zero-point constant by 0.2 mag for RRc type variable stars in NGC 6723, = 0.620 0.021 mag for four regular RRc variable stars is in marginal agreement with that from RRab type stars within the measurement errors.
5.6 The distance modulus
5.6.1 Fourier parameters
We derive the distance modulus for NGC 6723 by comparing the observed with the absolute visual magnitude of RRab variables . Using Equation (14) and our interstellar reddening value, = 0.063 0.015 mag, we obtained = 14.405 0.083 mag from 18 RRab stars and = 14.418 0.032 mag from 10 regular RRab stars in NGC 6723. We show our true distance modulus for individual variables in columns (7) of Table 5. As discussed previously, Equation (14) is based on the fainter RRab absolute magnitude scale, hence our value is under-estimated. Our derived value should be corrected by 0.270 0.020 mag. Therefore, if we apply this correction term, our true distance modulus of NGC 6723 using 10 regular RRab stars becomes = 14.681 0.038 mag, corresponding to a distance from the Sun of 8.63 0.15 kpc.
We also make use of Equation (18) with = 0.36. We obtained = 14.476 0.074 mag from 18 RRab stars and 14.684 0.036 mag from 10 regular RRab stars using = 0.063 0.015 mag and the distance of the cluster from the Sun is 8.65 0.14 kpc. We show our results in column (11) of Table 5.
Our true distance modulus values from RRab type variable stars in NGC 6723 using the the relation by Jurcsik (1998) with our correction term and by Kovács & Walker (2001) with our revised zero-point are in excellent agreement with that of Harris (1996), = 14.69 mag.
We calculated the apparent and the true distance moduli from RRc variable stars and we obtained the average apparent distance modulus = 14.671 0.096 mag from all seven RRc variable stars and 14.643 0.076 mag from four regular RRc variable stars. Using = 0.063 mag, we obtained = 14.476 0.096 mag from all seven RRc variable stars and 14.448 0.076 mag from four regular RRc variable stars, which are equivalent to distances from the Sun of 7.86 0.35 kpc and 7.76 0.27 kpc, respectively. If we apply the zero-point correction term for the absolute magnitude of RRc type variables from Fourier parameters suggested by Cacciari et al. (2005), 0.20 0.02 mag, the true distance modulus from four RRc variable stars becomes = 14.648 0.079 mag, corresponding to 8.50 0.31 kpc, for four regular RRc variable stars. If we apply the same zero-point correction term as for RRab type variable stars in Equation (18), 0.270 0.020, the true distance modulus for NGC 6723 from 4 regular RRc variable stars becomes = 14.718 0.079 mag, corresponding to the distance from the Sun of 8.78 0.32 kpc. Applying the correction term of 0.270 mag for RRc type variable stars appears to make the distance modulus over-estimated and the correction term by Cacciari et al. (2005), 0.20 mag, appears to be more adequate for RRc type variables.
5.6.2 The Wesenheit function from Fourier parameters:
Kovács (1998) introduced an alternative empirical method to estimate true distance modulus of RRab type variables using the Wesenheit function;
| (19) |
where is the apparent Wesenheit function in photometry defined to be
| (20) |
and we adopt = 3.10. is the true Wesenheit function and Kovács (1998) derived the following transformation relation,
| (21) |
To apply this transformation relation, we used and . We show the calculated for individual RRab variable stars in column (8) and the true distance modulus based on this method, in column (9) of Table 5. We obtained = 14.302 0.037 mag, which is equivalent to the distance from the Sun of 7.25 0.12 kpc. Our result is significantly smaller than that of Harris (1996). However, the original calibration of Equation (21) by Kovács (1998) was also based on the fainter magnitude of RRab variable stars and the zero-point correction by 0.270 0.020 mag is required as we discussed above. If we apply the zero-point correction term in Equation (21), the true distance modulus of NGC 6723 using the Wesenheit function by Kovács (1998) becomes = 14.572 0.042 mag, resulted in the distance from the Sun of 8.21 0.16 kpc.
5.6.3 The Wesenheit function from theoretical models:
Cassisi et al (2004) studied the slope and the zero-point of the theoretical Wesenheit function incorporating evolutionary and pulsational properties for various metallicity and HB type. They provided the theoretical Wesenheit function ,
| (22) |
where is the fundamental period and is the value at . By interpolating the data given in Table 3 of Cassisi et al (2004), we obtained = 0.329 and = 2.341 for [Fe/H] = 1.23 dex and the HB type of 0.08 for NGC 6723. Then the true distance modulus, , of NGC 6723 can be written as
| (23) | |||||
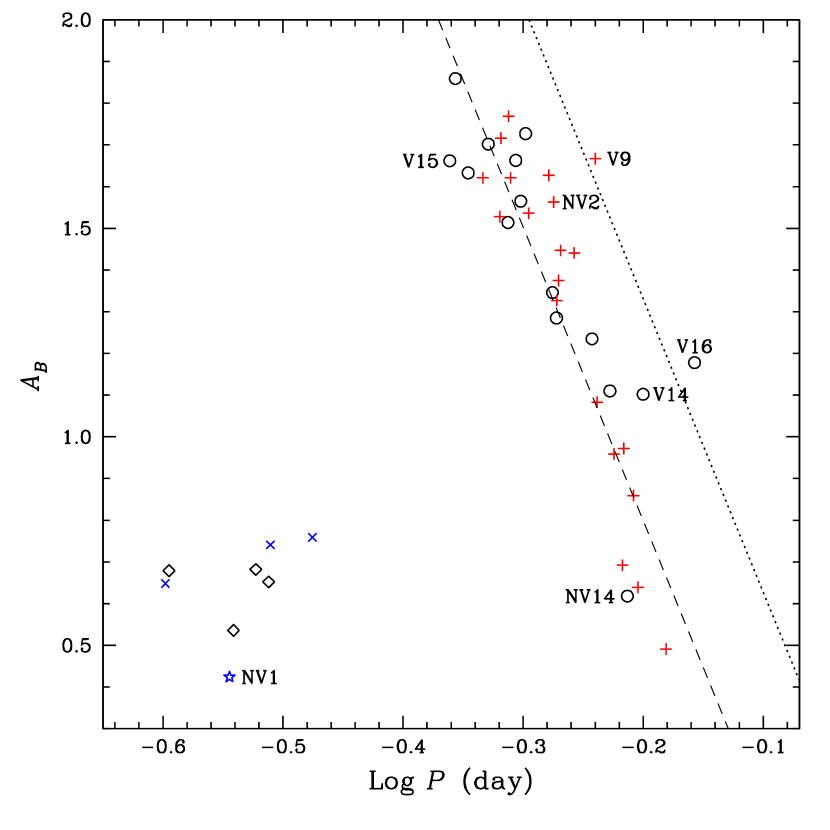
at a given . In Figure 13, we show a plot of of individual RRab variable stars as a function of their . We calculated the least square fit of the theoretical Wesenheit function to the observed data with a fixed slope on the versus plane. We obtained the true distance modulus of = 14.531 0.061 for all 35 RRab variable stars and 14.518 0.043 for 14 regular RRab variable stars999We do not use NV14 in our calculation because it appears to suffer from larger differential reddening effect than other RRLs in NGC 6723. However, as can be seen in Figure 13, the location of NV14 agrees well with other RRLs in NGC 6723. Since the Wesenheit function is reddening free, the location of NV14 in Figure 13 strongly suggests that NV14 is a member variable star.. As shown in Figure 13, the regular RRab variables V14 and V15 significantly deviate from the theoretical Wesenheit function shown with the dashed line in the plot. Note that V14 and V15 have somewhat brighter than other regular RRab type variable stars. If we exclude V14, V15, V16 and NV2 (see Appendix A), our true distance modulus of NGC 6723 based on the theoretical Wesenheit function by Cassisi et al (2004) becomes = 14.530 0.017 from 10 RRab variable stars and the distance from the Sun is 8.05 0.06 kpc.
The theoretical Wesenheit function of RRL can provide a powerful means to determine the distance of GCs because it is reddening-free and, furthermore, it incorporates evolutionary and pulsational properties for various metallicities and HB types of stellar populations. However, our distance modulus of NGC 6723 from the theoretical Wesenheit function by Cassisi et al (2004) appears to be slightly smaller than those from other methods (see Table 7). In Figure 16, we show a plot of from the absolute trigonometric parallaxes by Benedict et al. (2011) as a function of metallicity along with our revised metallicity-luminosity relation as presented in Equation (17). Also shown are the theoretical mean absolute visual magnitudes of RRLs with different HB types at fixed metallicity (Cassisi et al, 2004). As can be seen in the figure, our revised linear fit to the measured by Benedict et al. (2011) does not match with the absolute visual magnitudes of RRLs from theoretical model predictions by Cassisi et al (2004). We performed a least-square fit to the theoretical models using a fixed slope adopted by Benedict et al. (2011), 0.214, and we obtained the offset value in absolute visual magnitude of = 0.080 0.130 mag, in the sense that the theoretical model predictions by Cassisi et al (2004) are fainter. Cassisi et al (2004) also noted that their theoretical prediction for is in good agreement with by Benedict et al. (2002), whose is 0.08 mag fainter than that of Benedict et al. (2011). If we apply the zero-point correction term for the theoretical model predictions by Cassisi et al (2004), the true distance modulus of NGC 6723 from the theoretical Wesenheit function becomes = 14.610 0.131 mag and the distance from the Sun is 8.36 0.50 kpc.
It would be very desirable to perform detailed calculation of the Wesenheit function from the theoretical models with an updated absolute visual magnitude scale of RRLs in the future.
5.6.4 versus
Finally, we also derive the apparent and true distance moduli of NGC 6723 by using the average magnitude of the RRLs. In Figure 7, we show the CMD of the HB region using the magnitude-weighted integrate colors and the intensity-weighted integrated magnitudes for RRLs. As shown in the Figure, the average magnitude of RRLs (excluding V14, V15, V16, NV1, NV2 and NV14; see Appendix A) is = 15.459 0.055 mag. If we use the absolute visual magnitude of RRLs from our revised metallicity-luminosity relation presented in Equation (17), = 0.578 0.133 mag at [Fe/H] = 1.23 0.11 dex, and the apparent distance modulus of NGC 6723 is = 14.881 0.143 mag. Then the true distance modulus of NGC 6723 becomes = 14.686 0.143 mag if we use = 0.063 mag, corresponding to the distance from the Sun of 8.65 0.57 kpc.
In Table 7, we summarize our derived true distance modulus and the distance from the Sun for NGC 6723 using various methods. Our ranges from 14.57 to 14.69 mag with the unweighted mean value of 14.64 0.05 mag and the distance of NGC 6723 from the Sun ranges from 8.21 to 8.65 kpc with the unweighted mean value of 8.47 0.19 kpc (the errors are those of the mean).
6 versus RADIAL DISTANCE
Recently, Majaess et al. (2012) claimed that photometry of RRLs in GCs depends on the radial distance from the center and the photometric contamination in the crowded central region of GCs may affect the inferred parameters, such as distance, absolute magnitude, etc. With the exception of M3, the difference in the distance modulus derived from all RRLs and using only those in the outskirt of the cluster can be as large as 0.25 mag, in the sense that the RRLs in the outskirt of the GCs are fainter than those in the crowded central regions. They found an average difference for the five GCs in their Table 1 of about 0.1 mag.
We explore the variation of magnitude against the radial distance from the center for all the RRLs found in NGC 6723. We calculated the angular distance of each RRL from the center of the cluster using the Spherical law of cosine,
| (24) |
where and are the right ascension and the declination of the center of NGC 6723 and and are those of individual RRLs. For our calculations, we adopted the coordinates for the cluster center measured by Goldsbury et al. (2010); = 18:59:33.15 and = 36:37:56.1.
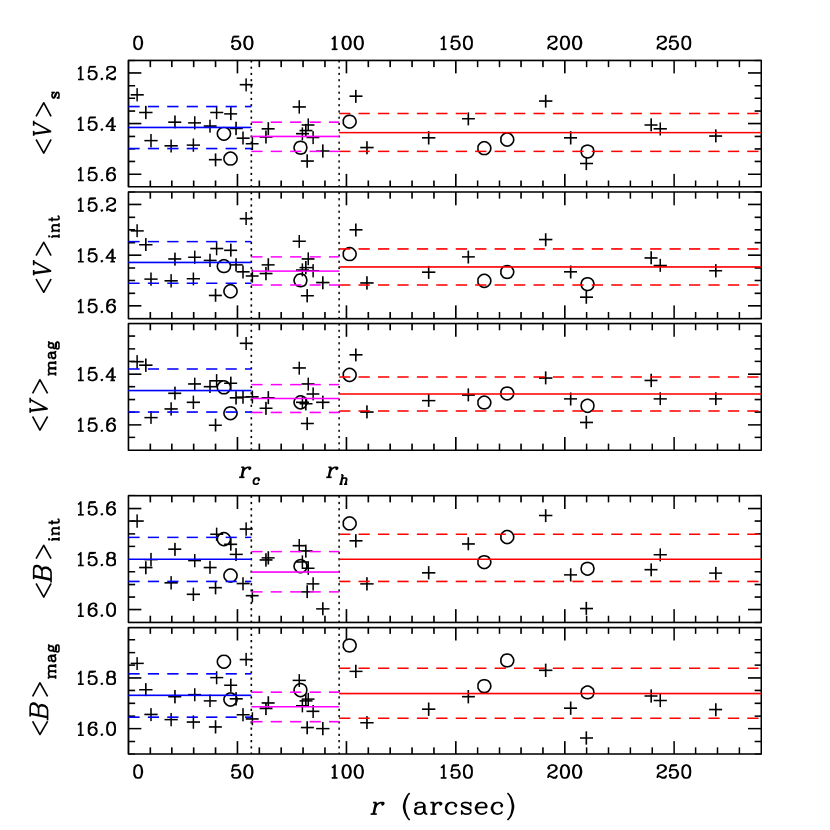
In Figure 17, we show plots of magnitudes of all RRLs in NGC 6723 as functions of the radial distance. Also shown are the average magnitudes and the dispersions in the magnitude ( levels) in the central region ( , the core radius), in the intermediate region ( , the half-light radius) and in the outskirt region ( ) of the cluster. The magnitudes of RRLs from three different regions agree well within measurement errors and the radial gradient does not appear to exist, suggesting that the photometric contamination in the central part of NGC 6723 is not severe.
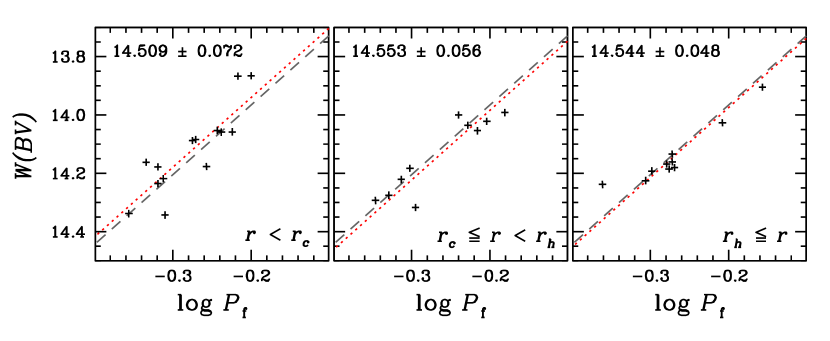
An alternative approach to examine a potential radial gradient of RRL magnitudes can be found in Figure 18, where we show plots of versus in three different radial regions. We calculate the distance modulus in each radial zone using the theoretical Wesenheit function with a fixed slope. Also shown in the figure is the theoretical Wesenheit function with = 14.531 0.061 mag using all 35 RRab type variable stars in NGC 6723 as a reference (see section 5.6.3). Again, the distance moduli measured from the theoretical Wesenheit function from three different regions agree well within measurement errors and the radial gradient cannot be seen.
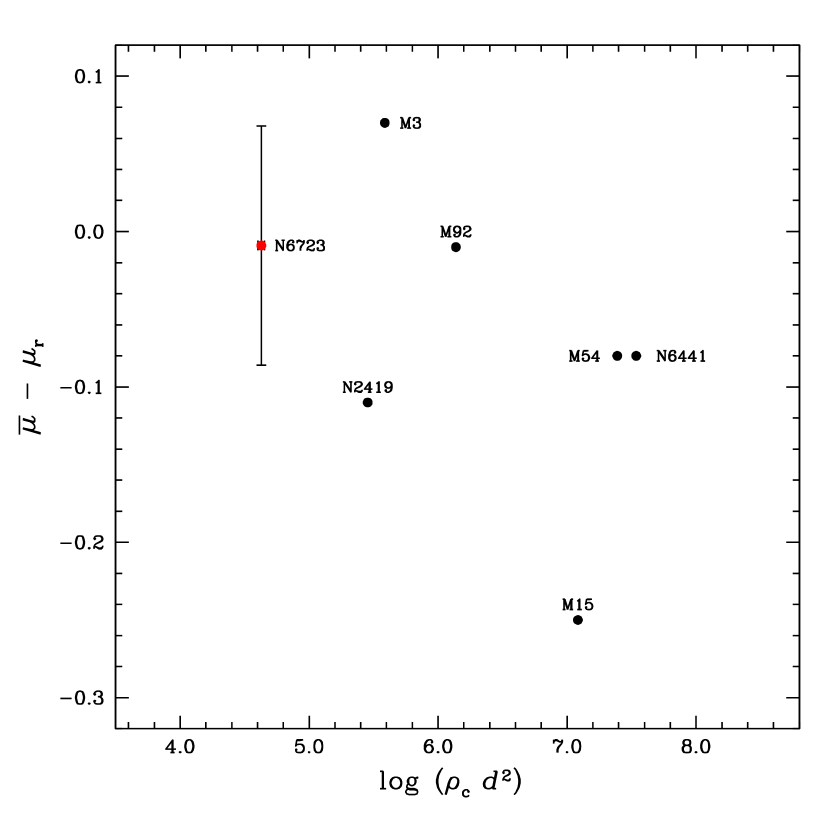
To understand the radial gradient of RRL magnitude, in Figure 19 we show a plot of versus for 6 GCs from Majaess et al. (2012) and NGC 6723 from our current study, where and are the central luminosity density in units of solar luminosities per cubic parsec and the distance from the Sun in kpc, respectively, from Harris (1996). We define to be the apparent crowdedness of the central region assuming that the mass-segregation is negligible in GCs under consideration. Also is defined to be the distance spread between the average computed using all 35 RRLs and only those near the periphery (Majaess et al. 2012) and it is a measure of the photometric contamination of the central region of a given GC system. Since is a measure of the apparent crowdedness of the central region of GC systems, it is natural to expect that as increases, the degree of photometric contamination, such as resulted from blending, increases. Therefore one expects to have
| (25) |
in GC systems as shown in Figure 19.
Since the LSST, for example, can detect RRLs in the local group of galaxies out to 1 Mpc scale in several years of time span (Oluseyi et al., 2012) and the future 30-m to 40-m class telescopes are expected to detect RRLs in nearby groups of galaxies, the utility of RRLs as a primary distance indicator will become more important. A more thorough study of the relation between and with an extended sample of GCs or high density regions would be desirable in the future, because if real, this relation can play a significant role to mitigate the discrepancy in establishing cosmic distance scale using RRLs.
7 SUMMARY
We have presented CCD photometry for 54 variables in the metal-rich inner halo globular cluster NGC 6723, including 22 newly discovered variables. We found that 13 RRLs and one SX Phe variable star are cluster member stars and two Sct variable stars and five W UMa type eclipsing binary stars are most likely off-cluster field stars.
New light curves, periods and photometric parameters for all those variables are presented. With the discovery of new RRLs, the mean periods of the RRab and RRc variables in the cluster are Pab = 0.541 0.066 day from 35 RRab type variable stars and Pc = 0.292 0.030 day from seven RRc type variable stars, respectively. The number ratio of the RRc type variable stars to the total number of the RRLs is n(c)/n(ab+c) = 0.167. Our new mean periods and the RRL distribution of NGC 6723 are in good agreement with those of a typical Oosterhoff group I globular cluster. We also obtained = 15.459 0.055 mag from 30 RRab type and seven RRc type variable stars and it is in good agreement with previous measurements by others.
We carried out the Fourier decomposition analysis for the RRLs in NGC 6723. Using empirical transformation relations by Jurcsik & Kovác (1996) and Morgan, Wahl, & Wieckhorst (2007), we obtained [Fe/H]ZW = 1.27 0.09 dex from RRab and 1.18 0.15 dex from RRc variable stars. The unweighted mean of the photometric metallicity of NGC 6723 in the Zinn & West metallicity scale becomes [Fe/H] = 1.23 0.11 dex, consistent with the previous metallicity measurement of the cluster from the high resolution spectroscopic study of red-giant branch stars by Fullton & Carney (1996).
We investigated the interstellar reddening value by comparing the intrinsic color using empirical transformation relations from the Fourier and the pulsational parameters and the observed color of individual RRab type variable stars in NGC 6723. We also provided a new calibration of the interstellar reddening values on the HST ACS photometric system using the ACS GC survey by Dotter et al. (2010). When compared to the interstellar reddening values from the HST ACS main-sequence photometry of NGC 6723, the values from the Fourier and the pulsational parameters of RRab type variable stars appear to slightly over-estimate the foreground interstellar reddening value. Furthermore, we found that the slope in the relation between the intrinsic color derived from the Fourier and the pulsational parameters and the observed color of RRab type variable stars is not unity. As a consequence, the interstellar reddening values from the Fourier and the pulsational parameters have substantial gradient against the observed color and compressed the derived distribution of RRab type variable stars. The later effect may explain the compressed distribution of M3 RRLs noted by Cacciari et al. (2005) when they used the empirical transformation relation by Kovács & Walker (1999). Our results also suggest that derived intrinsic colors of individual variable stars from the Fourier and the pulsational parameters may not be reliable, confirming the similar results by Cacciari et al. (2005). For the interstellar reddening value of NGC 6723, we adopted the unweighted mean of those from the static color of RRLs of our current study and from the isochrone fitting by Dotter et al. (2010), finding = 0.063 0.015.
We discussed that RR Lyr may not be an evolved star, in contrast to the recent Strömgren photometry study by Catelan & Cortés (2008) who claimed that RR Lyr is about 0.06 mag brighter than the ZAHB. The reason for having brighter luminosity for RR Lyr by Catelan & Cortés (2008) is that their analysis was relied on the theoretical HB models by Catelan, Pritzl, & Smith (2004), whose HB absolute magnitude levels are 0.08 mag fainter than the current standard value.
Using the recent HST absolute trigonometric parallax measurements of RR Lyr by Benedict et al. (2011), we obtained the following metallicity-luminosity relation,
Our revised relation is in excellent agreement with the current standard absolute visual magnitude of RRLs, = 0.52 mag at [Fe/H] = 1.50 dex. Also our revised metallicity-luminosity relation for RRLs gives = 18.54 0.13 mag for LMC, if we use the value in LMC by Clementini et al. (2003).
Our results for of NGC 6723 confirmed that original transformation relations of the absolute visual magnitude of RRLs by Jurcsik (1998) and Kovács (1998) are 0.270 0.020 mag fainter than the current standard value. We calibrated the new zero-point constant of the empirical transformation to derive the absolute visual magnitude of RRab type variable star by Kovács & Walker (2001). Using our own zero-point constant, we obtained = 0.581 0.038 mag for NGC 6723. We then derived the distance modulus of NGC 6723 using (i) from the Fourier parameters, (ii) Wesenheit functions of the clusters, and (iii) the -[Fe/H] relation. Our true distance modulus of NGC 6723 ranges from 14.57 to 14.69 mag with the unweighted mean value of 14.65 0.05 mag and the distance of NGC 6723 from the Sun ranges from 8.21 to 8.65 kpc with the unweighted mean value of 8.47 0.17 kpc.
Finally, we examined the RRL magnitude dependencies on the radial distance from the center of the cluster, as claimed by Majaess et al. (2012). We found no evidence of the radial gradient in the RRL magnitude in NGC 6723. We showed that it is natural to expect to have more severe photometric contamination with more severe degree of the apparent crowdedness. We suggested that there appears to exist a relation between the degree of photometric contamination and the apparent crowdedness of the central region of globular cluster systems,
If real, this relation can play a significant role to mitigate the discrepancy in establishing cosmic distance scale using RRLs in resolved stellar populations.
Appendix A Notes on V14, V15, and V16
The period shift is the measure of the period difference of RRLs at fixed temperatures, the comparisons usually being made between GCs’ variables (Sandage, Katem, & Sandage, 1981). The internal period shift analysis, which compares periods of RRLs at a fixed temperature in a given GC, can also be useful to understand the physical properties of RRLs of the GC under consideration (Lee & Carney, 1999b). The trouble with the period shift analysis is that the temperature of the pulsating RRLs is difficult to measure. Fortunately, the blue amplitude known to be a good temperature indicator for RRab type variables following the pioneering work by Sandage, Katem, & Sandage (1981) (see also Carney, Strom, & Jones, 1992).
The period-density relation states that the period of a pulsating star is inversely proportional to the square root of the mean density. Assuming the same mass and the same effective temperature, the less dense star would have a longer period. Qualitatively, at a fixed temperature and mass, a lower density star has a larger radius and hence a greater luminosity. More precisely, one can make use of the relations given by van Albada & Baker (1971). For the fundamental mode, the period of an RR Lyrae variable is
| (A1) |
For example, by employing an internal period shift analysis, Lee & Carney (1999b) showed that the RRab type variable V10 in GC NGC 7089(M2) is brighter than other RRLs in the cluster from its longer period at a fixed temperature.
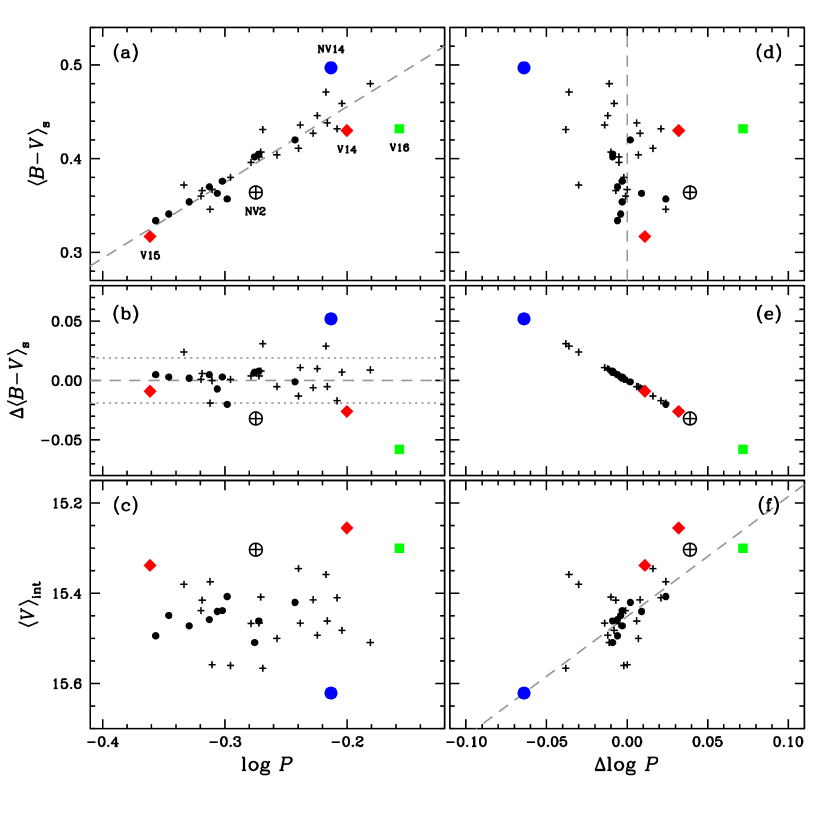
The regular RRab type variable V16 in NGC 6723 has a longer period than other variables in the cluster at the fixed (i.e. at the fixed temperature) as shown in Figure 12. Assuming the same mass and the same effective temperature in Equation (A1), the longer period of V16 indicates that V16 is more luminous than other RRLs, consistent with our observations. As shown in Table 3 or Figure 12, V16 is 0.159 mag brighter than the mean visual magnitude of RRLs in NGC 6723 [see also Figure A1 (c)].
In Figure A1 (a), we show a plot of versus for RRab type variables in NGC 6723. Although, the blue amplitude of RRab type variables is related to the effective temperature as mentioned above, it is thought that the mean color of the variables is more proper temperature indicator than the blue amplitude is. However, using has a disadvantage that it is not a reddening-free parameter, such as . In the figure, we also show the linear fit to the data, finding
| (A2) |
We measure the period shift of = 0.07 for V16 at the fixed , resulting in = 0.21 mag assuming the same mass and the same temperature in Equation (A1), where is the difference in the bolometric magnitude between the mean value and the RRL under consideration. The magnitude difference from the period shift analysis is somewhat larger than that from , 0.159 mag, but is compatible with that from the calculated absolute visual magnitude. In Table 5, we do not show physical parameters for V16 because it has a large compatibility condition parameter, = 10.9, and, consequently, it is tagged as a potential Blazhko variable. If we use Equation (18) and Fourier parameters for V16 in Table 4, the absolute visual magnitude of V16 becomes = 0.396 mag and it is 0.185 mag brighter than the mean absolute visual magnitude of the cluster. From this exercise, one can show that V16 is intrinsically brighter than other RRLs in the cluster and the photometric contamination, such as blending with nearby stars, may not be responsible for its high luminosity. Figure A1 (b) shows residual colors around the fitted line. In the figure, V16 has a significantly smaller color, i.e. a higher temperature, at the fixed period. Again, assuming the same mass in Equation (A1), one can show that a more luminous RRL has a higher temperature at the fixed period. Therefore, all the evidences suggest that V16 may be a more evolved RRL in NGC 6723. To a lesser extent, the same characteristics can also be applied to NV2, as the referee of the paper pointed out. But a caution should be advised that our period of this variable may be slightly inaccurate or that is changing as we noted in Appendix E.
For NV14 in Figure A1 (a), the internal period shift is = 0.06, almost an opposite case of V16. If we use Equation (A1) assuming the same mass and temperature, it should be less luminous than other RRLs in NGC 6723 by = 0.18 mag. Quantitively, the derived magnitude from the period shift analysis appears to be in good agreement with the magnitude difference of NV14 from the mean values, = 0.162 mag. However, it should be emphasized that in Figure A1 (a) is not a reddening free parameter. As shown in Figure 12, NV14 has a normal period at the fixed blue amplitude. Recall that both quantities are reddening free parameters. Also shown in Table 5, the absolute visual magnitude of NV14 from Fourier parameters using Equation (18) is in excellent agreement with the mean value of the cluster to within 0.02 mag, suggesting that the fainter apparent visual magnitude of NV14 is most likely due to the excess differential foreground reddening effect by 0.03 mag.
The RRab type variables V14 and V15 appears to be normal in Figure 12 or Figure A1 (a), but significantly deviate from the mean value in Figure 13. As shown in Figure A1 (c) or (f), V14 and V15 are brighter than other RRLs for their period. Part of the bright nature of V14 can be explained by employing the period shift analysis. The period shift for V14 is = +0.03 at the fixed color, equivalent to = 0.09 mag. As in Table 5, the absolute visual magnitude from the Fourier analysis of V14 is 0.08 mag brighter than the mean value of the cluster, consistent with that from the period shift analysis. However the period shift analysis can not fully explain the bright apparent magnitude of V14. As shown in Table 3, V14 and V15 are 0.20 and 0.12 mag brighter than the mean value of the cluster.
In Figure A1-(f), we show a plot of versus . As can be seen in the figure, appears to be well correlated with . We perform a least square fit to the data, finding
| (A3) |
The slope of the relation is in good agreement with that expected from Equation (A1) with the assumption of the same mass, temperature, and bolometric correction, 2.976, to within a level. The residual around the fitted line can not be explained with the theoretical pulsational properties of RRLs given by van Albada & Baker (1971). It is thought that blending with nearby faint objects would be responsible for the positive residual such as can be seen in V14 and V15 in the figure. Using the above relation and for V14 and V15, 0.032 and 0.011 respectively, the expected values for each variable are 15.367 and 15.423 mag. The calculate values are 0.112 and 0.085 mag fainter than our measurements and these amounts should be explained by the photometric contamination, such as blending with nearby faint objects. Note that these values are compatible with the residuals in as shown in Figure 13. The residuals in for V14 and V15 are 0.101 and 0.104 mag, respectively.
We conclude that V14 and V16 are more evolved RRLs of NGC 6723. In addition, V14 suffers from the blending effect with nearby faint companions by 0.10 mag. On the other hand, V15 is solely affected by the blending effect with a similar amount.
Appendix B Red and variables
Menzies (1974) found two semi-regular red variables and one variable in NGC 6723. We show plots of , , and vs. HJD for V25 and V26 in Figure A2 and A3, respectively. Menzies pointed out that these two red variables are 0.2 mag redder than the reddest RGB stars in NGC 6723. Our CMD shown in Figure 2 also confirms this. Clement et al. (2001) listed the period only for V25, 140 day, but we were not able to derive the periods for both red variables.
NGC 6723 is within a degree from the Corona Australis dark cloud. Knacke et al. (1973) reported two emission objects near NGC 6723 and Menzies (1974) found that V30 is a variable. As Menzies noted this variable is probably associated with the Corona Australis dark cloud, not with NGC 6723. In Figure A4, we show plots of , , and vs. HJD for V30. Clement et al. (2001) did not list the period for V30 and we were not able to derive the period for this variable.
Appendix C SX Phe and Sct Stars
We investigate the membership status of newly found short-period pulsating variables NV16, NV18 and NV19 based on the distance modulus of each pulsating variable.
McNamara (2011) provided a period-luminosity-metallicity relation,
| (C1) |
while Cohen & Sarajedini (2012) provided a period-luminosity relation,
| (C2) |
for the SX Phe type variable. The calculated absolute magnitudes from both relations are in agreement within the 0.03 mag level and we adopt the average value from both transformation relations. In Table 8, we show the absolute visual magnitude of NV19, = 2.667 mag. McNamara (2011) also provided the transformation relations to calculate the intrinsic color of SX Phe in his Equations (6a) for [Fe/H] = 0.04 dex and (6b) for [Fe/H] = 1.91 dex. Using the linear interpolation for [Fe/H] = 1.2 dex, we obtain the intrinsic color for NV19, = 0.215, and then we obtain the interstellar reddening value, = 0.109 mag, by comparing the intrinsic color and the average magnitude-weighted integrated color of NV19. The value for NV19 is slightly larger than that from RRLs, = 0.063 0.015 mag. Finally, using the absolute visual magnitude and the interstellar reddening value for NV19, we obtain the true distance modulus of 14.638 mag and the true distance from the Sun of 8.46 kpc, consistent with those from RRLs in the cluster, 8.47 0.17 kpc. Therefore, NV19 is truly a cluster member SX Phe type variable star.
We perform the same calculations for NV16 and NV18 and we obtain the true distances of 4.67 kpc and 5.45 kpc for NV16 and NV18, respectively, and they are not cluster members. Therefore, NV16 and NV18 are likely Sct type variables. Using a period-luminosity-metallicity relation for Sct type variable stars by McNamara (2011),
| (C3) |
we obtain the absolute visual magnitudes for NV16 and NV18. Then, assuming the near solar metallicity, we use the Equation (6a) from McNamara (2011) and calculate the intrinsic colors for the variables. Finally, we obtain the true distances from the Sun of 6.14 kpc and 6.31 kpc for NV16 and NV18, respectively, and our results are shown in Table 8.
Appendix D Eclipsing Binaries
We investigate the membership status of five W UMa type eclipsing binaries based on (i) the radial distance from the center of NGC 6723 and (ii) the distance modulus of each variable star.
In the second column of Table 9, we show the radial distance of each variable star from the center of NGC 6723. As can be seen, NV20, NV21 and NV22 lie beyond the tidal radius of the cluster, = 631 arcsec (Harris, 1996), and they are not cluster member variables.
Rucinski (2000) provided an empirical relation to calculate the absolute visual magnitude of W UMa type eclipsing binary,
| (D1) |
Assuming = 0.063 mag, we calculate the absolute visual magnitude for each W UMa type variable and we show our results in Table 9. During our calculations, we adopt the magnitude-weighted integrated color . Since the shape of the light curve of a typical W UMa type binary is symmetric and sinusoidal, the average magnitude or the average color do not greatly depend on the average scheme. For our case, the mean difference in color from five variable stars is negligibly small, = 0.000 0.002 mag. Then we derive the true distance modulus for each variable by comparing the absolute visual magnitude with the de-reddened visual intensity-weighted integrated magnitude. As shown in Table 9, the true distances of NV15 and NV17 are about 1.6 kpc and 3.1 kpc from the Sun, respectively, and they are very small compared to the true distance of NGC 6723, 8.47 0.17 kpc. Therefore, unfortunately, neither NV15 nor NV17 are cluster members. Also shown in the table are the true distances of NV20, NV21 and NV22, suggesting again that they are not cluster members.
Appendix E Notes on Individual Variable Stars
V1 — The light curve shows the Blazhko effect.
V5 — Clement et al. (2001) questioned a double mode RRL, however, our light curve shows that it is a RRab showing the Blazhko effect..
V6 — The light curve shows the Blazhko effect.
V8 — The light curve shows the Blazhko effect. The period of the variable by Clement et al. (2001) was = 0.53 day, but we have a shorter period for the variable, = 0.4803 day. The mis-aligned maxima indicate that our period of the variable may be slightly incorrect.
V9 — The light curve shows the Blazhko effect.
V13 — The light curve shows the Blazhko effect.
V14 — The light curve appears to show the Blazhko effect. The period of the variable by Clement et al. (2001) was = 0.619 day, but we have a longer period for the variable, = 0.6308 day.
V18 — The light curve shows the Blazhko effect. The mis-aligned maxima indicate that our period of the variable may be slightly incorrect.
V18 — The mis-aligned maxima indicate that our period of the variable may be slightly incorrect.
V20 — The light curve shows the Blazhko effect. The mis-aligned maxima indicate that our period of the variable may be slightly incorrect.
V23 — The light curve appears to show the Blazhko effect.
V29 — The light curve appears to show the Blazhko effect. The period of the variable by Clement et al. (2001) was = 0.53 day, but we have a shorter period for the variable, = 0.4989 day.
V31 — The light curve shows the Blazhko effect.
NV1 — RRc type variable. Our light curve suggests that the period is slightly inaccurate or that it is changing. Probable non-member variable.
NV2 — RRab type variable. Our light curve suggests that the period is slightly inaccurate or that it is changing.
NV3 — RRab type variable.
NV4 — RRab type variable showing the Blazhko effect.
NV5 — RRab type variable showing the Blazhko effect.
NV6 — RRab type variable.
NV7 — RRc type variable.
NV8 — RRab type variable showing the Blazhko effect.
NV9 — RRab type variable showing the Blazhko effect. It has the smallest amplitude, = 0.491 mag, among all RRab type variables in NGC 6723.
NV10 — RRab type variable showing the Blazhko effect.
NV11 — RRc type variable showing the Blazhko effect.
NV12 — RRab type variable.
NV13 — RRab type variable showing the Blazhko effect.
NV14 — RRab type variable. It is suspected that NV14 suffers from a large differential reddening effect than other RRLs in NGC 6723 by 0.03 mag.
NV15 — W Uma type eclipsing binary. Probable non-member variable based on the true distance from the Sun.
NV16 — Sct type variable. Probable non-member variable based on the true distance from the Sun.
NV17 — W Uma type eclipsing binary. Probable non-member variable based on the true distance from the Sun.
NV18 — Sct type variable. Probable non-member variable based on the true distance from the Sun.
NV19 — SX Phe type variable.
NV20 — W Uma type eclipsing binary. Probable non-member variable based on the radial distance from the center of NGC 6723 and the true distance from the Sun.
NV21 — W Uma type eclipsing binary. Probable non-member variable based on the radial distance from the center of NGC 6723 and the true distance from the Sun.
NV22 — W Uma type eclipsing binary. Probable non-member variable based on the radial distance from the center of NGC 6723 and the true distance from the Sun.
References
- Alcaíno et al. (1999) Alcaíno G., Liller W., Alvarado F., Mironov A., Ipatov A., Piskunov A., Samus N., & Smirnov O. 1999, A&AS, 136, 461
- Alvarado et al. (1994) Alvarado F., Wenderoth E., Alcaíno G., & Liller W. 1994, AJ, 107, 631
- Arce & Goodman (1998) Arce, H. G., & Goodman, A. A. 1998, ApJ, 512, L135
- Benedict et al. (2002) Benedict, G. F., McArthur, B. E., Fredrick, L. W., Harrison, T., E., Lee, J., Slesnick, C. L., Rhee, J., Patterson, R. J., Nelan, E., Jefferys, W. H., van Altena, W., Shelus, P. J., Franz, O. G., Wasserman, L. H., Hemenway, P. D., Duncombe, R. L., Story, D., Whipple, A. L., & Bradley, A. J. 2002, AJ, 123, 473
- Benedict et al. (2011) Benedict G. F., McArthur B. A., Feast M. W., Barnes T. G., Harrison T. E., Bean J. L., Menzies J. W., Chaboyer B., Fossati L., Nesvacil N., Smith H. A., Kolenberg K., Lanley C. D., Kochukhov O., Nelan E. P., Shulyak D. V., Taylor D., & Freedman W. L. 2011, AJ, 142 187
- Cacciari (2009) Cacciari C. 2009, MmSAI, 80, 97
- Cacciari (2013) Cacciari C. 2013, IAU Symp. 289, Advancing the Physics of Cosmic Distances, ed. R. de Grijs (Cambridge Univ. Press: Cambridge), p. 101.
- Cacciari et al. (2005) Cacciari C., Corwin T. M., & Carney B. W. 2005, AJ, 129, 267
- Carney, Strom, & Jones (1992) Carney B. W., Storm J., & Jones R. V. 1992, ApJ, 386, 663
- Carretta & Gratton (1997) Carretta E., & Gratton R. G. 1997, A&AS, 121, 95
- Cassisi et al (2004) Cassisi S., Castellani M., Caputo F., & Castellani V. 2004, A&A, 426, 641
- Catelan & Cortés (2008) Catelan, M., & Cortés, C. 2008, ApJ, 676, L135.
- Catelan, Pritzl, & Smith (2004) Catelan, M., Pritzl, B. J., & Smith, H. A. 2004, ApJS, 154, 633.
- Cincotta et al. (1995) Cincotta P. M., Méndez M.,& Núñez J. A. 1995, ApJ, 449, 231
- Clement et al. (2001) Clement C. M., Muzzin A., Dufton Q., Ponnampalam T., Wang J., Burford J., Richardson A., Rosebery T., Rowe J., & Sawyer Hogg H. 2001, AJ, 122, 2587
- Clementini et al. (2003) Clementini, G., Gratton, R., Bragaglia, A., Carretta, E., Di Fabrizio, L., & Maio, M. 2003, AJ, 125, 1309
- Cohen & Sarajedini (2012) Cohen, R. E. & Sarajedini, A. 2012, MNRAS, 419, 342
- Dinescu et al. (2003) Dinescu D. I., Girard T. M., van Altena W. F., & López C. E. 2003, AJ, 125, 1373
- Dotter et al. (2010) Dotter A., Sarajedini A., Anderson J., Aparicio A., Bedin L., Chaboyer B., Majewski S., Marín-Franch A., Milone A., Paust N., Piotto G., Reid N., Rosenberg A., & Siegel M. 2010, ApJ, 708, 698
- Drake et al. (2013) Drake A. J., Catelan M., Djorgovski S. G., Torrealba G., Graham M. J., Belokurov V., Koposov S. E., Mahabal A., Prieto J. L., Donalek C., Williams R., Larsson S., Christensen E., & Beshore E. 2013, ApJ, 763, 32
- Dutra & Bica (2000) Dutra C. M., & Bica E. 2000, A&A, 359, 347
- Federici et al. (2012) Federici, L., Cacciari, C., Bellazzini, M., Fusi Pecci, F., Galleti, S., & Perina, S. 2012, A&, 544, 155
- Fernley et al. (1998) Fernley, J., Skillen, I., Carney, B. W., Cacciari, C., & Janes, K. 1998, MNRAS, 293, 61
- Freeman & Bland-Hawthorn (2002) Freeman K., & Bland-Hawthorn J. 2002, ARA&A, 40, 487
- Fullton (1995) Fullton L. K. 1995, Ph.D. thesis, Univ. North Carolina
- Fullton & Carney (1996) Fullton L. K., & Carney B. W. 1996, in the Formation of the Galactic Halo…Inside and Out, ASP Conf. Ser. Vol. 92, edited by H. Morrison and A. Sarajenini (A.S.P., San Francisco), p. 256
- Geisler (1986) Geisler, D. 1986, PASP, 98, 847
- Goldsbury et al. (2010) Goldsbury, R., Richer, H. B., Anderson, J., Dotter, A., Sarajedini, A., & Woodley, K. 2010, AJ, 140, 1830
- Harris (1996) Harris W. E., 1996, AJ, 112, 1487
- Jurcsik (1995) Jurcsik J. 1995, Acta Astron., 45, 653
- Jurcsik (1998) Jurcsik J. 1998, A&A, 333, 571
- Jurcsik et al. (2012) Jurcsik J., Hajdu, G., Szeidl, B., Oláh, K., Kelemen, J., Sódor, Á., Saha, A., Mallick, P., & Claver, J. 2012, MNRAS, 419, 2173
- Jurcsik & Kovác (1996) Jurcsik J., & Kovács G. 1996, A&A, 312, 111
- Kaluzny et al (1995) Kaluzny J., Kubiak M., Szymański M., Udalski A., Krzemiński W., & Mateo M. 1995, A&AS, 112, 407
- Kinman (2002) Kinman T. D. 2002, IBVS, 5354
- Knacke et al. (1973) Knacke R. F., Strom K. M., Strom S. E., Young E, & Kunkel W. 1973, ApJ, 179, 847
- Kollmeier et al. (2013) Kollmeier, J. A., Szczygieł, D. M., Burns, C. R., Gould, A., Thompson, I. B., Preston, G. W., Sneden, C., Crane, J. D., Dong, S., Madore, B. F., Morrell, N., Prieto, J. L., Shectman, S., Simon, J. D., & Villanueva, E. 2013, ApJ, 775, 57
- Kovács (1998) Kovács G. 1998, Mem. Soc. Astron. Ital., 69, 49
- Kovács & Jurcsik (1996) Kovács G., & Jurcsik J. 1996, ApJ, 466, L17
- Kovács & Kanbur (1998) Kovács G., & Kanbur S. M. 1998, MNRAS, 295, 834
- Kovács & Kupi (2007) Kovács G., & Kupi G. 2007, A&A, 462, 1007
- Kovács & Walker (1999) Kovács G., & Walker A. R. 1999, ApJ, 512, 271
- Kovács & Walker (2001) Kovács G., & Walker A. R. 2001, A&A, 371, 579
- Kunder & Chaboyer (2008) Kunkder A., & Chaboyer B. 2008, AJ, 136, 2441
- Lafler & Kinman (1965) Lafler J., & Kinman T. D. 1965, ApJS, 11, 216
- Landolt (1992) Landolt A. U. 1992, AJ, 104, 340
- Landolt (2007) Landolt A. U. 2007, AJ, 133, 2502
- Landolt (2009) Landolt A. U. 2009, AJ, 137, 4186
- Lee & Carney (1999a) Lee J. -W., & Carney B. W. 1999a, AJ, 117, 2868
- Lee & Carney (1999b) Lee J. -W., & Carney B. W. 1999b, AJ, 118, 1373
- Lee & Carney (2006) Lee J. -W., & Carney B. W. 2006, AJ, 132, 2171
- Lee et al. (2001) Lee J. -W., & Carney B. W., Fulton, L. K., & Stetson, P. B. 2001, AJ, 122, 3136
- Lee et al. (1994) Lee Y. -W, Demarque P., & Zinn R. 1994, ApJ, 423, 248
- Majaess et al. (2012) Majaess D., Turner D., Gieren W., & Lane D. 2012, ApJ, 752, L10
- McNamara (2011) McNamara D. H. 2011, AJ, 142, 110
- Marconi et al. (2003) Marconi M., Caputo F., Di Criscienzo M., & Castellarni M. 2003, ApJ, 596, 299
- Menzies (1974) Menzies J. 1974, MNRAS, 168, 177
- Morgan, Wahl, & Wieckhorst (2007) Morgan S. M., Wahl J. N., & Wieckhorst R. M. 2007, MNRAS, 374, 1421
- Oluseyi et al. (2012) Oluseyi H. M., Becker A. C., Culliton C., Furqan M., Hoadley K. L., Regencia P., Wells A. J., Ivezic̀ Ž., Jones R. L., Krughoff K. S., Sesar B., Jacoby S., & Allison I. J. 2012, AJ, 144, 9
- Piersimoni, Bono, & Ripepi (2002) Piersimoni A. M., Bono G., Ripepi V. 2002, AJ, 124, 1528
- Pietrukowicz et al. (2012) Pietrukowicz P., Udalski A., Nataf D. M., Wyrzykowski Ł., Poleski R., Kozłowski S., Szymaǹski M. K., Kubiak M., Peitrzyǹski G., & Ulaczyk K. 2012, ApJ, 750. 169
- Rosenberg et al. (1999) Rosenberg A., Saviane I., Piotto G., & Aparicio A. 1999, AJ, 118, 2306
- Rucinski (2000) Rucinski S. M. 2000, AJ, 120, 319
- Rutledge, Hesser, & Stetson (1997) Rutledge G. A., Hesser J. E., & Stetson P. B. 1997, PASP, 109, 907
- Sandage (1990) Sandage A. 1990, ApJ, 350, 603
- Sandage, Katem, & Sandage (1981) Sandage A., Katem, B., & Sandage, M. 1981, ApJS, 46,41
- Sarajedini et al. (2007) Sarajedini A., Bedin L. R., Chaboyer B., Dotter A., Siegel M., Anderson J., Aparicio A., King I., Majewski S., Marín-Franch A., Piotto G., Reid I. N., & Rosenberg A. 2007, AJ, 133, 1658
- Schlegel et al. (1998) Schlegel D. J., Finkbeiner D. P., & Davis M. 1998, ApJ, 500, 525
- Simon & Lee (1981) Simon N. R., & Lee A. S. 1981, ApJ, 248, 291
- Smith & Hesser (1986) Smith G. H., Hesser J. E. 1986, PASP, 98, 838
- Smith (1981) Smith H. A. 1981, ApJ, 250, 719
- Smith (1995) Smith H. A. 1995, RR Lyrae Stars (Cambridge: Cambridge Univ. press)
- Smith & Sandage (1981) Smith H. A., & Sandage A. 1981, AJ, 86, 1870
- Stellingwerf (1978) Stellingwerf R. F. 1978, ApJ 224, 953
- Stetson (1987) Stetson P. B. 1987, PASP, 99, 191
- Stetson (1990) Stetson P. B. 1990, PASP, 102, 932
- Stetson (1993) Stetson P. B. 1993, in IAU Coll. 136, Stellar Photometry: Current Techniques and Future Developments, ed. C. J. Butler & I. Elliot (Cambridge: Cambridge Univ. Press), 291
- Stetson (1994) Stetson P. B. 1994, PASP, 106, 250
- Stetson (1995) Stetson P. B. 1995, DAOPHOTII User’s Manual (Victoria : Dominion Astrophys. Obs.)
- Stetson (2000) Stetson P. B. 2000, PASP, 112, 925
- Turner (1995) Turner A. M. 1995, Cooking with ALLFRAME: Photometry and the H0 Key Project (Victoria : Dominion Astrophys. Obs.)
- van Albada & Baker (1971) van Albada, T. S., & Baker, N. 1971, ApJ, 169, 311
- van den Bergh (1993) van den Bergh S., 1993, ApJ, 411, 178
- Walker & Terndrup (1996) Walker A. R., & Terndrup D. M. 1991, ApJ, 378, 1786
- Walker (2012) Walker A. R., 2012, Ap&SS, 341, 3
- Zachairias et al. (2004) Zacharias, N., Monet, D. G., Levine, S. E., et al. 2004, AAS, 205, 4815
- Zinn & West (1984) Zinn R., & West M. J. 1984, ApJS, 55, 45
| Date | Telescope | n() | n() |
|---|---|---|---|
| 2002/08/30 | CTIO 0.9m | 16 | 22 |
| 2002/08/31 | CTIO 0.9m | 21 | 24 |
| 2002/09/01 | CTIO 0.9m | 22 | 24 |
| 2002/09/02 | CTIO 0.9m | 28 | 29 |
| 2004/05/26 | CTIO 0.9m | 18 | 19 |
| 2004/05/27 | CTIO 0.9m | 31 | 31 |
| 2004/05/28 | CTIO 0.9m | 7 | 7 |
| 2004/05/30 | CTIO 0.9m | 9 | 10 |
| 2008/07/23 | CTIO 1.0m | 27 | 28 |
| 2008/07/24 | CTIO 1.0m | 12 | 14 |
| 2008/07/26 | CTIO 1.0m | 5 | 5 |
| 2008/07/27 | CTIO 1.0m | 7 | 6 |
| 2008/07/28 | CTIO 1.0m | 5 | 5 |
| 2008/07/30 | CTIO 1.0m | 3 | 3 |
| 2008/08/08 | CTIO 1.0m | 9 | 9 |
| 2008/08/10 | CTIO 1.0m | 21 | 21 |
| 2009/07/27 | CTIO 1.0m | 7 | 7 |
| 2009/07/28 | CTIO 1.0m | 7 | 7 |
| 2009/07/29 | CTIO 1.0m | 9 | 9 |
| 2010/08/02 | CTIO 1.0m | 12 | 13 |
| 2010/08/03 | CTIO 1.0m | 10 | 10 |
| 2012/04/23 | CTIO 0.9m | 24 | 24 |
| 2012/04/25 | CTIO 0.9m | 17 | 17 |
| 2012/04/28 | CTIO 0.9m | 5 | 5 |
| 2012/04/29 | CTIO 0.9m | 4 | 4 |
| 2012/07/12 | CTIO 0.9m | 25 | 27 |
| 2012/07/14 | CTIO 0.9m | 10 | 10 |
| 2012/07/19 | CTIO 0.9m | 10 | 10 |
| 2012/07/24 | CTIO 0.9m | 2 | 2 |
| Date | Tel. | n | ||||||||
|---|---|---|---|---|---|---|---|---|---|---|
| Aug 2002 | 0.9m | 27 | 0.031 | 0.135 | 3.029 | 0.080 | 0.231 | 3.342 | 0.002 0.017 | 0.003 0.018 |
| May 2004 | 0.9m | 35 | 0.019 | 0.112 | 3.258 | 0.106 | 0.238 | 3.596 | 0.002 0.011 | 0.004 0.015 |
| Jul 2012 | 0.9m | 36 | 0.022 | 0.111 | 2.825 | 0.101 | 0.204 | 3.172 | 0.001 0.010 | 0.001 0.008 |
| ID | Period | Class | ||||||||||
|---|---|---|---|---|---|---|---|---|---|---|---|---|
| (2000) | (2000) | (day) | (mag) | (mag) | (mag) | (mag) | (mag) | (mag) | (mag) | (mag) | ||
| (1) | (2) | (3) | (4) | (5) | (6) | (7) | (8) | (9) | (10) | (11) | (12) | (13) |
| V1 | 18:59:39.63 | 6:41:09.1 | 0.5384105 | 1.447 | 1.127 | 16.037 | 15.590 | 15.995 | 15.566 | 15.558 | 0.431 | RRab Bl |
| V2 | 18:59:44.56 | 36:39:08.8 | 0.5035381 | 1.727 | 1.342 | 15.874 | 15.482 | 15.740 | 15.407 | 15.381 | 0.357 | RRab |
| V3 | 18:59:12.97 | 36:37:46.2 | 0.4940991 | 1.663 | 1.245 | 15.889 | 15.497 | 15.783 | 15.440 | 15.421 | 0.363 | RRab |
| V4 | 18:59:34.71 | 36:36:34.7 | 0.4510559 | 1.633 | 1.288 | 15.890 | 15.517 | 15.768 | 15.449 | 15.427 | 0.341 | RRab |
| V5 | 18:59:32.99 | 36:37:01.5 | 0.5776827 | 1.083 | 0.797 | 15.945 | 15.491 | 15.897 | 15.466 | 15.457 | 0.436 | RRab Bl? |
| V6 | 18:59:33.91 | 36:37:05.3 | 0.4791830 | 1.528 | 1.170 | 15.882 | 15.494 | 15.782 | 15.438 | 15.419 | 0.360 | RRab Bl? |
| V7 | 18:59:49.77 | 36:39:01.0 | 0.3076709 | 0.652 | 0.513 | 15.857 | 15.525 | 15.838 | 15.514 | 15.510 | 0.323 | RRc |
| V8 | 18:59:34.68 | 36:37:42.4 | 0.4802776 | 1.716 | 1.326 | 15.874 | 15.475 | 15.761 | 15.415 | 15.394 | 0.366 | RRab Bl |
| V9 | 18:59:39.50 | 36:37:34.5 | 0.5757466 | 1.667 | 1.230 | 15.810 | 15.376 | 15.747 | 15.345 | 15.334 | 0.411 | RRab Bl |
| V10 | 18:59:45.70 | 36:36:27.4 | 0.2523218 | 0.648 | 0.471 | 15.731 | 15.476 | 15.713 | 15.466 | 15.463 | 0.247 | RRc Bl |
| V11 | 18:59:44.53 | 36:34:02.1 | 0.5342927 | 1.285 | 0.989 | 15.925 | 15.497 | 15.856 | 15.461 | 15.449 | 0.405 | RRab |
| V12 | 18:59:37.08 | 36:38:36.5 | 0.4687582 | 1.702 | 1.261 | 15.921 | 15.535 | 15.803 | 15.472 | 15.453 | 0.354 | RRab |
| V13 | 18:59:29.49 | 36:39:02.8 | 0.5065254 | 1.536 | 1.196 | 15.996 | 15.595 | 15.929 | 15.560 | 15.548 | 0.380 | RRab Bl |
| V14bbSee Appendix A | 18:59:30.22 | 36:38:34.3 | 0.6308439 | 1.102 | 0.869 | 15.727 | 15.279 | 15.681 | 15.255 | 15.247 | 0.430 | RRab |
| V15bbSee Appendix A | 18:59:25.57 | 36:35:06.3 | 0.4353677 | 1.662 | 1.268 | 15.770 | 15.415 | 15.628 | 15.338 | 15.311 | 0.317 | RRab |
| V16bbSee Appendix A | 18:59:29.46 | 36:36:19.9 | 0.6962724 | 1.178 | 0.884 | 15.774 | 15.324 | 15.728 | 15.300 | 15.292 | 0.432 | RRab |
| V17 | 18:59:36.96 | 36:39:33.5 | 0.5301725 | 1.346 | 1.026 | 15.976 | 15.549 | 15.898 | 15.509 | 15.495 | 0.402 | RRab |
| V18 | 18:59:21.88 | 36:38:13.3 | 0.5264541 | 1.627 | 1.247 | 15.923 | 15.504 | 15.854 | 15.467 | 15.456 | 0.396 | RRab Bl |
| V19 | 18:59:19.26 | 36:39:47.5 | 0.5347107 | 1.327 | 1.022 | 15.919 | 15.498 | 15.862 | 15.466 | 15.456 | 0.402 | RRab Bl |
| V20 | 18:59:33.67 | 36:37:13.9 | 0.4874793 | 1.769 | 1.312 | 15.799 | 15.426 | 15.702 | 15.374 | 15.356 | 0.346 | RRab Bl |
| V21 | 18:59:26.79 | 36:38:22.9 | 0.5919537 | 1.110 | 0.843 | 15.884 | 15.439 | 15.836 | 15.414 | 15.405 | 0.427 | RRab |
| V22 | 18:59:27.39 | 36:37:17.4 | 0.3087057 | 0.741 | 0.561 | 15.848 | 15.511 | 15.828 | 15.499 | 15.495 | 0.328 | RRc Bl |
| V23 | 18:59:37.83 | 36:38:05.0 | 0.6248439 | 0.639 | 0.475 | 15.961 | 15.490 | 15.945 | 15.482 | 15.479 | 0.459 | RRab Bl? |
| V24 | 18:59:43.13 | 36:39:45.0 | 0.3001437 | 0.682 | 0.511 | 15.832 | 15.512 | 15.812 | 15.501 | 15.497 | 0.311 | RRc |
| V25 | 18:59:16.92 | 36:35:20.3 | LPV | |||||||||
| V26 | 18:59:41.54 | 36:34:32.2 | LPV | |||||||||
| V27 | 18:59:15.11 | 36:36:14.5 | 0.6192392 | 0.859 | 0.663 | 15.871 | 15.425 | 15.842 | 15.410 | 15.405 | 0.432 | RRab Bl? |
| V28 | 18:59:34.25 | 36:39:12.8 | 0.4868633 | 1.514 | 1.180 | 15.910 | 15.511 | 15.811 | 15.458 | 15.440 | 0.370 | RRab |
| V29 | 18:59:34.39 | 36:36:51.5 | 0.4988830 | 1.565 | 1.188 | 15.898 | 15.493 | 15.795 | 15.438 | 15.420 | 0.376 | RRab |
| V30 | 19:00:01.57 | 36:37:05.6 | LPV | |||||||||
| V31 | 18:59:28.07 | 36:38:51.9 | 0.6078313 | 0.972 | 0.704 | 15.932 | 15.478 | 15.898 | 15.461 | 15.455 | 0.438 | RRab Bl |
| V32 | 18:59:29.87 | 36:39:27.1 | 0.2875411 | 0.536 | 0.433 | 15.672 | 15.403 | 15.659 | 15.395 | 15.392 | 0.262 | RRc |
| NV1aaProbable non-member. | 18:59:30.27 | 36:38:02.3 | 0.2853927 | 0.424 | 0.315 | 15.135 | 14.736 | 15.128 | 14.732 | 14.731 | 0.392 | RRc |
| NV2 | 18:59:33.19 | 36:37:58.1 | 0.5314143 | 1.563 | 1.186 | 15.743 | 15.351 | 15.650 | 15.303 | 15.286 | 0.364 | RRab Bl |
| NV3 | 18:59:32.97 | 36:38:01.5 | 0.6064508 | 0.692 | 0.534 | 15.846 | 15.365 | 15.834 | 15.358 | 15.356 | 0.471 | RRab Bl |
| NV4 | 18:59:29.31 | 36:37:51.2 | 0.4639525 | 1.621 | 1.388 | 15.829 | 15.436 | 15.741 | 15.380 | 15.361 | 0.372 | RRab Bl |
| NV5 | 18:59:30.79 | 36:37:44.8 | 0.5363784 | 1.375 | 1.065 | 15.866 | 15.439 | 15.806 | 15.408 | 15.397 | 0.407 | RRab Bl |
| NV6 | 18:59:30.18 | 36:37:45.0 | 0.5719616 | 1.235 | 0.914 | 15.890 | 15.449 | 15.833 | 15.420 | 15.410 | 0.420 | RRab |
| NV7 | 18:59:35.79 | 36:37:23.2 | 0.2540772 | 0.679 | 0.481 | 15.736 | 15.452 | 15.721 | 15.443 | 15.440 | 0.277 | RRc |
| NV8 | 18:59:35.67 | 36:37:52.2 | 0.5965565 | 0.959 | 0.810 | 15.973 | 15.511 | 15.939 | 15.493 | 15.485 | 0.446 | RRab Bl |
| NV9 | 18:59:40.50 | 36:38:08.9 | 0.6592001 | 0.491 | 0.399 | 16.000 | 15.512 | 15.996 | 15.509 | 15.508 | 0.480 | RRab Bl |
| NV10 | 18:59:32.03 | 36:37:40.4 | 0.5528632 | 1.441 | 1.109 | 15.963 | 15.536 | 15.894 | 15.500 | 15.488 | 0.404 | RRab Bl |
| NV11 | 18:59:30.98 | 36:38:32.4 | 0.3345803 | 0.759 | 0.653 | 15.885 | 15.554 | 15.865 | 15.542 | 15.538 | 0.323 | RRc Bl |
| NV12 | 18:59:32.35 | 36:37:52.0 | 0.4400748 | 1.813 | 1.402 | 15.944 | 15.571 | 15.802 | 15.494 | 15.467 | 0.334 | RRab |
| NV13 | 18:59:35.38 | 36:38:24.1 | 0.4893353 | 1.621 | 1.245 | 15.993 | 15.601 | 15.913 | 15.558 | 15.543 | 0.367 | RRab Bl |
| NV14 | 18:59:55.06 | 36:37:31.0 | 0.6121545 | 0.618 | 0.468 | 16.138 | 15.630 | 16.122 | 15.621 | 15.618 | 0.497 | RRab |
| NV15a,ca,cfootnotemark: | 18:59:03.16 | 36:44:09.1 | 0.3096517 | 0.307 | 0.305 | 16.354 | 15.630 | 16.351 | 15.628 | EB | ||
| NV16a,da,dfootnotemark: | 18:59:24.93 | 36:45:58.4 | 0.0489877 | 0.413 | 0.290 | 16.723 | 16.418 | 16.718 | 16.415 | Sct | ||
| NV17a,ca,cfootnotemark: | 18:59:51.09 | 36:42:06.5 | 0.3777837 | 0.225 | 0.229 | 17.297 | 16.591 | 17.295 | 16.590 | EB | ||
| NV18a,da,dfootnotemark: | 18:59:25.14 | 36:36:59.5 | 0.0520890 | 0.503 | 0.426 | 16.919 | 16.625 | 16.912 | 16.622 | Sct | ||
| NV19 | 18:59:41.07 | 36:38:01.7 | 0.0531436 | 0.450 | 0.409 | 17.969 | 17.645 | 17.964 | 17.642 | SX Phe | ||
| NV20a,ca,cfootnotemark: | 19:00:06.84 | 36:47:32.7 | 0.3605305 | 0.356 | 0.296 | 18.411 | 17.763 | 18.407 | 17.760 | EB | ||
| NV21a,ca,cfootnotemark: | 19:00:07.87 | 36:47:52.3 | 0.2796234 | 0.723 | 0.589 | 19.620 | 18.448 | 19.605 | 18.437 | EB | ||
| NV22a,ca,cfootnotemark: | 18:59:55.12 | 36:48:18.8 | 0.3274661 | 0.396 | 0.375 | 19.494 | 18.736 | 19.491 | 18.732 | EB |
| ID | ||||||||
|---|---|---|---|---|---|---|---|---|
| RRab | ||||||||
| V1 | 0.252 | 0.440 | 0.278 | 0.220 | 2.439 | 5.593 | 2.207 | 18.439 |
| V2 | 0.451 | 0.493 | 0.330 | 0.243 | 2.344 | 5.037 | 1.381 | 1.412 |
| V3 | 0.389 | 0.510 | 0.359 | 0.239 | 2.347 | 5.055 | 1.411 | 14.069 |
| V4 | 0.427 | 0.472 | 0.361 | 0.230 | 2.277 | 4.831 | 1.188 | 18.111 |
| V5 | 0.271 | 0.518 | 0.312 | 0.158 | 2.617 | 5.435 | 2.232 | 24.973 |
| V6 | 0.407 | 0.451 | 0.267 | 0.142 | 2.380 | 4.968 | 1.394 | 10.926 |
| V8 | 0.369 | 0.410 | 0.065 | 0.091 | 2.229 | 4.597 | 3.607 | 50.505 |
| V9 | 0.282 | 0.507 | 0.282 | 0.109 | 2.406 | 5.050 | 1.971 | 22.492 |
| V11 | 0.325 | 0.482 | 0.343 | 0.216 | 2.396 | 5.126 | 1.679 | 17.202 |
| V12 | 0.413 | 0.481 | 0.344 | 0.226 | 2.274 | 4.918 | 1.248 | 0.950 |
| V13 | 0.319 | 0.479 | 0.278 | 0.175 | 2.325 | 5.080 | 1.603 | 0.939 |
| V14 | 0.268 | 0.506 | 0.314 | 0.162 | 2.686 | 5.606 | 2.294 | 1.008 |
| V15 | 0.460 | 0.493 | 0.312 | 0.183 | 2.281 | 4.833 | 1.238 | 17.017 |
| V16 | 0.269 | 0.485 | 0.236 | 0.120 | 2.638 | 5.601 | 2.155 | 10.902 |
| V17 | 0.335 | 0.509 | 0.345 | 0.230 | 2.333 | 5.022 | 1.406 | 0.882 |
| V18 | 0.308 | 0.386 | 0.235 | 0.106 | 2.149 | 4.924 | 1.191 | 1.313 |
| V19 | 0.306 | 0.452 | 0.273 | 0.160 | 2.471 | 5.328 | 2.058 | 22.344 |
| V20 | 0.395 | 0.400 | 0.180 | 0.139 | 2.656 | 5.362 | 2.248 | 20.279 |
| V21 | 0.271 | 0.519 | 0.324 | 0.176 | 2.549 | 5.381 | 2.120 | 21.720 |
| V23 | 0.169 | 0.368 | 0.183 | 0.079 | 2.682 | 5.727 | 2.458 | 1.784 |
| V27 | 0.225 | 0.405 | 0.210 | 0.074 | 2.657 | 5.497 | 2.523 | 94.705 |
| V28 | 0.371 | 0.514 | 0.370 | 0.227 | 2.400 | 5.011 | 1.321 | 1.467 |
| V29 | 0.393 | 0.479 | 0.357 | 0.222 | 2.338 | 5.019 | 1.345 | 1.777 |
| V31 | 0.233 | 0.458 | 0.290 | 0.132 | 2.635 | 5.540 | 2.339 | 1.108 |
| NV2 | 0.377 | 0.448 | 0.239 | 0.165 | 2.487 | 5.296 | 1.769 | 2.522 |
| NV3 | 0.149 | 0.381 | 0.182 | 0.021 | 2.814 | 5.952 | 3.041 | 1.710 |
| NV4 | 0.380 | 0.466 | 0.204 | 0.106 | 2.470 | 4.859 | 1.775 | 16.479 |
| NV5 | 0.292 | 0.471 | 0.318 | 0.184 | 2.277 | 4.896 | 1.251 | 1.322 |
| NV6 | 0.291 | 0.505 | 0.306 | 0.187 | 2.551 | 5.361 | 2.046 | 1.142 |
| NV8 | 0.242 | 0.487 | 0.278 | 0.096 | 2.624 | 5.745 | 2.316 | 22.940 |
| NV10 | 0.318 | 0.530 | 0.347 | 0.200 | 2.492 | 5.332 | 1.804 | 0.920 |
| NV12 | 0.453 | 0.496 | 0.363 | 0.232 | 2.235 | 4.705 | 1.062 | 1.285 |
| NV13 | 0.349 | 0.421 | 0.194 | 0.140 | 2.298 | 5.078 | 1.883 | 2.858 |
| NV14 | 0.171 | 0.382 | 0.190 | 0.068 | 2.617 | 5.431 | 2.574 | 0.518 |
| RRc | ||||||||
| V7 | 0.216 | 0.083 | 0.069 | 0.015 | 3.337 | 1.024 | 4.185 | |
| V10 | 0.203 | 0.134 | 0.058 | 0.011 | 3.164 | 5.612 | 2.531 | |
| V22 | 0.214 | 0.083 | 0.101 | 0.023 | 2.998 | 0.720 | 4.092 | |
| V24 | 0.220 | 0.117 | 0.066 | 0.037 | 3.048 | 0.401 | 4.066 | |
| V32 | 0.181 | 0.115 | 0.070 | 0.001 | 3.156 | 6.271 | 5.240 | |
| NV7 | 0.190 | 0.126 | 0.035 | 0.061 | 3.096 | 5.505 | 3.119 | |
| NV11 | 0.217 | 0.069 | 0.070 | 0.068 | 3.925 | 1.080 | 4.168 | |
| ID | [Fe/H]aaZinn & West metallicity scale. | bbUsing . | ccSee Appendix D. | ddSee Appendix C. | ddUsing Equation (14). | eeUsing Equation (21). | ffUsing Equation (18) with = 0.36. | ffUsing Equation (18) with = 0.36. | ||
|---|---|---|---|---|---|---|---|---|---|---|
| (1) | (2) | (3) | (4) | (5) | (6) | (7) | (8) | (9) | (10) | (11) |
| V2 | 1.299 | 0.306 | 0.087 | 0.051 | 0.822 | 14.390 | 0.066 | 14.255 | 0.519 | 14.690 |
| V12 | 1.280 | 0.309 | 0.078 | 0.047 | 0.876 | 14.403 | 0.020 | 14.294 | 0.616 | 14.660 |
| V13 | 1.270 | 0.331 | 0.071 | 0.049 | 0.885 | 14.480 | 0.099 | 14.412 | 0.618 | 14.744 |
| V14ggSee Appendix A | 1.244 | 0.362 | 0.086 | 0.070 | 0.790 | 14.270 | 0.309 | 14.176 | 0.494 | 14.563 |
| V17 | 1.414 | 0.334 | 0.093 | 0.070 | 0.838 | 14.476 | 0.153 | 14.338 | 0.584 | 14.727 |
| V18 | 1.492 | 0.334 | 0.084 | 0.060 | 0.846 | 14.427 | 0.169 | 14.341 | 0.585 | 14.684 |
| V23 | 1.108 | 0.378 | 0.092 | 0.081 | 0.858 | 14.429 | 0.318 | 14.343 | 0.573 | 14.711 |
| V28 | 1.261 | 0.321 | 0.078 | 0.052 | 0.880 | 14.383 | 0.063 | 14.284 | 0.630 | 14.630 |
| V29 | 1.298 | 0.319 | 0.086 | 0.060 | 0.854 | 14.390 | 0.078 | 14.262 | 0.587 | 14.654 |
| V31 | 1.220 | 0.365 | 0.088 | 0.074 | 0.832 | 14.434 | 0.273 | 14.329 | 0.551 | 14.711 |
| NV2 | 1.161 | 0.320 | 0.072 | 0.040 | 0.845 | 14.263 | 0.117 | 14.205 | 0.512 | 14.592 |
| NV3 | 0.827 | 0.380 | 0.101 | 0.092 | 0.916 | 14.247 | 0.248 | 14.115 | 0.617 | 14.542 |
| NV5 | 1.556 | 0.343 | 0.085 | 0.066 | 0.837 | 14.376 | 0.189 | 14.270 | 0.606 | 14.604 |
| NV6 | 1.253 | 0.348 | 0.093 | 0.074 | 0.836 | 14.389 | 0.204 | 14.257 | 0.551 | 14.670 |
| NV10 | 1.208 | 0.341 | 0.086 | 0.066 | 0.847 | 14.458 | 0.175 | 14.352 | 0.565 | 14.736 |
| NV12 | 1.372 | 0.297 | 0.074 | 0.039 | 0.875 | 14.424 | 0.036 | 14.308 | 0.639 | 14.656 |
| NV13 | 1.207 | 0.317 | 0.074 | 0.044 | 0.894 | 14.469 | 0.037 | 14.383 | 0.594 | 14.766 |
| NV14 | 1.339 | 0.376 | 0.133 | 0.122 | 0.844 | 14.582 | 0.284 | 14.328 | 0.589 | 14.834 |
| Mean | 1.267 | 0.087 | 0.064 | 0.854 | 14.405 | 14.292 | 0.579 | 14.676 | ||
| 0.156 | 0.014 | 0.021 | 0.029 | 0.083 | 0.074 | 0.041 | 0.074 | |||
| MeanhhWithout V13, V14, V18, NV2, NV3, NV5, NV13 and NV14. | 1.271 | 0.086 | 0.061 | 0.852 | 14.418 | 14.302 | 0.581 | 14.684 | ||
| hhWithout V13, V14, V18, NV2, NV3, NV5, NV13 and NV14. | 0.086 | 0.007 | 0.014 | 0.020 | 0.032 | 0.037 | 0.038 | 0.036 |
| ID | [Fe/H] | |||
|---|---|---|---|---|
| V7 | 0.879 | 0.804 | 14.710 | 14.515 |
| V10 | 1.216 | 0.870 | 14.596 | 14.401 |
| V22 | 1.119 | 0.810 | 14.689 | 14.494 |
| V24 | 1.217 | 0.802 | 14.699 | 14.504 |
| V32 | 1.307 | 0.845 | 14.550 | 14.355 |
| NV7 | 1.298 | 0.829 | 14.614 | 14.419 |
| NV11 | 1.214 | 0.701 | 14.841 | 14.646 |
| Mean | 1.179 | 0.809 | 14.671 | 14.476 |
| 0.146 | 0.053 | 0.096 | 0.096 | |
| MeanaaWithout V10, V22 and NV11. | 1.175 | 0.820 | 14.643 | 14.448 |
| aaWithout V10, V22 and NV11. | 0.202 | 0.021 | 0.076 | 0.076 |
| Method | (kpc) | ||
|---|---|---|---|
| Fourier (RRab)aaApplying the zero-point correction term, 0.270 0.020 mag, in Equation (14). | 14.681 0.038 | 0.063 | 8.63 0.15 |
| Fourier (RRab)bbApplying the zero-point correction term using = 0.36 mag in Equation (18). | 14.684 0.036 | 0.063 | 8.65 0.14 |
| Fourier (RRc)ccUsing . | 14.648 0.076 | 0.063 | 8.50 0.31 |
| aaApplying the zero-point correction term, 0.270 0.020 mag, in Equation (14). | 14.572 0.042 | 8.21 0.16 | |
| ddApplying the zero-point correction term, 0.080 0.130 mag. | 14.610 0.131 | 8.36 0.50 | |
| 14.686 0.143 | 0.063 | 8.65 0.57 | |
| Mean | 14.647 0.047 | 8.47 0.17 |
| ID | (″) | (kpc) | Note | ||||
|---|---|---|---|---|---|---|---|
| NV19 | 95 | 2.667 | 0.215 | 0.109 | 14.638 | 8.46 | Member |
| NV16 | 495 | 2.476 | 0.233 | 0.072 | 13.939 | 6.14 | Non-member |
| NV18 | 111 | 2.399 | 0.237 | 0.057 | 14.001 | 6.31 | Non-member |
| ID | (″) | (kpc) | Note | ||
|---|---|---|---|---|---|
| NV15 | 521 | 4.377 | 11.056 | 1.63 | Non-member |
| NV17 | 332 | 3.939 | 12.456 | 3.10 | Non-member |
| NV20 | 706 | 3.854 | 13.711 | 5.52 | Non-member |
| NV21 | 729 | 5.926 | 12.315 | 2.90 | Non-member |
| NV22 | 678 | 4.372 | 14.165 | 6.80 | Non-member |