The circumnuclear environment of NGC 613: a nuclear starburst caught in the act?
Abstract
We present near-infrared (- and -band) integral-field observations of the inner 700 pc of the active spiral galaxy NGC 613, obtained with SINFONI on the Very Large Telescope. We use emission-line ratios to determine the dominant excitation mechanisms in different regions within our field-of-view, in particular the active nucleus and the star-forming circum-nuclear ring. Diagnostic diagrams involving and fluxes indicate that the gas is not only photoionized by the AGN in the nucleus of NGC 613, but also shock-heated. On the other hand, the emission line ratios measured in the “hot spots” along the ring are fully consistent with them being young star forming regions. We find no sign of radial gas transport from the ring into the core region dominated by the AGN. The ring morphology appears disturbed by a radial outflow of material from the AGN, which is confirmed by the existence of a weak jet in archival radio maps. However, this jet does not seem to have any significant effect on the morphology of the large (810) reservoir of molecular gas that has accumulated inside the central 100 pc. Such a concentration of molecular gas around an AGN is unusual, and supports a scenario in which star formation is recurrent and episodic in spiral galaxies. In this context, NGC 613 appears to be in final stages of the gas accumulation phase, and is likely to undergo a nuclear starburst in the near future.
keywords:
galaxies: nuclei — galaxies: active — galaxies: ISM — galaxies: individual (NGC 613)1 INTRODUCTION
The question of whether and how the morphology of galaxies evolves over time is one of the most intensely debated questions in astrophysics. Understanding this secular evolution requires a detailed theory for the origin and fate of the various components found in the central regions of galaxies, such as a super-massive black hole (SMBH), a compact nuclear star cluster, stellar bar, star-forming rings, and a (pseudo)bulge. Despite numerous theoretical studies (see Hopkins et al., 2006, and references therein) and large-scale observational programs (e.g. Kennicutt et al., 2003; Dale et al., 2004; de Zeeuw et al., 2002; Abazajian et al., 2009; Cappellari et al., 2011), a complete understanding of how these various features form, evolve, or influence each other, remains elusive. The problem is exacerbated by the fact that some (if not many) of these features are likely transient, and thus may no longer be obvious in observations, even though the consequences of their past existence still are.
Circumnuclear star formation in disk galaxies is a good example of a highly time-variable phenomenon which is both an agent for and an indicator of secular evolution. The high gas densities required to initiate and maintain star formation in the central few hundred pc are the result of inward radial transport of large amounts of gas (e.g. Simkin et al., 1980; Combes & Gerin, 1985; Athanassoula, 1994; Knapen et al., 1995). Over time, the newly formed stars can alter the appearance of the galaxy, in that they contribute to the prominence of a (pseudo-)bulge (e.g. Kormendy & Kennicutt, 2004).
The star formation history of the nuclear region of galaxies seems to be also tightly linked to the properties of their central engines, i.e. active galactic nuclei (AGN). This has been widely investigated over the last decade from a number of observational studies which link dynamical or structural properties of the galaxy as a whole to those of the SMBH (e.g. Ferrarese & Merritt, 2000; Gebhardt et al., 2000; Graham et al., 2001; Novak et al., 2006; Shapiro et al., 2006; Bandara et al., 2009; Kormendy & Bender, 2009; Krajnovic et al., 2013). Taken together, these results make it clear that the growth of SMBHs and the evolution of the central few of the galaxy influence each other and thus cannot be interpreted independently.
While some qualitative theoretical explanations have been proposed (e.g. McLaughlin et al., 2006), a detailed understanding of how star formation and AGN activity depend on each other is still lacking. This is hardly surprising, given that both star formation and AGN activity are highly time-dependent phenomena, and that any one galaxy can offer only a snapshot view of this time dependence. It is therefore desirable to observe as many galactic nuclei as possible with sufficient spatial resolution to separate the circumnuclear star formation activity from the central engine. Such observations are challenging because very often, the complex dust structures and resulting high extinction values make it necessary to use infrared or radio wavelengths in order to reveal the sites of active star formation (a.k.a. “hot spots”), and their properties. In addition, it is desirable to not only derive the morphology of the various tracers of star formation, but also their kinematics in order to get a sense for the timescales involved.
Near-infrared integral field spectroscopy is the ideal tool for such studies. When used with modern 8m-class telescopes, it offers a combination of high sensitivity, high spatial resolution, and full spectroscopic information over the field of view. In this paper, we present VLT/SINFONI observations of NGC 613, a barred spiral galaxy with Hubble type Sbc at a distance of . The projected spatial scale at that distance is 84.8 parsec per arcsec. NGC 613 was classified as a composite object by Veron-Cetty & Veron (1986) based on its low-resolution optical spectrum (Seyfert/Hii), and it was confirmed as an AGN using mid-infrared spectroscopy (Goulding & Alexander, 2009). NGC 613 is part of a small sample of spirals with kpc-scale star-forming rings discussed in Böker et al. (2008, hereafter paper I), and some aspects of the data have already been presented there. Here, we use the data to give a detailed account of the physical conditions of stars and gas (both molecular and ionized) in the central , with the aim of illuminating the mutual feedback between circumnuclear star formation and nuclear activity.
The paper is structured as follows. In section 2 we present a brief outline of the observations and instrumental setup. Section 3 introduces the morphology of the stellar continuum and some emission-lines, while §4 describes the location of the aperture spectra extracted for our analysis. We focus on the properties of the stellar component in the nucleus and along the ring in §5. The details on the derived extinction for each aperture are presented in §6. We discuss the physical state of the gas in the circumnuclear region in §7 and investigate the possible connection between the nucleus and the star-forming ring in §8. Finally, we summarise our results in §9.
2 OBSERVATIONS & DATA REDUCTION
2.1 Integral-field data
The near-infrared data analysed in this paper are part of the data set described in paper I. Briefly, we used the SINFONI integral-field spectrograph at the European Southern Observatory Very Large Telescope (Program ID: 076.B-0646A) to observe a sample of five spiral galaxies with compact, star-forming circumnuclear rings selected from the imaging survey of Knapen et al. (2006). In its seeing-limited mode (i.e. without the aid of adaptive optics), SINFONI enables two-dimensional spectroscopy over a field-of-view of , and a spatial sampling of . We used the SINFONI configuration for simultaneous spectra which yields a spectral resolution of . The total on-source integration time for NGC 613 was 2.5 hours, divided in five identical observing blocks that were obtained over the course of five nights in Oct./Nov. 2005. Average seeing during our observations was approximately 05. The raw data were corrected for sky background, detector dark current, and cosmic rays using standard methods. Flux calibration was performed using standard stars obtained routinely during each observing night. A detailed description of the data reduction and flux calibration procedures can be found in paper I.
2.2 Radio data
In addition to the integral-field data, and in order to confirm the presence of a jet (based on our maps, see §3), we have searched the Very Large Array (VLA) archives for radio observations. The archival C band (4.86 GHz) observations (project AH231) first published by Hummel & Jorsater (1992) were done in A and B configuration in 1986. We reduced the two datasets using the standard routines in AIPS (Greisen, 1990). The quasars 3C84 and 0142-278 served as flux and phase calibrator, respectively. The combined datasets have a resolution of 088046 with a PA of 0.99∘ using robust weighting and a pixel scale of 01 per pixel. We CLEANed the data using a single CLEANing box and a flux limit of 1.5. The resulting map has an rms of about 17 Jy/beam.
2.3 Hubble Space Telescope imaging data
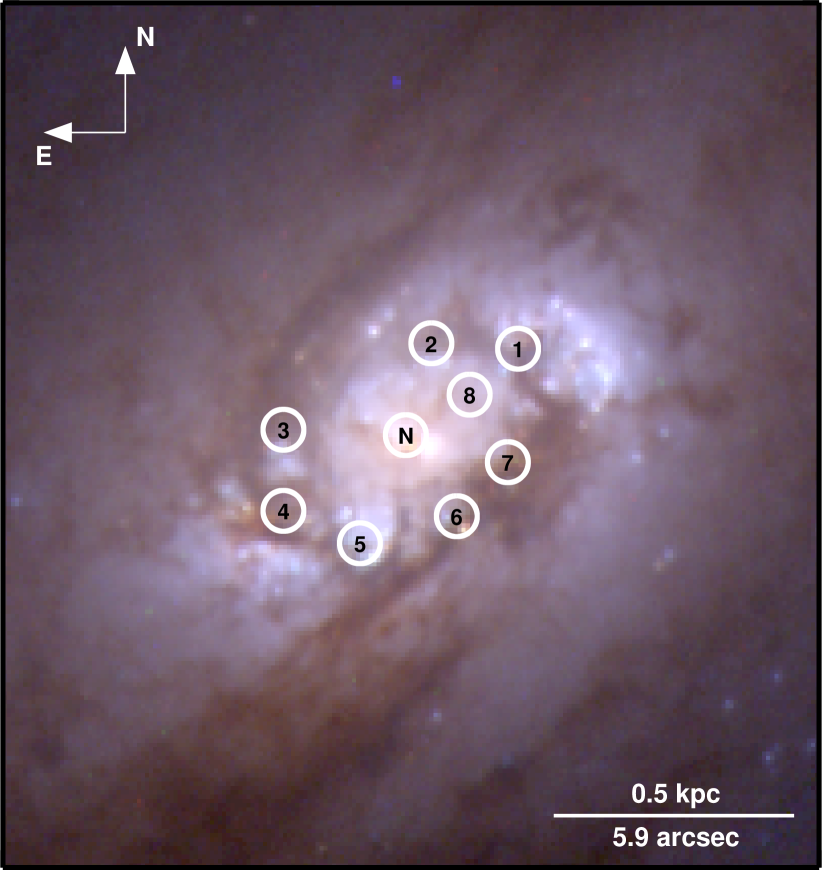
In order to get the highest spatial resolution view of the inner regions of NGC 613, we retrieved from the Hubble Legacy Archive (http://hla.stsci.edu) WFPC2 data for the F450W, F606W, and F814W filters. The dataset is part of the proposal number 9042 (PI: Stephen Smartt) aimed at detecting the progenitors of massive, core-collapse supernovae. Figure 1 shows a colour composite image (F450W, F606W, F814W) of the nuclear region of NGC 613. For reference we indicate the main apertures used for the analysis in this paper.
3 MORPHOLOGY OF THE CENTRAL REGION
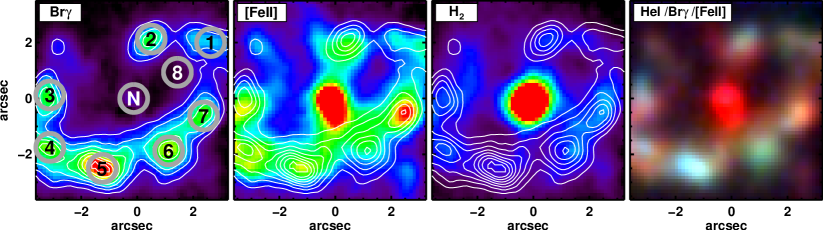
In order to set the stage for the following discussion, we present in Fig. 2 a number of maps that define the morphology in the central () of NGC 613. They are used here to identify the individual ”hot spots” in the NGC 613 ring that will be analysed in more detail using aperture spectra presented in §4.
Maps for the three emission lines (m), (m), and Br (m) have already been presented in paper I. As described there, the line maps were generated by summing all spectral channels over the width of the respective emission line, and subtracting a continuum image obtained by averaging neighbouring channels on either side. This method is equivalent to obtaining narrow band images centred on the line and the blue and red continuum, respectively. A number of grey circles in the Br map denote diameter apertures centred on the various “hot spots” in the ring, one centred on the nucleus, and another one on a “empty” region.
The three emission-line maps clearly reveal a ring-like morphology composed by seven stellar clusters. The nucleus presents high and flux levels, compared to Br which is significantly weaker. The flux distribution in the centre, however, seems somewhat more elongated than the fairly spherical morphology. As already noted in paper I, there appears to be a gap in the NW of the ring. This is conspicuous in all the three near-IR (hereafter NIR) line maps, as well as the radio maps shown in Fig. 8. Interestingly, two plumes of material seem to extend from the nucleus all the way out to the edges of the gap. We believe these features are related to the presence of a radio outflow already noted by Hummel et al. (1987) and Hummel & Jorsater (1992) (see §8.1).
The last panel in Fig. 2 displays a composite colour image produced by combining the (blue), Br (green) and (red) emission lines. This image illustrates the pearls on a string scenario proposed in paper I for the evolution of star formation of the hot spots in NGC 613 ring, in which the hot spots age as they move along the ring away from the over-density region.
4 NEAR-INFRARED SPECTRA
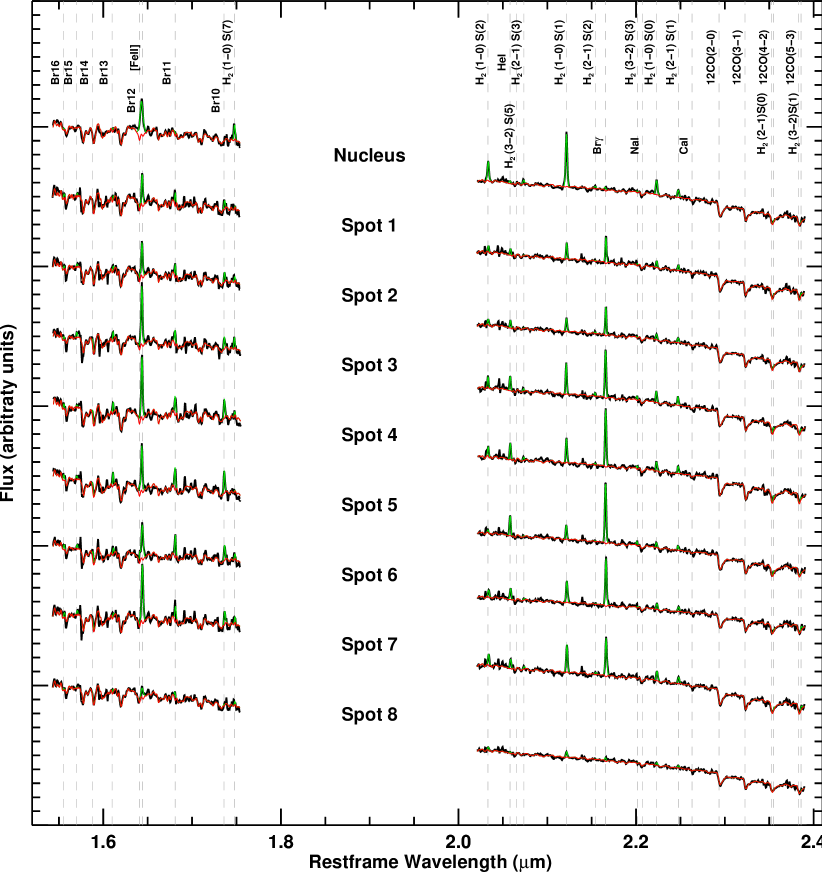
In order to perform a more detailed analysis of the central region of NGC 613, we have extracted - and -band spectra for the apertures indicated in Fig. 1 and the Br map in Fig. 2. The spectra are presented in Fig. 3. Their flux calibration is accurate to within 15% as discussed in paper I.
We have performed a quantitative analysis of the emission line fluxes and kinematics, and made an effort to decompose the spectra into the stellar continuum and the “pure” emission line spectrum. For this, we made use of the GANDALF package (Sarzi et al., 2006). The software performs a simultaneous least-squares fit to both the stellar continuum and emission lines. The stellar continuum is described using theoretical spectra of red giants and supergiants which dominate the NIR emission of evolved stellar populations and star-forming regions, respectively. We made use of the library of theoretical model spectra by Lançon et al. (2007). The spectra used for our fits have solar abundances, and cover a range of effective temperatures (Teff=2900–5900 K) and gravity (log(g)=0–2). The models were re-binned to match the resolution of the data. The emission lines are treated simply as Gaussian templates. Their fluxes were left unconstrained during the fitting process, so that the amount of extinction could be estimated. The exact peak position and the width of the line were determined independently from those of the Hydrogen Brackett-series and the different transitions of the H2 molecule. For the latter, however, the different lines in each series were forced to share the same kinematics, i.e., line-of-sight velocity and velocity dispersion, as they did not show any substantial differences. Given the instrumental resolution of our data (), most of the emission lines are unresolved, with the exception of the line. Uncertainties in the different line fluxes have been determined by generating 100 Monte Carlo realisations of the input spectra. We achieved this by perturbing our input spectra with white noise using the amplitude of the residuals from our spectral fits with GANDALF as an estimate of their variance.
Tables 1 and 2 summarize the results of the emission-line analysis for all nine apertures. We list all lines that are detected with a minimum signal-to-noise ratio of 3.
5 THE STELLAR COMPONENT
To our knowledge the only work measuring CO line-strengths in detail in NGC 613 is that of James & Seigar (1999). In their study they placed several slits across different locations of the galaxy: the nuclear region and one of the spiral arms. One of the main findings in their paper was the fact that in the spiral arm the measured CO line-strength (using the Doyon et al. 1994 definition of the index) was significantly lower than that expected from old stellar populations. Ruling out metallicity and extremely young stellar populations as the causes for this CO depletion, dilution by host dust was their main argument to explain the observed CO values. The results on the circumnuclear region presented in their paper confirm the presence of a young population (up to 24% of the light in the -band) in the innermost 4′′, a fraction that decreases significantly as we move into the bulge dominated region (which is consistent with an old stellar population).
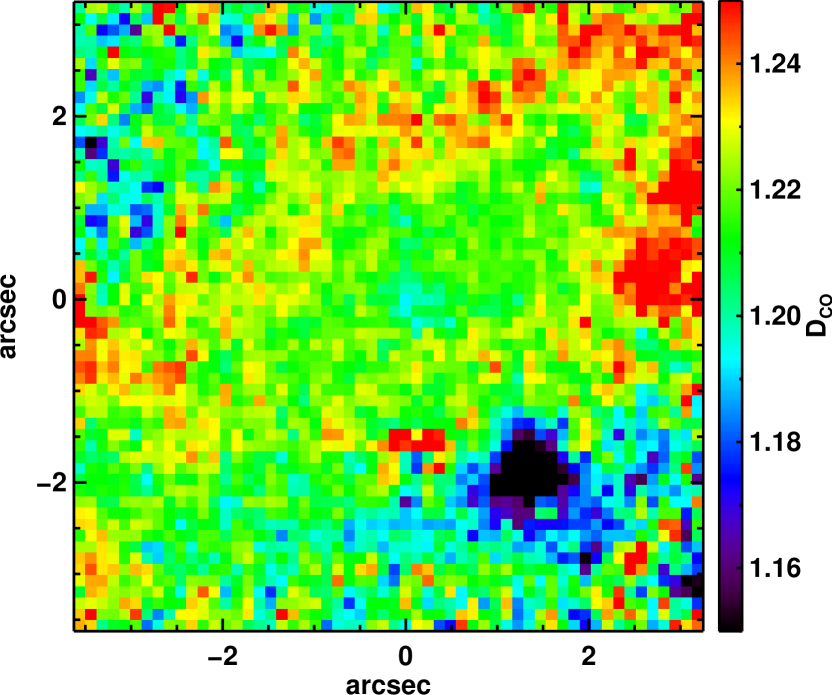
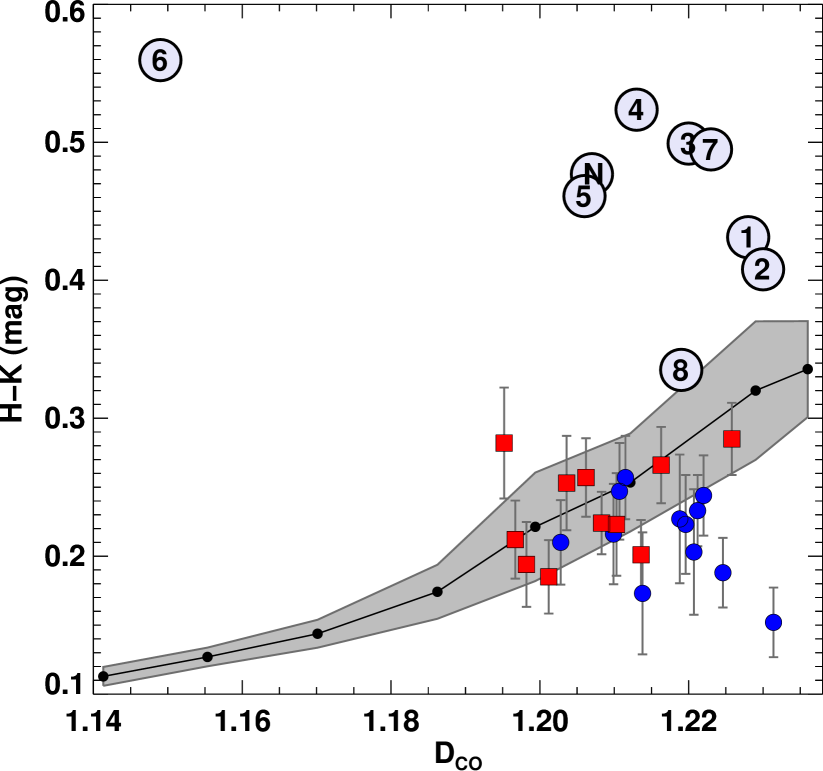
Here we make use of the CO line-strength index (DCO) developed by Mármol-Queraltó et al. (2008) to interpret our observations. This definition is better suited for the study of stellar populations than previous ones, as it is based on observations of a new intermediate resolution -band stellar library that exceeds the coverage of the stellar atmospheric parameters of previous works. It also has the advantage of being fairly independent on the broadening of the CO line, and thus avoiding often uncertain corrections. The index was measured over the aperture spectra using the INDEXF code (http://www.ucm.es/info/Astrof/software/indexf/) by Cardiel (2007).
In Fig. 4 we present the two dimensional distribution of the DCO index in the centre of NGC 613. The map reveals some level of structure. The North side of the ring has slightly enhanced CO absorption compared to the southern part, where the most star-forming hot spots are located. Spot 6 displays the lowest DCO value, as also evident from its spectrum in Fig. 3. Spot 6 is also the most heavily obscured region observed in the HST image presented in Fig. 1. The nucleus also displays a slightly lower DCO content compared to its surroundings.
Figure 5 shows the DCO measurements for the different apertures defined in Fig. 2. Given the high signal-to-noise of our aperture spectra, uncertainties in the DCO index are negligible and well below 0.01. Except for Spot 6 all the other regions have DCO values similar to those observed in the sample of field and cluster early-type galaxies of Mármol-Queraltó et al. (2009). This result may be somewhat unexpected, at least for the star-forming regions, given the marked difference between their integrated stellar populations and those of early-type galaxies. As illustrated in Mayya (1997) as well as by the Starburst99 predictions (Leitherer et al., 1999) the evolution with time of the CO equivalent width for instantaneous bursts of star formation exhibits several peaks at different phases (most prominently the red supergiant phase around 10 Myr). This behaviour makes it possible for such extremely different stellar populations to display similar DCO values. At the same time it highlights the complexity of modelling the stellar content of galaxies in this wavelength range alone.
On a side note, interestingly, Fig. 5 shows a fairly marked difference, well beyond the reported measurement errors, in the DCO content of field and cluster early-type galaxies. Mármol-Queraltó et al. (2009) interpret this difference as a signature of an excess of intermediate age, asymptotic giant branch (AGB) stars in the stellar light of field galaxies. An alternative explanation, also considered by these authors, is the environmental dependence of the carbon abundance. The similarity in the DCO values between the most actively star-forming regions in NGC 613 and those of field galaxies, with significantly older stellar populations, strongly supports the latter view that environment rather than AGB stars, plays an important role in the chemical enrichment of early-type galaxies (see also Carretero et al., 2004).
One of the discoveries in paper I was the age sequence (see the right-most panel of Fig. 2), formed by Spots 5, 6 and 7, along the southern side of the ring. As shown in this section, the complexity in understanding stellar populations at near-IR wavelengths makes it difficult to check whether the age gradient inferred from emission line ratios in paper I can be confirmed by the mean stellar ages of the hot spots. Nevertheless we refer the interested reader to Allard et al. (2006), Sarzi et al. (2007) and van der Laan et al. (2013) for examples of this kind of study in nearby galaxies with star-forming nuclear rings.
6 EXTINCTION CORRECTION
In this section we employ several methods to determine the amount of extinction in the inner regions of NGC 613. The list of emission-line fluxes for the different apertures, corrected for extinction, along with the computed AV values, are presented in Tables 1 and 2.
6.1 The Brackett decrement: Br/Br10
The flux ratio = Br/Br10 can be used to estimate the extinction within the SINFONI field of view, because the relative intensities of the hydrogen recombination lines for various gas densities and temperatures are well understood (e.g. Hummer & Storey 1987). Any deviation from the theoretical line ratio for a “standard” environment (case B, , and ) can then be used to infer the amount of visual extinction, using the Rieke & Lebofsky (1985) extinction law, along the line-of-sight as:
| (1) |
The measurement of AV using this method is only possible along the ring (i.e. Spots 1 to 7). Outside this area (Spot 8 and the nucleus), neither Br nor Br10 can be measured accurately enough to determine a reliable value. Extinction in the latter apertures was determined using the method outlined in the following section.
6.2 vs CO index
While the use of line ratios is a relatively straightforward method to estimate extinction, it is highly sensitive to the signal-to-noise ratio of the data. An alternative approach for those cases where the line ratios are not accessible is the use of colours and line-strength indices to obtain extinction values. The combination of a colour image, which is affected by dust, with a line index, largely insensitive to extinction (MacArthur, 2005) is a powerful method that has not been applied much in the literature, because of the lack of well-calibrated line strength data (see Ganda et al., 2009). By choosing the appropriate colour, this technique gives the colour excess in an almost model-independent way, which can easily be converted to AV.
In our case, we can measure the colour by integrating the flux in the spectra of each aperture within the given bandpass. From our colour map alone it is very difficult to determine the amount of extinction as it is not obvious how much of the colour is due to intrinsic stellar populations and how much comes from dust. Having two colours does not help a lot, since the effects of reddening in colour-colour diagrams is almost parallel to the effect of changing metallicity or age (e.g. Kuchinski et al., 1998).The most prominent absorption features in the - and -band spectra presented in Fig. 3 are the 12,13CO bandheads. Stellar population modelling has shown that the strength of these features reaches a maximum when the spectrum is dominated by red supergiants, typically 15 to 40 Myr after the birth of the population (Persson et al., 1983; Doyon et al., 1994; Rhoads, 1998). Several authors defined quantitative diagnostics in the NIR spectrum of evolved stars to discriminate between the different luminosity classes (e.g. Baldwin et al., 1973; Frogel et al., 1978; Kleinmann & Hall, 1986; Origlia et al., 1993; Doyon et al., 1994; Puxley et al., 1997; Förster Schreiber, 2000; Ryder et al., 2001; Riffel et al., 2007).
Figure 5 illustrates the method to estimate the extinction. We assume that in the absence of dust the regions should have similar colours to those predicted by the stellar templates of Lançon et al. (2007, shaded area in Fig. 5). The colour excess E(), the difference between data and the stellar spectra, is used in conjunction with the Rieke & Lebofsky (1985) extinction law to compute AV values. Since both the colour and DCO index are fairly insensitive to instrumental broadening, there is no need to degrade our data’s spectral resolution to match that of the theoretical stellar spectra. For reference we draw in the same figure the sample of field and cluster early-type galaxies of Mármol-Queraltó et al. (2009), which are expected to have very small colour excess.
In general the measurements obtained with the line ratios in §6.1 are a factor 2–5 larger than those derived here111Typical formal uncertainties in the extinction measured from the Br/Br10 ratio are around 2 mag whereas those associated with the method presented in this section are on the order of 0.5 mag.. The observed differences could be associated to the assumptions made by each of the methods, i.e. the colour-based extinction relies on theoretical stars that might not mimic the intrinsically dusty conditions of star-forming regions (e.g. Calzetti et al., 1994). This behaviour is actually not unusual and it is often found in star-forming galaxies (e.g. Hao et al., 2011; Kreckel et al., 2013). Following Kreckel et al. (2013), who concluded that the line ratio decrement method provides a more reliable extinction measurement for dusty regions, we use the line ratio based AV values to correct our measured fluxes in the hot spots, and the colour-based method presented in this section for Spot 8 and the nucleus only.
7 EMISSION-LINE ANALYSIS
Emission-line ratios of different elements constitute a powerful tool to disentangle the dominant excitation mechanisms in different regions in galaxies. Here we use the ratios of the , and Br lines for this purpose. At the same time we make use of the Br line to provide star formation rate estimates, as well as the amount of Hii present in the star-forming ring.
7.1 Star formation rates
Now that we have an estimate for the extinction in the different regions along the ring, we can correct the observed flux in the Br line and thus estimate the intrinsic flux. Knowing the intrinsic ratio between the Br and lines for case B recombination (/Br104, Hummer & Storey 1987), we can convert those luminosities into star formation rates (SFRs) following the prescription by Kennicutt (1998):
| (2) |
In addition, we derived the mass of the ionised gas in each aperture assuming the same case B recombination scenario as above.
The star formation rates measured in the ring spots range from 0.03 to 0.1 /yr. The value for the nucleus, however, drops down to 0.015 /yr, which is lower than the SFRs reported by Kewley et al. (2002) for a sample of 81 nearby non-active galaxies. It is therefore likely that the recombination lines observed in the nucleus are not due to star formation but the AGN. The SFRs measured in apertures 5, 6 and 7 show a steady decline along the ring, which is consistent with the pearls on a string scenario presented in paper I (i.e. the hot spots passively evolve as they move along the ring and away from the over-density regions).
The masses of the ionised-gas in the Hii regions probed by the apertures vary from 1.2 10 in the nucleus to 11.2 10 for the most massive hot spot. The SFR densities in the hot spots are in good agreement with those of circumnuclear star-forming regions in disk galaxies (Kennicutt, 1998).
7.2 The & Br ratio
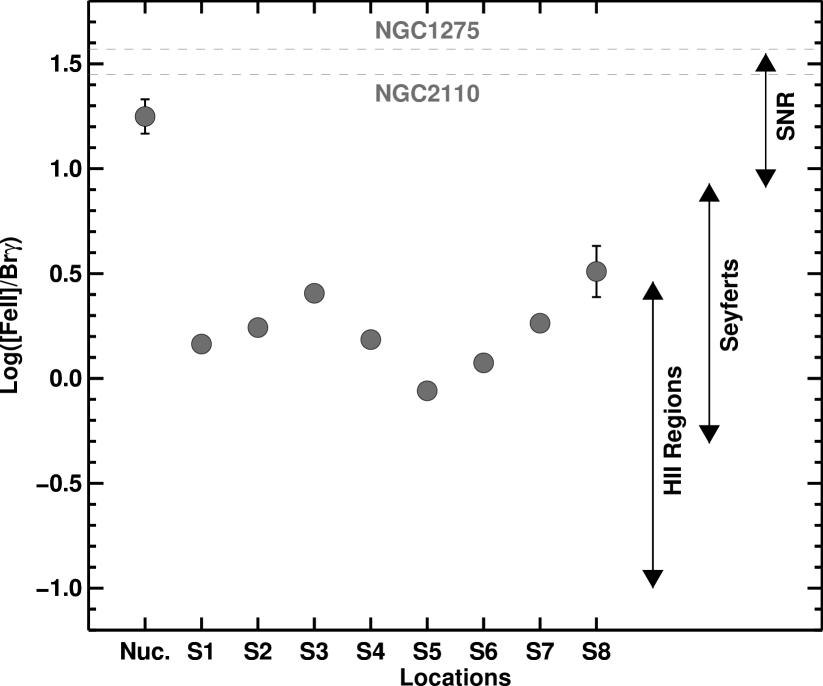
Strong emission is indicative of shock-excited gas in the filaments of supernova remnants, in contrast to the weak emission characteristic of photoionized gas in Hii regions. In AGN, strong emission is also common, although several processes may contribute to its production: (1) photoionization by extreme UV to soft X-ray radiation from the central source, producing large partially ionized regions in the NLR clouds; (2) interaction of radio jets with the surrounding medium, inducing shocks and hence partially ionized cooling tails; and (3) fast shocks associated with supernova remnants present in starburst regions. The /Br ratio has proved to be very useful for distinguishing between a stellar or non-stellar origin of the emission. This line ratio increases from Hii regions (photoionization by hot stars) to supernova remnants (shock excitation), passing through starburst and active galaxies (e.g. Alonso-Herrero et al., 1997; Rodríguez-Ardila et al., 2004; Rodríguez-Ardila et al., 2005; Ramos Almeida et al., 2006; Ramos Almeida et al., 2009; Riffel et al., 2013).
Figure 6 shows the variation of the /Br ratio for our apertures. The ratio is relatively low (/Br=[0.9,2.5]) in the star-forming hot spots, consistent with the typical values of Hii regions. On the other hand, the ratio in the nucleus is high (/Br=17.7), in the domain populated by supernova remnants and radio-loud Seyferts as e.g. NGC 1275 and NGC 2110 (/Br=37.3 and 28.1 from Kawara & Taniguchi 1993 and Rodríguez-Ardila et al. 2005 respectively). As found by Forbes & Ward (1993), there is a tight correlation between and radio emission in both Seyfert and star forming galaxies. In fact, as we can see in Sec. 8.1, the radio contours perfectly trace the emission. We thus conclude from Fig. 6 that the excitation mechanisms in the nucleus of NGC 613 (i.e. photoionization and shocks) differ from that in the hot spots (stellar photoionization).
7.3 Molecular hydrogen
All aperture spectra shown in Fig. 3 show a number of emission lines from molecular hydrogen. This section investigates what can be learned about the physical state of the gas. In this effort, we follow a number of studies, both theoretical (e.g. Mouri, 1994), and observational (e.g. Veilleux et al., 1997; Krabbe et al., 2000; Davies et al., 2005; Rodríguez-Ardila et al., 2004; Rodríguez-Ardila et al., 2005; Ramos Almeida et al., 2006; Ramos Almeida et al., 2009; Riffel et al., 2013; Mazzalay et al., 2013). All these studies take advantage of the fact that in most astronomical environments, the lowest vibrational levels () of tend to be well thermalised, while higher level transitions are predominantly populated by processes such as non-thermal UV fluorescence.
Generally speaking, the molecule can be excited via three distinct mechanisms: (i) UV fluorescence, where photons with Å are absorbed by the molecule and then re-emitted (e.g. Black & van Dishoeck, 1987); (ii) shocks, where high-velocity gas motions heat and accelerate the ambient gas (e.g. Hollenbach & McKee, 1989); and (iii) X-ray illumination, where hard X-ray photons penetrate deep and heat large amounts of molecular gas (e.g. Maloney et al., 1996). Shocks and X-ray illumination are normally referred to as thermal processes, and UV fluorescence as non-thermal. Each of these three mechanisms produces a distinct spectrum.
The 10S(1)/21S(1) line ratio is an excellent discriminator between thermal and non-thermal processes. According to the models of Mouri (1994), this ratio has much lower values () in regions that are dominated by UV fluorescence than in thermal-dominated gas (). This diagnostic has the advantages of being fairly insensitive to extinction because both lines have similar wavelengths and are independent of the ortho/para ratio. At the same time, the 10S(2)/10S(0) line ratio is sensitive to the strength of the incident radiation, and it can be used to discriminate the dominant excitation process.
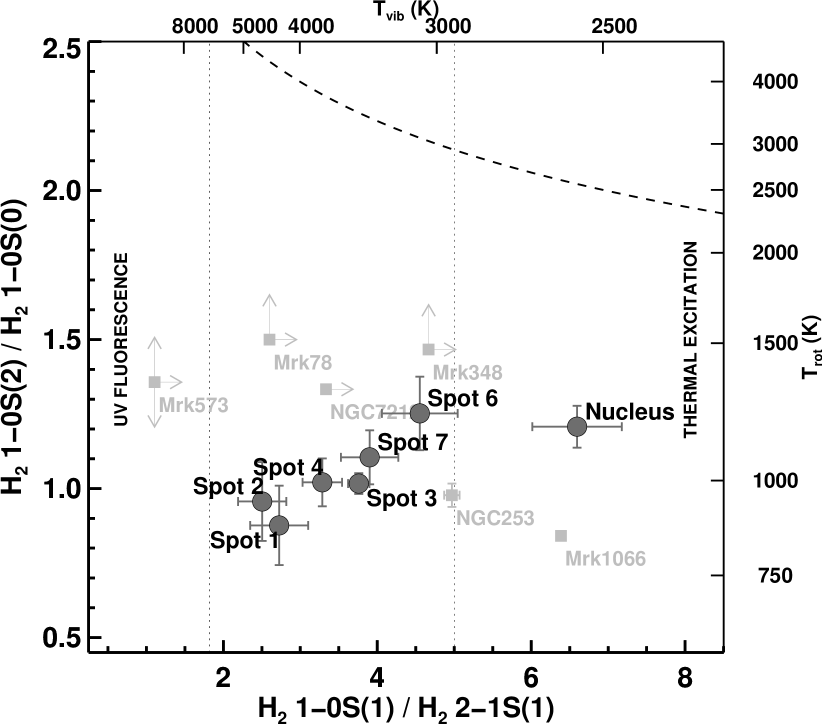
Figure 7 shows - for the apertures defined in Fig. 2 - the value of the flux ratio of the 10S(1) and 21S(1) versus the ratio of the 10S(2) and 10S(0) lines. For comparison, we also plot the ratios of five nearby Seyfert 2 galaxies from Ramos Almeida et al. (2009) and of the starburst galaxy NGC 253 from Riffel et al. (2013).
All the hot spots in the ring are, to varying degrees, affected by a mixture of thermal and non-thermal (i.e. fluorescent) excitation. The molecular gas in the nucleus of NGC 613, however, falls in the thermal excitation domain, indicating a lack of strong non-thermal excitation mechanisms. The ratios measured for the nucleus are also far from those predicted by thermal X-ray models (e.g. Lepp & McCray 1983; Maloney et al. 1996), which would lie outside the upper right boundaries of Fig. 7.
To confirm these results, we can compare the rotational and vibrational temperatures (Tvib and Trot) of the gas, which we calculated using the expressions in Reunanen et al. (2002). In the case of thermal excitation, both temperatures should be similar (i.e. close to the dashed line in Fig. 7), whereas in the case of non-thermal excitation, T. The latter is the case of the hot spots, which have Tvib=3000–5000 K and T1200 K. On the other hand, the gas in the nucleus has T2500500 K and T120040 K, characteristic of thermally excited gas.
At face value, these results are consistent with the absence of strong star formation and of a luminous X-ray source in the nucleus. Its relatively high 10S(2)/10S(0) value falls in the region of shock heated (thermalised) gas, and points to mechanical energy from the radio outflow as the source of heating. All seven ring apertures, in contrast, show a much more pronounced contribution from UV fluorescence. This is fully consistent with them being young star-forming regions.
In addition to elucidating the excitation mechanisms at play in the inner regions of NGC 613, it is interesting to estimate the amount of molecular gas present. This information is very valuable as it can be used to estimate the level of star formation expected in the near future in these regions. Using the S(1) line fluxes reported in Table 2, we estimate the mass of hot following the equation
| (3) |
from Reunanen et al. (2002), as well as the assumptions for gas temperature, transition probability and population fractions therein. is the extinction-corrected line flux, and the distance to the galaxy in Mpc. The resulting masses are reported in Table 2. We derive values between 9.4 and 38.5 for the ring spots and 112 for the nucleus. In the ring spots, where star formation is taking place, the mass of hot gas is low, whereas in the nucleus the mass of hot is an order of magnitude larger, although this measurement is likely affected by the interaction with the radio jet. Nevertheless, our masses of hot are consistent with those derived for a sample of Seyferts and low-luminosity AGN using SINFONI data as those used here (Mazzalay et al., 2013).
The same authors also estimated the the mass of cold from the integrated 10S(1) luminosity () in erg s using the relation:
| (4) |
derived by comparing a large number of values from the literature, calculated from CO observations, and integrated 10S(1) luminosities222The reported uncertainty of this calibration is about a factor 2 in mass.. Thus, we can roughly estimate the masses of cold gas for the nucleus and the hot spots in NGC 613 (also listed in Table 2). Those masses range between 7 and 28 in the ring spots, and 8 in the nucleus.
An important word of caution is necessary on the interpretation of masses having an associated amount of cold molecular gas. While relations like the one presented in Eq. 4 are very useful as proxies for the presence of cold gas, there are known cases of galaxies with estimates of molecular mass content, based on the line, two orders of magnitude above the one provided by the direct measurement of CO emission (e.g. NGC 4151, Dumas et al., 2010).
8 DISCUSSION
In light of the analysis and results described in the previous sections, we now discuss some of the most interesting unsolved questions in the circumnuclear environment of NGC 613. These are mainly related to the interactions between the nuclear ring and the radio outflow, and to the source of excitation of the present in the nucleus.
8.1 The radio outflow: an active nucleus in NGC 613?
The classification of NGC 613 in terms of nuclear activity is not completely clear by looking at its optical spectrum alone. Veron-Cetty & Veron (1986), as part of a spectroscopic study of the complete Revised Shapley-Ames Catalogue, classified it as composite object (Seyfert-like component co-existing with an Hii region). This classification is not surprising considering that the spectrum was extracted with an aperture of 4″, which corresponds to 328 pc in the case of NGC 613. The AGN nature of NGC 613 has, however, been recently confirmed from mid-infrared spectroscopy. Goulding & Alexander (2009) reported Spitzer/IRS observations showing high-excitation lines such as [NeIII], [NeV] and [SiII], characteristic of active galaxies. These authors claimed that the optical signatures of nuclear activity in this galaxy are likely diluted by strong star formation. In the X-rays, the galaxy was observed with XMM-Newton on December 2010 and, although the data have not been published yet, they appear to confirm the presence of an active nucleus in NGC 613 (obsID 0654800501).
The high resolution radio continuum images presented in Hummel & Jorsater (1992), and re-analysed here (see §2), show evidence for an energetic outflow emanating from the nucleus. The radio map (see Fig. 8) reveals a linear feature of about 300 pc which consists of three discrete components. These radio blobs are perpendicularly oriented to the projected major axis of the star-forming ring observed in our SINFONI maps. Whether the radio blobs are truly separate entities aligned in one direction, or bubbles of hot plasma originating from the incident radiation has not yet been determined. However, both the radio morphology and the coincidence of the central blob with the optical position (radio-optical offset of 01) indicate that the central component of the linear feature is indeed the nucleus. This constitutes a first indication that the radio jet orientation might be close to the plane of the sky, and consequently, relatively close to the plane of the galaxy as well, which has an inclination angle of 35∘ (as listed in Hyperleda333http://leda.univ-lyon1.fr/). Interestingly, Laine et al. (2006) found a tendency towards perpendicular alignments in Seyferts, but more parallel in starbursts.
Kondratko et al. (2006) and Castangia et al. (2008) reported the detection of a H2O megamaser with an isotropic luminosity of 35 L⊙, coincident with the position of the nucleus in the optical (with an uncertainty of 1.3″). This coincidence supports the link between the AGN and maser emission. In fact, all masers with isotropic luminosities 10 L⊙ are associated with AGN (Zhang et al., 2012), as confirmed from interferometry. There is good evidence that extragalactic H2O megamasers trace edge-on accretion disks in Seyfert galaxies (e.g. Greenhill & Gwinn, 1997; Greenhill et al., 2003), since large line-of-sight column densities are required theoretically to make the masers observable (Lo, 2005; Henkel et al., 2005). However, there is a different class of H2O megamasers, the so-called “jet-masers”. In these sources, the maser emission is the result of an interaction between the radio jet and a molecular cloud on parsec scales (Braatz et al., 1997; Henkel et al., 1998; Peck et al., 2003). Only four Seyfert galaxies have jet-masers confirmed to date: Mrk 348, NGC 1052, NGC 1068 and the Circinus galaxy444NGC 1068 and Circinus seem to have both disk- and jet-masers. (see Peck et al. 2003 and references therein). Although it is difficult to infer the radio jet orientation from maser emission, in all the known jet-masers the radio jets are perpendicular to the line-of-sight.
In the case of NGC 613, the origin of the megamaser is uncertain. Kondratko et al. (2006) reported the detection of a very broad H2O emission feature (FWHM87 km s-1), which was subsequently resolved into two different components of 20 and 40 km s-1 by Castangia et al. (2008). These two components are redshifted and blueshifted, respectively, with respect to the galaxy systemic velocity. The large linewidths and the presence of two kinematic components only point to a jet-maser, but the fact that the H2O emission is centred on the systemic velocity is not typical of those. Independently of the disk- and/or jet-maser classification of the H2O megamaser in NGC 613, it is very likely that the orientation of the jet is close to the plane of the sky. This orientation favours shocks capable of yielding a strong jet-maser along our line-of-sight (see Fig. 11 in Peck et al. 2003). If we have a disk-maser, the accretion disk and the dusty torus have to be very close to edge-on for the line-of-sight column density to make the maser detectable, and thus, the radio jet would also be orthogonally oriented to the plane of the disk (see Drouart et al. 2012 and references therein).
Once we know the radio jet orientation, our NIR observations provide additional information to establish the true morphology of the outflow. In paper I, we showed how the structure of the different emission lines in our spectral range were affected by the out-flowing radiation. The flux maps for all the lines (i.e. , , , and Br) display a lack of emission on the top half of the ring, coinciding with the direction of the out flowing material. This indicates that the interaction with the radio jet has probably swept out gas and dust. This is visible in Fig. 1.
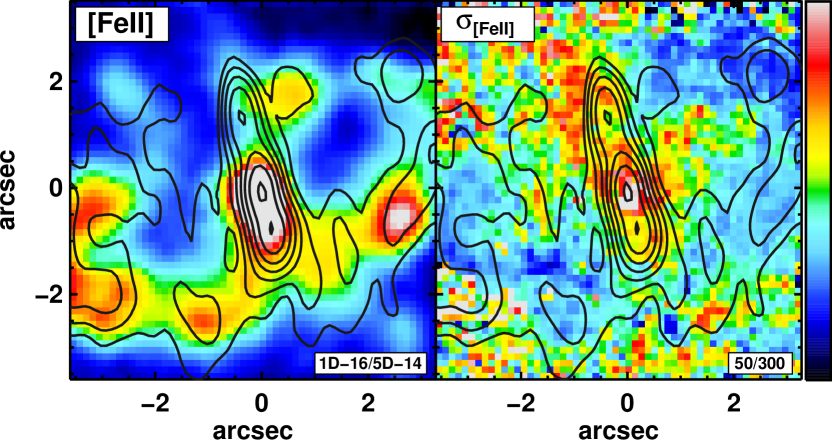
While morphologically all the lines seem altered, only the line appears to be affected dynamically. In Fig. 8 we show the line flux and velocity dispersion with radio flux contours overlaid. We see that the highest velocity dispersion values coincide, although not perfectly, with the linear structure resolved in three blobs observed in the radio continuum map. Although marginal, the values happen to be somewhat lower at the edges of this gap, coinciding with two plumes of that extend beyond the nuclear ring. Taken at face value, this picture is consistent with a jet radiating along a cone. The high velocity dispersions can be explained by the fact that the differences in the line-of-sight velocities of the material are maximum in the central parts of the cone. At the edges of the cone, velocities are very similar, which explains the low values there. Regarding the flux, the enhancement we see at the edges would be caused by limb-brightening of the conical structure.
In conclusion, our NIR data support the presence of a radio jet oriented close to the plane of the sky, which is sweeping out the gas and dust within the top half of the star-forming ring. According to Hummel & Jorsater (1992), if the ring is circular, its inclination is 55∘, larger than the 35∘ inclination of the galaxy. This larger disk inclination explains the proposed scenario: the interaction with the jet affects the material in the top half of the ring, while the bottom part remains unaltered.
8.2 The nucleus: a starburst in waiting?
It is evident from the numerous emission lines in the spectrum of the central () in Fig. 3 that the nucleus of NGC 613 harbours a substantial amount of hot gas. Our mass estimate based on the 10S(1) line flux is 1.12. This mass is an order of magnitude larger than in the star-forming knots in the ring. A large amount of cold gas is also found, which we estimated using the empirical relation derived by Mazzalay et al. (2013) for Seyfert galaxies and low-luminosity AGN. We derived a cold gas mass of 8 for the nucleus of NGC 613. These values are larger than the hot and cold masses reported in Mazzalay et al. (2013) for a small sample of nearby AGN. Their sample includes two galaxies with circumnuclear star-forming rings, NGC 3351 and NGC 4536, and the masses of hot and cold gas measured by Mazzalay et al. (2013) in those rings are much larger than in their nuclei, which is opposite to what we find in NGC 613.
In contrast to the presence of hot and cold molecular gas, there is no evidence for active star formation in the nucleus of NGC 613: the recombination lines of ionized hydrogen (e.g. Br) are almost absent. This immediately raises a number of questions about the mechanism responsible for heating the , the amount of molecular gas within the nucleus, and the likely fate of this gas.
A similarity between the two galaxies with circumnuclear rings in Mazzalay et al. (2013) and NGC 613 is the deficit of Br emission relative to the emission. However, the 10S(1)/Br ratio that we measure in the nucleus of NGC 613 (14.93.0) is much larger than the values reported in Mazzalay et al. (2013) for NGC 3351 and NGC 4536 on the same scales (5.9 and 1.9). This ratio is normally 0.6 in starburst galaxies555In the ring hot spots we measure 10S(1)/Br0.67., between 0.6 and 6 in Seyfert galaxies, and larger than 6 in Low lonization Nuclear Emission Regions (LINERs; Riffel et al. 2013; Mazzalay et al. 2013). The extreme value of 10S(1)/Br measured in the nucleus of NGC 613 is thus consistent with a low-luminosity AGN (Seyfert or LINER) with a strong influence from shock heating. The interaction with the radio jet is thus likely enhancing the emission in the nucleus.
Using -band SINFONI data at the highest resolution available, Davies et al. (2007) studied the AGN–star formation connection in the inner 10 pc of nine nearby Seyferts. They found evidence for starbursts which took place in the last 10–300 Myr but are no longer active, and for a delay of 50–100 Myr between the triggering of the star formation in those galaxies and the onset of the nuclear activity. Considering the lack of star formation in the nucleus of NGC 613, the large amount of cold molecular gas and the confirmed presence of nuclear activity, we speculate with a cyclical scenario, where a starburst episode was followed by another of nuclear activity. In addition, the interaction with the radio jet likely produced a substantial amount of molecular gas, creating a reservoir of cold gas that can sustain the AGN and possibly fuel the next starburst episode.
We have attempted to date the last episode of star formation in the nucleus comparing the Br equivalent width with Starburst99 model predictions. The measured value of 1.89 Å implies that the latest starburst happened sometime between 8 and 13 Myr ago (depending on the adopted metallicity)666Considering the possible effect of the radio jet, this estimate is necessarily a lower limit for the last starburst.. Based on our current estimate of H2 molecular gas available, it is interesting to determine when the next event might take place. The estimated free-fall time (tff), i.e., the earliest possible collapse time, for a cloud of 05 radius (our aperture size) and 8 is tff 0.5 Myr. The next starburst episode can thus be imminent considering the dynamical timescales ( Gyr) in this type of galaxies. Compared to the measurements presented by Mazzalay et al. (2013) for a set of five star-forming galaxies, the amount of H2 present in NGC 613 is at least a factor of two, and up to a factor forty, larger for similar aperture measurements. This comparison emphasises the rather special situation we are observing in NGC 613, where a starburst episode is likely about to happen. This result, together with the lack of emission lines in other galaxies in our original sample (paper I), suggest that as long as there is gas supply towards the centre of the galaxy, recurrent star formation events can take place in very short time intervals. This scenario is consistent with the one established by Davies et al. (2007), although the time scales for NGC 613 are somewhat shorter. The lack of apparent gas transfer from the star-forming ring to the inner regions, based on the H2 emission-line map in Fig. 2, makes it rather difficult to determine the frequency of these events in NGC 613. While interesting, NGC 613 is by no means a unique case. Additional examples of galaxies, with large mass concentrations in their nuclei, that might be at the verge of undergoing a starburst phase include NGC 6946 (Schinnerer et al., 2006, 2007) and NGC 7552 (Pan et al., 2013).
While the discussion about recurrent star formation episodes presented here focuses on the nucleus of NGC 613, it is worth mentioning that a similar behaviour has been observed in Hii regions of star-forming nuclear rings and nuclear clusters (with intense starbursts followed by long inactive periods, e.g. Allard et al. 2006; Walcher et al. 2006; Sarzi et al. 2007).
9 SUMMARY AND CONCLUSIONS
In this paper we have made use of NIR integral-field SINFONI observations to study the inner regions of the nearby spiral galaxy NGC 613. This galaxy is part of the sample of five galaxies with star-forming nuclear rings presented in Böker et al. (2008). We selected this galaxy for a more detailed analysis due to the peculiar nature of its circumnuclear environment: a star-forming ring, a radio jet, and an unexpectedly high level of H2 concentrated in its nucleus.
In Böker et al. (2008) we concluded that star formation along the inner ring proceeds in a ”pearls on a string“ fashion, i.e. with star clusters in the ring getting progressively older as they move away from the over-density regions. The complexity of studying stellar content with the CO bandhead alone prevented us from checking whether the same behaviour is observed in the underlying populations. Nevertheless, the measurement of the CO equivalent width (i.e. DCO index), together with the colour, now allows us to determine the amount of extinction in the innermost regions of NGC 613. Incidentally, the comparison of our DCO values with those of early-type galaxies reinforces previous findings in support of environmentally driven carbon abundances.
The analysis of the emission lines reveals that the gas in the nucleus is not exclusively photoionized by the AGN, but also shock-heated. The hot spots along the ring however show a much more pronounced contribution from UV fluorescence. The star formation rates and masses of the ionised gas in Hii regions are consistent with those observed in star-forming regions in other galaxies.
In our discussion, we used all this information to study the origin of the nuclear activity and establish the orientation of the observed radio outflow, which is nicely mapped by the distribution and velocity dispersion. Based on the existence of a maser in the nucleus, we propose that the radio jet is likely oriented very close to the plane of the sky and that it is sweeping away the gas and dust in one portion of the ring.
Finally, we have investigated the fate of the unusually large amount of H2 gas present in the nucleus of NGC 613. We estimate that the last episode of star formation took place around 10 Myr ago and establish a lower limit for the onset of the next event of 0.5 Myr. The recurrence of these episodes, however, is rather uncertain, especially since we have not found any evidence for gas transfer from the star-forming ring to the nucleus. In addition to that, one has to consider the role the radio jet may play in inhibiting or fostering the generation of new stars. Still, datasets like the one presented here have the important value of setting constraints and adding fundamental information to the still rather poorly understood AGN–star formation connection.
Acknowledgments
The authors are indebted to J. A. Acosta, A. Alonso-Herrero, P. Castangia, P. Esquej and A. Vazdekis for insightful comments and suggestions at different stages of this work. J. F.-B. acknowledges support from the Ramón y Cajal Program, grants AYA2010-21322-C03-02 from the Spanish Ministry of Economy and Competitiveness (MINECO). We also acknowledge support from the FP7 Marie Curie Actions of the European Commission, via the Initial Training Network DAGAL under REA grant agreement number 289313. C. R. A. acknowledges grant PN AYA2010-21887-C04.04 (Estallidos) from MINECO. Based on observations collected at the European Southern Observatory, Chile, for proposal 076.B-0646(A).
References
- Abazajian et al. (2009) Abazajian K. N., Adelman-McCarthy J. K., Agüeros M. A., Allam S. S., Allende Prieto C., An D., Anderson K. S. J., Anderson S. F., Annis J., Bahcall N. A., et al. 2009, ApJS, 182, 543
- Allard et al. (2006) Allard E. L., Knapen J. H., Peletier R. F., Sarzi M., 2006, MNRAS, 371, 1087
- Alonso-Herrero et al. (1997) Alonso-Herrero A., Rieke M. J., Rieke G. H., Ruiz M., 1997, ApJ, 482, 747
- Athanassoula (1994) Athanassoula E., 1994, in Shlosman I., ed., Mass-Transfer Induced Activity in Galaxies Gas Dynamics and Star Formation in and Around Bars (Invited paper). p. 143
- Baldwin et al. (1973) Baldwin J. R., Frogel J. A., Persson S. E., 1973, ApJ, 184, 427
- Bandara et al. (2009) Bandara K., Crampton D., Simard L., 2009, ApJ, 704, 1135
- Black & van Dishoeck (1987) Black J. H., van Dishoeck E. F., 1987, ApJ, 322, 412
- Böker et al. (2008) Böker T., Falcón-Barroso J., Schinnerer E., Knapen J. H., Ryder S., 2008, AJ, 135, 479
- Braatz et al. (1997) Braatz J. A., Wilson A. S., Henkel C., 1997, ApJS, 110, 321
- Calzetti et al. (1994) Calzetti D., Kinney A. L., Storchi-Bergmann T., 1994, ApJ, 429, 582
- Cappellari et al. (2011) Cappellari M., Emsellem E., Krajnović D., McDermid R. M., Scott N., Verdoes Kleijn G. A., Young L. M., Alatalo K., Bacon R., Blitz L., Bois M., Bournaud F., 2011, MNRAS, 413, 813
- Cardiel (2007) Cardiel N., 2007, in Figueras F., Girart J. M., Hernanz M., Jordi C., eds, Highlights of Spanish Astrophysics IV Measuring line-strength indices in a systematic way. pp CD–ROM
- Carretero et al. (2004) Carretero C., Vazdekis A., Beckman J. E., Sánchez-Blázquez P., Gorgas J., 2004, ApJ, 609, L45
- Castangia et al. (2008) Castangia P., Tarchi A., Henkel C., Menten K. M., 2008, A&A, 479, 111
- Combes & Gerin (1985) Combes F., Gerin M., 1985, A&A, 150, 327
- Dale et al. (2004) Dale D. A., Roussel H., Contursi A., Helou G., Dinerstein H. L., Hunter D. A., Hollenbach D. J., Egami E., Matthews K., Murphy Jr. T. W., Lafon C. E., Rubin R. H., 2004, ApJ, 601, 813
- Davies et al. (2007) Davies R. I., Müller Sánchez F., Genzel R., Tacconi L. J., Hicks E. K. S., Friedrich S., Sternberg A., 2007, ApJ, 671, 1388
- Davies et al. (2005) Davies R. I., Sternberg A., Lehnert M. D., Tacconi-Garman L. E., 2005, ApJ, 633, 105
- de Zeeuw et al. (2002) de Zeeuw P. T., Bureau M., Emsellem E., Bacon R., Carollo C. M., Copin Y., Davies R. L., Kuntschner H., Miller B. W., Monnet G., Peletier R. F., Verolme E. K., 2002, MNRAS, 329, 513
- Doyon et al. (1994) Doyon R., Joseph R. D., Wright G. S., 1994, ApJ, 421, 101
- Drouart et al. (2012) Drouart G., De Breuck C., Vernet J., Laing R. A., Seymour N., Stern D., Haas M., Pier E. A., Rocca-Volmerange B., 2012, A&A, 548, A45
- Dumas et al. (2010) Dumas G., Schinnerer E., Mundell C. G., 2010, ApJ, 721, 911
- Ferrarese & Merritt (2000) Ferrarese L., Merritt D., 2000, ApJ, 539, L9
- Forbes & Ward (1993) Forbes D. A., Ward M. J., 1993, ApJ, 416, 150
- Förster Schreiber (2000) Förster Schreiber N. M., 2000, AJ, 120, 2089
- Frogel et al. (1978) Frogel J. A., Persson S. E., Matthews K., Aaronson M., 1978, ApJ, 220, 75
- Ganda et al. (2009) Ganda K., Peletier R. F., Balcells M., Falcón-Barroso J., 2009, MNRAS, 395, 1669
- Gebhardt et al. (2000) Gebhardt K., Bender R., Bower G., Dressler A., Faber S. M., Filippenko A. V., Green R., Grillmair C., Ho L. C., Kormendy J., Lauer T. R., Magorrian J., Pinkney J., Richstone D., Tremaine S., 2000, ApJ, 539, L13
- Goulding & Alexander (2009) Goulding A. D., Alexander D. M., 2009, MNRAS, 398, 1165
- Graham et al. (2001) Graham A. W., Erwin P., Caon N., Trujillo I., 2001, ApJ, 563, L11
- Greenhill et al. (2003) Greenhill L. J., Booth R. S., Ellingsen S. P., Herrnstein J. R., Jauncey D. L., McCulloch P. M., Moran J. M., Norris R. P., Reynolds J. E., Tzioumis A. K., 2003, ApJ, 590, 162
- Greenhill & Gwinn (1997) Greenhill L. J., Gwinn C. R., 1997, Ap&SS, 248, 261
- Greisen (1990) Greisen E. W., 1990, in Longo G., Sedmak G., eds, Acquisition, Processing and Archiving of Astronomical Images The Astronomical Image Processing System.. pp 125–142
- Hao et al. (2011) Hao C.-N., Kennicutt R. C., Johnson B. D., Calzetti D., Dale D. A., Moustakas J., 2011, ApJ, 741, 124
- Henkel et al. (2005) Henkel C., Peck A. B., Tarchi A., Nagar N. M., Braatz J. A., Castangia P., Moscadelli L., 2005, A&A, 436, 75
- Henkel et al. (1998) Henkel C., Wang Y. P., Falcke H., Wilson A. S., Braatz J. A., 1998, A&A, 335, 463
- Hollenbach & McKee (1989) Hollenbach D., McKee C. F., 1989, ApJ, 342, 306
- Hopkins et al. (2006) Hopkins P. F., Hernquist L., Cox T. J., Di Matteo T., Robertson B., Springel V., 2006, ApJS, 163, 1
- Hummel & Jorsater (1992) Hummel E., Jorsater S., 1992, A&A, 261, 85
- Hummel et al. (1987) Hummel E., Jorsater S., Lindblad P. O., Sandqvist A., 1987, A&A, 172, 51
- Hummer & Storey (1987) Hummer D. G., Storey P. J., 1987, MNRAS, 224, 801
- James & Seigar (1999) James P. A., Seigar M. S., 1999, A&A, 350, 791
- Kawara & Taniguchi (1993) Kawara K., Taniguchi Y., 1993, ApJ, 410, L19
- Kennicutt (1998) Kennicutt Jr. R. C., 1998, ARA&A, 36, 189
- Kennicutt et al. (2003) Kennicutt Jr. R. C., Armus L., Bendo G., Calzetti D., Dale D. A., Draine B. T., Engelbracht C. W., Gordon K. D., Grauer A. D., Helou G., Hollenbach D. J., Jarrett T. H., Kewley L. J., Leitherer C., Li A., Malhotra S., Regan M. W., Rieke G. H., 2003, PASP, 115, 928
- Kewley et al. (2002) Kewley L. J., Geller M. J., Jansen R. A., Dopita M. A., 2002, The Astronomical Journal, 124, 3135
- Kleinmann & Hall (1986) Kleinmann S. G., Hall D. N. B., 1986, ApJS, 62, 501
- Knapen et al. (1995) Knapen J. H., Beckman J. E., Heller C. H., Shlosman I., de Jong R. S., 1995, ApJ, 454, 623
- Knapen et al. (2006) Knapen J. H., Mazzuca L. M., Böker T., Shlosman I., Colina L., Combes F., Axon D. J., 2006, A&A, 448, 489
- Kondratko et al. (2006) Kondratko P. T., Greenhill L. J., Moran J. M., Lovell J. E. J., Kuiper T. B. H., Jauncey D. L., Cameron L. B., Gómez J. F., García-Miró C., Moll E., de Gregorio-Monsalvo I., Jiménez-Bailón E., 2006, ApJ, 638, 100
- Kormendy & Bender (2009) Kormendy J., Bender R., 2009, ApJ, 691, L142
- Kormendy & Kennicutt (2004) Kormendy J., Kennicutt Jr. R. C., 2004, ARA&A, 42, 603
- Krabbe et al. (2000) Krabbe A., Sams III B. J., Genzel R., Thatte N., Prada F., 2000, A&A, 354, 439
- Krajnovic et al. (2013) Krajnovic D., Karick A. M., Davies R. L., Naab T., Sarzi M., Emsellem E., Cappellari M., Serra P., et al. 2013, ArXiv e-prints
- Kreckel et al. (2013) Kreckel K., Groves B., Schinnerer E., Johnson B. D., Aniano G., Calzetti D., Croxall K. V., Draine B. T., Gordon K. D., Crocker A. F., Dale D. A., Hunt L. K., Kennicutt R. C., Meidt S. E., Smith J. D. T., Tabatabaei F. S., 2013, ApJ, 771, 62
- Kuchinski et al. (1998) Kuchinski L. E., Terndrup D. M., Gordon K. D., Witt A. N., 1998, AJ, 115, 1438
- Laine et al. (2006) Laine S., Kotilainen J. K., Reunanen J., Ryder S. D., Beck R., 2006, AJ, 131, 701
- Lançon et al. (2007) Lançon A., Hauschildt P. H., Ladjal D., Mouhcine M., 2007, A&A, 468, 205
- Leitherer et al. (1999) Leitherer C., Schaerer D., Goldader J. D., González Delgado R. M., Robert C., Kune D. F., de Mello D. F., Devost D., Heckman T. M., 1999, ApJS, 123, 3
- Lepp & McCray (1983) Lepp S., McCray R., 1983, ApJ, 269, 560
- Lo (2005) Lo K. Y., 2005, ARA&A, 43, 625
- MacArthur (2005) MacArthur L. A., 2005, ApJ, 623, 795
- Maloney et al. (1996) Maloney P. R., Hollenbach D. J., Tielens A. G. G. M., 1996, ApJ, 466, 561
- Mármol-Queraltó et al. (2008) Mármol-Queraltó E., Cardiel N., Cenarro A. J., Vazdekis A., Gorgas J., Pedraz S., Peletier R. F., Sánchez-Blázquez P., 2008, A&A, 489, 885
- Mármol-Queraltó et al. (2009) Mármol-Queraltó E., Cardiel N., Sánchez-Blázquez P., Trager S. C., Peletier R. F., Kuntschner H., Silva D. R., Cenarro A. J., Vazdekis A., Gorgas J., 2009, ApJ, 705, L199
- Mayya (1997) Mayya Y. D., 1997, ApJ, 482, L149
- Mazzalay et al. (2013) Mazzalay X., Saglia R. P., Erwin P., Fabricius M. H., Rusli S. P., Thomas J., Bender R., Opitsch M., Nowak N., Williams M. J., 2013, MNRAS, 428, 2389
- McLaughlin et al. (2006) McLaughlin D. E., King A. R., Nayakshin S., 2006, ApJ, 650, L37
- Moorwood & Oliva (1988) Moorwood A. F. M., Oliva E., 1988, A&A, 203, 278
- Mouri (1994) Mouri H., 1994, ApJ, 427, 777
- Mouri et al. (1993) Mouri H., Kawara K., Taniguchi Y., 1993, ApJ, 406, 52
- Novak et al. (2006) Novak G. S., Faber S. M., Dekel A., 2006, ApJ, 637, 96
- Origlia et al. (1993) Origlia L., Moorwood A. F. M., Oliva E., 1993, A&A, 280, 536
- Pan et al. (2013) Pan H.-A., Lim J., Matsushita S., Wong T., Ryder S., 2013, ApJ, 768, 57
- Peck et al. (2003) Peck A. B., Henkel C., Ulvestad J. S., Brunthaler A., Falcke H., Elitzur M., Menten K. M., Gallimore J. F., 2003, ApJ, 590, 149
- Persson et al. (1983) Persson S. E., Aaronson M., Cohen J. G., Frogel J. A., Matthews K., 1983, ApJ, 266, 105
- Puxley et al. (1997) Puxley P. J., Doyon R., Ward M. J., 1997, ApJ, 476, 120
- Ramos Almeida et al. (2009) Ramos Almeida C., Pérez García A. M., Acosta-Pulido J. A., 2009, ApJ, 694, 1379
- Ramos Almeida et al. (2006) Ramos Almeida C., Pérez García A. M., Acosta-Pulido J. A., Rodríguez Espinosa J. M., Barrena R., Manchado A., 2006, ApJ, 645, 148
- Reunanen et al. (2002) Reunanen J., Kotilainen J. K., Prieto M. A., 2002, MNRAS, 331, 154
- Rhoads (1998) Rhoads J. E., 1998, AJ, 115, 472
- Rieke & Lebofsky (1985) Rieke G. H., Lebofsky M. J., 1985, ApJ, 288, 618
- Riffel et al. (2007) Riffel R., Pastoriza M. G., Rodríguez-Ardila A., Maraston C., 2007, ApJ, 659, L103
- Riffel et al. (2013) Riffel R., Rodríguez-Ardila A., Aleman I., Brotherton M. S., Pastoriza M. G., Bonatto C., Dors O. L., 2013, MNRAS, 430, 2002
- Rodríguez-Ardila et al. (2004) Rodríguez-Ardila A., Pastoriza M. G., Viegas S., Sigut T. A. A., Pradhan A. K., 2004, A&A, 425, 457
- Rodríguez-Ardila et al. (2005) Rodríguez-Ardila A., Riffel R., Pastoriza M. G., 2005, MNRAS, 364, 1041
- Ryder et al. (2001) Ryder S. D., Knapen J. H., Takamiya M., 2001, MNRAS, 323, 663
- Sarzi et al. (2007) Sarzi M., Allard E. L., Knapen J. H., Mazzuca L. M., 2007, MNRAS, 380, 949
- Sarzi et al. (2006) Sarzi M., Falcón-Barroso J., Davies R. L., Bacon R., Bureau M., Cappellari M., de Zeeuw P. T., Emsellem E., Fathi K., Krajnović D., Kuntschner H., McDermid R. M., Peletier R. F., 2006, MNRAS, 366, 1151
- Schinnerer et al. (2007) Schinnerer E., Böker T., Emsellem E., Downes D., 2007, A&A, 462, L27
- Schinnerer et al. (2006) Schinnerer E., Böker T., Emsellem E., Lisenfeld U., 2006, ApJ, 649, 181
- Shapiro et al. (2006) Shapiro K. L., Cappellari M., de Zeeuw T., McDermid R. M., Gebhardt K., van den Bosch R. C. E., Statler T. S., 2006, MNRAS, 370, 559
- Simkin et al. (1980) Simkin S. M., Su H. J., Schwarz M. P., 1980, ApJ, 237, 404
- van der Laan et al. (2013) van der Laan T. P. R., Schinnerer E., Emsellem E., Hunt L. K., McDermid R. M., Liu G., 2013, A&A, 551, A81
- Veilleux et al. (1997) Veilleux S., Goodrich R. W., Hill G. J., 1997, ApJ, 477, 631
- Veron-Cetty & Veron (1986) Veron-Cetty M.-P., Veron P., 1986, A&AS, 66, 335
- Walcher et al. (2006) Walcher C. J., Böker T., Charlot S., Ho L. C., Rix H.-W., Rossa J., Shields J. C., van der Marel R. P., 2006, ApJ, 649, 692
- Zhang et al. (2012) Zhang J. S., Henkel C., Guo Q., Wang J., 2012, A&A, 538, A152
| Aperture | Br10 | Br | AV | Log() | SFR | Log(MHII) | DCO | ||
|---|---|---|---|---|---|---|---|---|---|
| (1) | (2) | (3) | (4) | (5) | (6) | (7) | (8) | (9) | (10) |
| Nucleus | 85.50 3.28 | 4.82 0.89 | 3.62 | 39.26 | 0.02 | 3.10 | 1.207 | ||
| Spot 1 | 15.90 0.32 | 3.54 0.23 | 2.55 0.26 | 10.90 0.35 | 6.50 | 39.62 | 0.03 | 3.45 | 1.228 |
| Spot 2 | 25.70 0.39 | 4.78 0.23 | 3.81 0.27 | 14.70 0.32 | 7.24 | 39.75 | 0.04 | 3.58 | 1.230 |
| Spot 3 | 109.00 0.30 | 14.00 0.16 | 13.30 0.21 | 42.80 0.29 | 15.27 | 40.21 | 0.13 | 4.05 | 1.220 |
| Spot 4 | 53.00 0.35 | 11.30 0.22 | 9.51 0.29 | 34.60 0.37 | 9.40 | 40.12 | 0.10 | 3.95 | 1.213 |
| Spot 5 | 27.50 0.38 | 10.30 0.22 | 9.90 0.29 | 31.50 0.38 | 6.73 | 40.08 | 0.10 | 3.91 | 1.206 |
| Spot 6 | 29.90 0.32 | 8.22 0.19 | 5.81 0.21 | 25.20 0.31 | 9.43 | 39.98 | 0.08 | 3.82 | 1.149 |
| Spot 7 | 34.10 0.30 | 6.08 0.24 | 4.46 0.24 | 18.60 0.37 | 7.38 | 39.85 | 0.06 | 3.69 | 1.223 |
| Spot 8 | 4.82 0.60 | 1.49 0.37 | 0.84 | 38.75 | 2.59 | 1.219 |
NOTES: Fluxes and their uncertainties are corrected for internal extinction (based on the values in column 6) and are expressed in units of 10-16 erg s-1 cm-2. is in erg s-1. SFR is expressed in yr-1, and MHII in .
| Aperture | 10 S(0) | 10 S(1) | 10 S(2) | 10 S(7) | 21 S(0) | 21 S(1) | 21 S(3) | 32 S(1) | 32 S(3) | ||
|---|---|---|---|---|---|---|---|---|---|---|---|
| (1) | (2) | (3) | (4) | (5) | (6) | (7) | (8) | (9) | (10) | (11) | (12) |
| Nucleus | 20.70 0.92 | 71.90 1.24 | 25.00 0.94 | 16.40 0.84 | 10.90 0.94 | 5.04 0.80 | 112.0 | 80.6 | |||
| Spot 1 | 2.67 0.29 | 6.05 0.35 | 2.34 0.25 | 2.22 0.28 | 9.4 | 6.8 | |||||
| Spot 2 | 3.46 0.33 | 7.89 0.44 | 3.31 0.33 | 3.15 0.35 | 12.3 | 8.8 | |||||
| Spot 3 | 8.88 0.21 | 24.70 0.28 | 9.03 0.22 | 11.70 0.19 | 3.59 0.22 | 6.57 0.23 | 3.11 0.20 | 38.5 | 27.7 | ||
| Spot 4 | 5.23 0.28 | 13.80 0.36 | 5.34 0.31 | 2.28 0.29 | 4.20 0.31 | 21.5 | 15.5 | ||||
| Spot 5 | 2.33 0.27 | 6.39 0.37 | 2.05 0.32 | 1.92 0.27 | 10.0 | 7.2 | |||||
| Spot 6 | 3.21 0.25 | 11.70 0.34 | 4.02 0.24 | 2.81 0.22 | 2.57 0.27 | 2.14 0.26 | 18.2 | 13.1 | |||
| Spot 7 | 4.67 0.29 | 12.60 0.36 | 5.16 0.27 | 2.56 0.23 | 3.23 0.29 | 1.71 0.28 | 19.6 | 14.1 | |||
| Spot 8 | 2.11 0.48 | 1.18 0.35 | 3.3 | 2.4 |
NOTES: Fluxes and their uncertainties are corrected for internal extinction (based on the values in column 6 of Table 1) and are expressed in units of 10-16 erg s-1 cm-2. (hot and cold) masses are based on calibrations from Reunanen et al. (2002) and Mazzalay et al. (2013), and are expressed in units of and 10, respectively.