Comptonization signatures in the prompt emission of
Gamma Ray Bursts
Abstract
We report results of a systematic study of the broad–band (2–2000 keV) time–resolved prompt emission spectra of a sample of Gamma-Ray Bursts (GRBs) detected with both the Wide Field Cameras (WFCs) aboard the BeppoSAX satellite and the BATSE experiment aboard CGRO. The main goal of the paper is to test spectral models of the GRB prompt emission that have recently been proposed. In particular, we test the photospheric model proposed by Ryde and Pe’er (2009), i.e., blackbody plus power–law, the addition of a blackbody emission to the Band function in the cases in which this function does not fit the data, and the Comptonization model developed by Titarchuk et al. (2012). By considering the few spectra for which the simple Band function does not provide a fully acceptable fit to the data (Frontera et al. 2012), only in one case we find a statistically significant better fit by adding a blackbody to this function. We confirm the results found fitting the BATSE spectra alone with a blackbody plus a power law. Instead when the BATSE GRB spectra are joined to those obtained with WFCs (2–28 keV), this model becomes unacceptable in most of time intervals in which we subdivide the GRB light curves. We find instead that the Comptonization model is always acceptable, even in the few cases in which the Band function is inconsistent with the data. We discuss the implications of these results.
1 Introduction
In spite of the huge advances in the knowledge of the GRB afterglow properties mainly with Swift, the GRB phenomenon is still poorly understood (e.g., Lyutikov 2009; Zhang 2011). It is recognized to be of crucial importance the study of the prompt emission, which is more directly connected with the original explosion. One of the still open issues is the radiation emission mechanism at work. Most of the GRB properties derived thus far come from the time–averaged spectra, that are mainly described with empirical functions. The function that has been found to better describe the prompt emission spectra from 15 keV up to at least 10 MeV is a smoothly broken power–law proposed by Band et al. (1993)(Band function, bf). On the basis of the spectral data obtained with the Burst and Transient Source Experiment (BATSE), aboard the Compton Gamma Ray Observatory satellite (CGRO) and with other satellite data (e.g., Guidorzi et al. 2011), for long GRBs (2 s), the mean value of the low energy photon index of the bf is about , while that of the high energy photon index is about (Kaneko et al. 2006). As a consequence of this result, the received power per unit logarithmic energy interval shows a peak value, that in the BATSE era seemed to show a sharp Gaussian distribution around 200 keV. Actually, with the discovery of the X–ray flashes with BeppoSAX, later also found with HETE-2, Swift, and, now, with the Fermi Gamma-Ray Burst Monitor (GBM), this distribution results to be much flatter (e.g., Kippen et al. 2003; Sakamoto et al. 2005). In the cases in which cannot be constrained, a power–law model with a high energy exponential cutoff (cpl) gives a good fit to the data, and, in some cases, even a simple power law (pl) can describe the GRB time–averaged spectra up to several MeV photon energies.
Besides fitting with an empirical function, different radiative emission models have been developed to interpret the GRB spectra. Given their non thermal shape, the first model proposed was a synchrotron emission model by non thermal electrons in strong magnetic fields (Rees & Meszaros 1994; Katz 1994; Tavani 1996). Indeed, the time–averaged spectra of many GRBs are consistent with an optically thin synchrotron shock model (e.g., Tavani 1996; Amati et al. 2001). However, there is a significant number of GRBs for which this model does not work. Indeed, while for an optically thin synchrotron spectrum, the expected power-law index of the spectrum below the peak energy cannot be steeper than 4/3 (ideal case of an instantaneous spectrum in which the electron cooling is not taken into account), in many cases (e.g., Preece et al. 1998, 2000)) the measured spectra, even those time–resolved (Crider et al. 1997; Frontera et al. 2000), are inconsistent with these expectations.
To overcome these difficulties, either modifications of the above synchrotron scenario (e.g., Lloyd & Petrosian 2000), or other radiative models, have been suggested. Among them, we mention the synchrotron self-Compton model (Mészáros & Rees 2000; Stern & Poutanen 2004), the Compton up-scattering of low energy photons by a quasi–static plasma (Liang et al. 1997), the superposition of blackbody spectra (Blinnikov et al. 1999), the Compton drag emission model (Lazzati et al. 2000), thermal emission plus a possible non-thermal tail model (Lazzati et al. 2009). Each of these models interprets some of the emission features, but fails to interpret others.
One of the GRB spectral properties that the emission models should interpret is a correlation between the intrinsic peak energy of the function and either the GRB released energy (Amati et al. 2002) or the peak bolometric luminosity (Yonetoku et al. 2004). Both correlations (Amati relation and Yonetoku relation) have been derived from the time integrated spectra assuming isotropic emission. Actually, the Amati relation (, with keV when is given in units of erg, and , Amati et al. (2008)) has been questioned by various authors (Band & Preece 2005; Butler et al. 2007, 2009; Shahmoradi & Nemiroff 2011), but it is a matter of fact that this relation is confirmed by all GRBs (more than 150) with known redshift and determined discovered thus far, except GRB 980425 (but see Yamazaki et al. 2003; Ghisellini et al. 2006), the nearest and less energetic event ever observed (). Many models have been suggested to explain the Amati relation (see discussion in Ghirlanda et al. (2010)). We should list some of them. Namely, they are: the model proposed by Zhang & Mészáros (2002) in the context of the standard synchrotron shock scenario, which is based on the assumption that a considerable fraction of the prompt emission flux is due to blackbody (Rees & Mészáros 2005; Thompson 2006; Thompson et al. 2007), the model proposed by Giannios & Spruit (2007), which is based on the magnetic reconnection mechanism, in which the flow that powers a GRB is initially Poynting flux dominated, the model proposed by Panaitescu (2009), in which the prompt emission is synchrotron radiation from the external shock. The tests already performed for these models show that either the theoretical expectations are not found in the data (e.g., Ghirlanda et al. 2007) or the constraints imposed by the models could not be verified with the observations.
Given the significant evolution of the GRB spectra and the fact that many models can predict the shape of the instantaneous spectra, studies of the measured time–resolved spectra have also been performed by several authors. These studies are strongly expected to go deeper in the issue of the radiative mechanisms at work during the prompt emission. Thus far, fits of time–resolved spectra with physical and/or semi–empirical models have already been performed. One of these models is a simple blackbody (bb) (Ghirlanda et al. 2003), that was found to be suitable to describe the first few seconds of GRB prompt emission. Another model is the sum of a bb plus a power–law component (Ryde 2004, 2005) with time-dependent spectral parameters. This spectral model was found to describe the time–resolved spectra of the prompt emission of a sample of BATSE GRBs. Later, Ryde & Pe’er (2009) have confirmed the validity of this blackbody plus power-law model using a sample of 56 bright BATSE GRBs. The authors stress the fact that the existence of a thermal component is a natural outcome of the fireball model. In fact, in the fireball scenario, in addition to an internal shock emission region, it is expected to see a thermal emission from the region where the fireball becomes optically thin (optical depth ) during its expansion (fireball photosphere). Indeed, detailed calculations performed by Fan (2010) show that a thermal component should be apparent for reasonable values of the GRB parameters (isotropic-equivalent outflow luminosity erg s-1, final bulk Lorentz factor and initial radius of the outflow cm).
However, observational results show a more complex phenomenology. In a well–studied case of the Fermi GRB 080916C (Zhang & Pe’er 2009; Fan 2010), in which outflow parameters have been constrained and a significant thermal emission should have been visible, no evidence of a thermal component was found (Abdo et al. 2009b). A multicolor blackbody plus a power–law model is the best description of the prompt emission spectrum of GRB 090902B given by Ryde et al. (2010), but see also Zhang et al. (2011); Pe’er et al. (2012). In some other cases, like GRB 100724B, the spectrum shows, in addition to the Band function, a component which is consistent with a blackbody with a temperature of about 40 keV (Guiriec et al. 2011). Also GRB110721A, a burst dominated by a single emission episode, shows a time–resolved spectrum that has been described with a Band function plus a blackbody component (Axelsson et al. 2012). But, in general, the Band function, with a possible cutoff at very high energies (Ackermann et al. 2012), fits the data. The absence of a thermal component in many GRBs could be due to the fact that the outflow properties change from burst to burst. For example, for a relativistic outflow dominated by a Poynting flux component (Lyutikov & Blandford 2003), a very weak thermal photospheric emission is expected. Alternatively, its absence could be, e.g., due to the limited passband of the used detector, for example, a threshold passband higher than that would be required for the detection of the thermal component. In the case of BATSE, the lower energy threshold is about 25 keV, while in the case of the Fermi/GBM instrument it is 10 keV. If the thermal emission is characterized by a lower temperature (a 1 keV was found by Frontera et al. (2001)), it could escape most of the observations of the GRB prompt emission performed thus far. Actually, thermal components have been observed in the early afterglow of a number of Swift GRBs (Starling et al. 2012; Sparre & Starling 2012; Friis & Watson 2013), thanks to the low energy threshold (0.5 keV) of the X–ray Telescope (XRT) aboard.
The Wide Field Cameras (WFCs) aboard the BeppoSAX satellite were among the few instruments that detected GRB prompt emission down to 2 keV (Frontera et al. 2009; Guidorzi et al. 2011; Frontera et al. 2012a, b). Some of these GRBs were simultaneously observed with BATSE. In this work, using the time–resolved spectra of GRBs detected with both WFCs and BATSE (among which GRB 990123, that is part of the Ryde & Pe’er (2009) sample), we report on the results obtained from the test of the bb plus pl model adopted by Ryde & Pe’er (2009) but also suggested by Lazzati et al. (2009), the search of a bb component in addition to bf, and the test of the X–ray spectral model (grbcomp) recently proposed by some of us (Titarchuk et al. 2012, hereafter T12).
grbcomp is essentially a photospheric model for the prompt emission of GRBs. Its main ingredients are a thermal bath of soft seed photons which are Comptonized by a subrelativistically expanding outflow characterized by a Maxwellian electron plasma with temperature and Thomson optical depth . A non–relativistic expansion at the beginning of the explosion is also expected in the electromagnetic outflow model by Lyutikov & Blandford (2003). The outgoing emerging spectrum at least up to the peak of the diagram is the result of multiple Compton scatterings of the seed photons in an hot environment having . Under these conditions, the Comptonization parameter where , and quasi-saturated spectra are produced. The immediate consequence of this result is that the peak energy of the spectrum mostly depends on the electron temperature , with a modification induced by the fact that the plasma is not static, but subrelativistically moving outwards (T12). The high-energy power-law tail above the energy peak of the model is instead phenomenologically obtained by the convolution of the subrelativistic Comptonized spectrum with a broken powerlaw upscattering Green’s function. The reason for this pure mathematical treatment of the second part of the spectrum resides on the fact that, whatever its origin, the underlying process giving rise to tails extending in some case up the GeV energies cannot be treated using classical Comptonization equations (e.g. Fokker-Planck approximation), but presumably will require a fully relativistic treatment of the photon-electron interaction. Possible physical interpretations of the last convolution are discussed by T12. A possible scenario is an explosion inside the progenitor star with the production of a sea of seed photons plus, in a small region, likely around the star spin axis, a hot Compton cloud. Due to the radiation pression, a hot outflow is activated, whose velocity is sub-relativistic until the sonic point, where it becomes relativistic. In the relativistic jet region the optical depth is less than 1, thus only a small fraction of the photons Comptonized during the non relativistic phase are further up scattered. Most of the photons freely pass through the jet. The small fraction of up scattered in the jet is strictly directed along the jet direction, while the photons Comptonized in the subrelativistic stage of the outflow are isotropically emitted. The photons up-scattered by the jet only modify the high energy tail of the emitted spectrum. In this case, the convolution can be interpreted as an Inverse Compton of the relativistic plasma outflow with the Comptonized photons.
Another possibility is that the electron distribution of the Compton cloud is not fully Maxwellian, but is characterized by an hybrid distribution with a suprathermal powerlaw component. In this case, the two-step approach of the radiative transfer equation of grbcomp – solution of subrelativistic Fokker-Planck equation and its convolution with the up-scattering Green’s function – would exactly mimic the multiple scattering photon interaction off a hybrid thermal/non-thermal electron population.
The grbcomp model somewhat resembles the scenario proposed by Lazzati et al. (2000) for their Compton-drag model, but with two main differences. In grbcomp the outflow is subrelativistic and multiple scatterings are assumed, while in Lazzati et al. (2000) the spectrum is formed from single-scattering Inverse Compton of the thermal photons off a relativistic outflow. From the numerical simulations performed by T12, it results that the photon peak energy of the spectrum is mainly related to and, at lower level, to the bulk parameter (see below), while the released energy depends on both the electron and seed photon temperatures.
2 GRB sample and spectral analysis
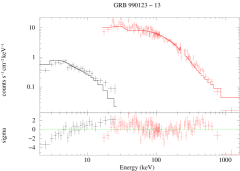
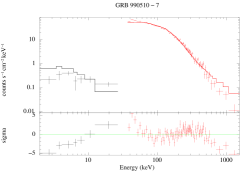
The entire number of GRBs simultaneously detected with WFCs and BATSE is 20: 960720, 970111, 970508, 971206B, 971214, 971227, 980109, 980326, 980329, 980425, 980519, 990123, 990510, 990625, 990806, 990907, 991014, 991030, 991105, and 000424. However, only four of them (970111, 980329, 990123, and 990510) were sufficiently bright to allow a fine time–resolved spectroscopy (see Table 1) in both instruments. These GRBs are the same used to derive the time–resolved – correlation (Frontera et al. 2012a, b).
The instrumentation that detected these bursts is widely described in the literature. For the BATSE experiment see, e.g., Fishman et al. (1994), for WFC, see Jager et al. (1997). The BATSE spectra were taken from the Large Area Detectors (LADs), whose typical passband is 25–2000 keV. The LADs provide various types of data products. The data used for this analysis are the High Energy Resolution Burst (HERB) data, that provide 128 energy channels with a minimum integration time of 64 ms. For details on the BATSE spectral data products and detector response matrix, see Kaneko et al. (2006) and references therein.
The WFCs consisted of two coded aperture cameras, each with a field of view of 40 (full width at zero response) and an angular resolution of 5 arcmin. They operated in normal mode with 31 energy channels in 2–28 keV and 0.5 ms time resolution.
The background–subtracted light curves of the 4 strongest GRBs in our sample detected with both BATSE and WFCs are shown in Fig. 1. For the BATSE data, the background level was estimated using the count rates immediately before and after the GRBs. Given that the background is variable during the GRB, it was estimated by means of a parabolic interpolation, channel by channel, between the background measured before the event and that after the event. Instead, for WFC spectra, the background level was estimated using an equivalent section of the detector area not illuminated by the burst or by other known X-ray sources. We also checked the consistency of this background level with that obtained by using the data before and after the burst.
We subdivided the time profile of each GRB into a number of time slices (see Table 1) taking into account the GRB profile (visible pulses, their rise, peak, and decay) as observed with 1 s time resolution (in the case of BATSE the real integration time was 1.024 s) and the count statistics (see Figure 1). We performed the spectral analysis in all of the time slices (most of them) in which it was possible to constrain the model parameters. In the case of GRB 990123, we excluded from the analysis the time intervals from 21 to 26, given that this part of the event was observed by WFC through the Earth’s atmosphere. The number of time intervals in which we subdivided the time profile of each event, the number of selected time slices in which the spectral analysis was performed, the GRB fluence, and its redshift when known, are given in Table 1.
We used as input models bbpl, bbbf, and grbcomp. In all fits, a normalization factor between BATSE and WFC data was included and left free to vary in the range 0.8–1.2, to account for a possible intercalibration error. Actually, we found that, for all analyzed GRB spectra, this parameter was consistent with 1 within one standard deviation, except in two cases (one time resolved of GRB 970111 and another of GRB 990123), in which it is consistent with 1 at 90% confidence level. The systematic error used by the BATSE team to take into account the uncertainty in the background subtraction and the uncertainty in the instrument response function (see, e.g., Kaneko et al. (2006) for details) was included in the fit.
The fit results with the bf function alone have already been published (Frontera et al. 2012a, b). In the case of the first model, in addition to the normalization constants for bb and pl, the other free parameters are the bb temperature (in keV) and the power–law photon index . In the case of the bbbf, in addition to the normalization constants for bb and bf, the other free parameters are the bb temperature (in keV), the photon indices and , and the peak energy in the observer frame . In the case of the grbmcomp model, in addition to its normalization constant , (where is the apparent photospheric radius in units of cm, and is the source distance in Mpc), the other free parameters, in the rest frame, are the temperature of the seed photons (in keV), the plasma electron temperature (in keV), the effective optical depth of the plasma outflow, the plasma outflow bulk velocity , and the power–law photon index of the component above the peak energy. From the model best–fit parameters, it is also possible to derive the bulk parameter , which, for the case of a constant outflow velocity, is defined as:
| (1) |
where , and and is an effective optical depth such that . The definition of an effective optical depth was introduced to separate the space and energy operators in the radiative transfer Fokker-Planck equation (see Eq. (6) in T12), which provides a much faster way for getting numerical solutions. In grbcomp it is assumed , where is the actual free parameter of the model. Finally, despite being in principle a free parameter, the outflow subrelativistic velocity is kept frozen in the fitting procedure, to avoid parameter degeneracy or too large uncertainties. In our analysis we assumed . This value is the median value of those consistent with grbcomp (see Fig. 2).
Each model was assumed to be photoelectrically absorbed (WABS model in xspec). Given that the absorption column density could not be constrained, a Galactic absorption along the GRB direction (Kalberla et al. 2005) was assumed. While the bbpl model was separately fit to the BATSE spectra alone and to the joint WFC plus BATSE spectra, the grbcomp was only fit to the joint WFC plus BATSE spectra. To deconvolve the count rate spectra, we adopted the xspec (v. 12.5) software package (Arnaud 1996). If not explicitly stated, the quoted uncertainties are single parameter errors at 90% confidence level.
3 Results
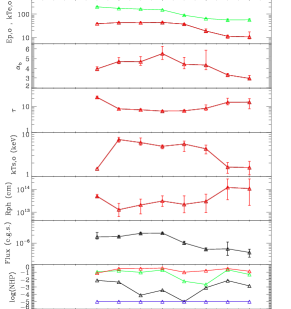
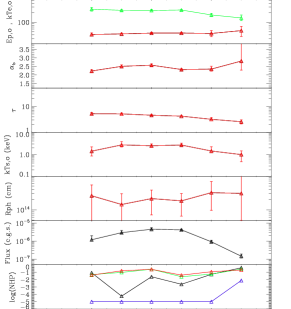
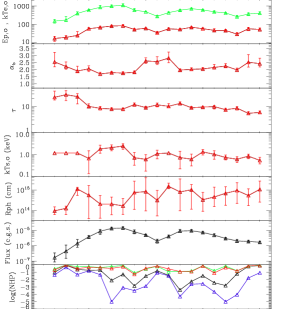
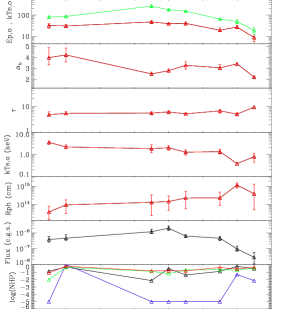
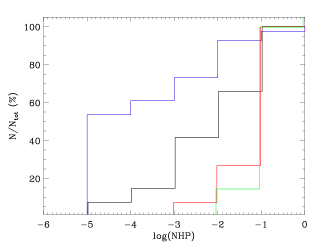
The fit results of the bbpl and grbcomp models to the joint WFCBATSE time–resolved spectra are reported in Table 3, while the time behavior of the grbcomp parameters and of the Null Hypothesis Probability () for all joint fits and when the bbpl model is fit to the time–resolved BATSE spectra alone, are reported in the four panels of Fig. 3. In Figure 4, the cumulative distribution of displays the fraction of intervals with a good fit for each model.
3.1 Fit with bbpl and bfbb
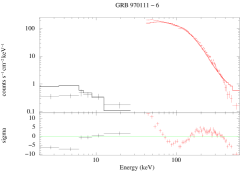
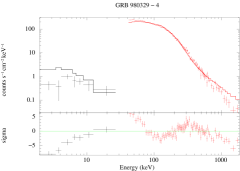
As it can be seen from Table 3 and from behavior of ( see Fig. 3 and Fig. 4), the fit with bbpl is acceptable only when we fit this model to the time–resolved BATSE spectra alone, as found by Ryde & Pe’er (2009). When the joint WFCBATSE spectra are considered, for the majority of the time–resolved spectra this model cannot be accepted. Examples of these fits are shown in Fig. 5. The reason for the unsuccessful fit of a BB+PL model appears to reside in the fact that the data show a steepening at lower energies below the bb peak. Indeed, as it can be clearly seen in Fig. 5, the residuals between the data and the model show that below 10 keV the data are systematically under the model continuum. Thus the slopes of the observed GRB spectra below and above the bb component are different, and cannot be simultaneously fitted by a single power–law index. This behavior cannot be observed with BATSE because of its low energy threshold around 20 keV. This result shows the importance of having a spectral coverage as large as possible, especially down 1-2 keV, for constraining the prompt emission models.
The fit with bfbb was performed only for those GRB time–resolved spectra, for which the fit with the bf alone provides a significantly higher than that expected in the case of a good fit (see results in Frontera et al. 2012a, b). The list of these spectra and of the results obtained by fitting them with bfbb are reported in Table 2. For each time interval not well fit with a Band function, mindful of the Protassov et al. (2002) warnings, we report, in addition to the results of the ”F-test/add” for the addition of a further component (bb) to a fitting function (bf), the results of the ”F-test/plain” for testing the discrepancy between an assumed fit function and its parent function . This test (see Bevington 1969, p. 195) makes use of the probability distribution of the ratio (or ) where is obtained from the fit of the function 1 (in our case bf) to the data, and is obtained from the fit of the function 2 (in our case, bfbb). (For an application of the latter test see Frontera et al. (2004)).
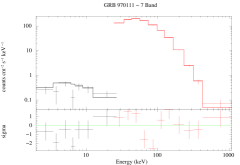
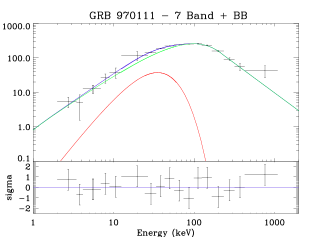
As it can be seen from Table 2, we do not find any positive result using the F-test/plain, while, using the F-test/add, in one case (interval No. 7 of GRB 970111 light curve, see Fig. 1) we find a significant decrease of the found with bf, with a chance probability of that the reduction is due to chance when a bb is added to bf. In the other cases, also reported in Table 2, the chance probability obtained with the F-test/add is not less than 1%.
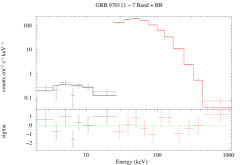
In the case of the interval No. 7 of GRB 970111, using a bfbb model, the best–fit spectral parameters, in the observer frame, are the following: , , keV, and keV. The bf parameter values are slightly different from those obtained when the spectrum was fit with a bf alone: , , keV (Frontera et al. 2012a, b). In Fig. 6 (top panels), we show the best–fit curve of the bf and bfbb models to the observed spectrum, while in the bottom panel (left side), we show the spectrum when the fit is performed with bfbb. Unlike that found by, e.g., Guiriec et al. (2011), we find (see Table 2) low bb temperatures ( keV for GRB 970111, interval 7), except in two cases (GRB 990123, intervals No. 9 and 12). Apart from these few spectra (14% of the total), no additional component to the bf is required by the data (Frontera et al. 2012a, b).
3.2 Fit with grbcomp
The fit results of the grbcomp model to the joint WFCBATSE time–resolved spectra are also reported in Table 3 (in square parenthesis, those parameters kept fixed in the fits). As it can be seen from this Table, and from the behavior of the Null Hypothesis Probability () reported in each of the four panels shown in Fig. 3, and from the cumulative distribution shown in Fig. 4, the grbcomp model fits well, in some cases even better than bf (see behavior in Figs. 3 and 4), almost all the available WFCBATSE time–resolved spectra.
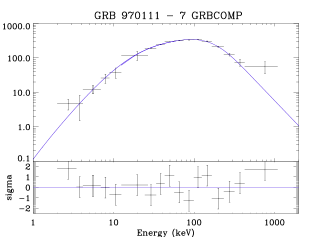
The goodness of the fit of the grbcomp model to the data is exemplified in the bottom right panel of Fig. 6, where we show the fit of grbcomp to the spectrum No. 7 of GRB 970111. As it can be seen, this spectrum can be equally well fit with both bfbb and grbcomp, with the advantage that grbcomp can describe all the broad–band time spectra in our sample and is a physical model.
The fact that grbcomp fits so well all the spectra, stimulated us to investigate, in addition to the time evolution of the grbcomp model parameters, also the search for possible correlations between grbcomp parameters and between model parameters and measured flux (or luminosity when the GRB redshift is known).
The most relevant results of our investigation are summarized below.
3.3 Time evolution of the grbcomp parameters
The time evolution of the grbcomp best–fit parameters, shown (in red) in Fig. 3, is very suggestive. For all GRBs in our sample, the electron temperature in the observer frame shows a time behavior almost similar to that of the corresponding peak energy , as obtained from the best–fit results (Frontera et al. 2012a, b) of the same data with bf. It also immediately appears that tracks the flux.
We also find that the high energy index of the grbcomp model shows a time behavior similar to that of the power–law photon index of the bb pl model (see Table 3). We warn, however, that this model does not fit most of the time–resolved spectra. However, the absolute values of are much lower than , rising the energetics issue for the bbpl model that we will discuss in Section 4.
From Fig. 3 it also appears that the intrinsic seed photon temperature and the photospheric radius (see Section 4 for its definition) are anticorrelated: when decreases with time, increases. Instead the optical depth is almost stable (990510) or slightly decreases with time.
Given that the grbcomp model predicts the instantaneous spectral properties of the GRB prompt emission as a function of its main ingredients (outflow properties, soft photon temperature, etc; see Section 1), the consistency of our results with the model predictions can be only seen by investigating the correlations between time–resolved measured parameters. The results of this investigation are reported below.
3.4 vs. flux and other model parameters
We find, as shown Fig. 7 and Table 4, that, for three GRBs (970111, 990123, 990510), and are positively correlated with each other. For two of them (990123 and 990510) their correlation is well described by a power–law [], with a positive power–law index . The values of are consistent with a weigthed average of . The correlation is almost absent for the fourth GRB (980329).
In addition we find a positive power–law correlation between (in the observer frame) and the 2–2000 keV flux [] for all GRBs, except the case of GRB 980329, for which we find an almost absent correlation or, at most, with a value of that very slightly increases with flux. This is shown in Fig. 8 and in Table 5. This correlation is reminiscent of the power–law correlation between and flux, that was already found and reported for the same events (Frontera et al. 2012a, b), with the index of the –flux correlation basically lower than that of the –flux correlation: against for GRB 970111, against for GRB 980329, against for GRB 990123, and against for GRB 990510. If we exclude GRB 980329, the power-law index of the other three GRBs is statistically consistent with their weighted mean value . The fact that the dependence on flux almost disappears in the case of GRB 980329 is discussed in Section 4.1.
We do not find any correlation between and the apparent photospheric radius (970111: , ; ; 990123: , ; 990510: , ).
3.5 Intrinsic peak energy and electron temperature versus other model parameters
In addition to the above discussed correlation between and , we have performed the search for a possible correlation between and the optical depth , with negative results for 970111 (, ), 990123 (, ), and 990510 (, ). Instead, a possible hint of correlation (at a few percent significance) is found in the case of 980329 (, ).
We do not find any correlation between and the seed photon temperature for three GRBs: 980329 (, ), 990123 (, ), 990510 (, ), while, in the case of 970111, we find a low significance correlation (, ),
Instead, we find a strong negative correlation between peak energy and the bulk parameter , except in the case of the peculiar GRB 980329, where this correlation is not statistically significant. This result is shown in Fig. 9 and in Table 6. In the light of the grbcomp model, it is a consequence of the correlation between and , given that is inversely proportional to (see eq 1). But, independently of that, a negative correlation is also expected because a higher leads to softer spectra and thus to lower peak energies . In fact, the Comptonization spectra become softer if they take into account the bulk outflow effect, while they are getting harder in the case of a bulk inflow (Laming & Titarchuk 2004).
3.6 Seed photon temperature versus flux and photospheric radius
The behavior of the seed photon temperature with the 2–2000 keV flux is shown Fig. 10. As it can be seen from this figure and from the fit results reported in Table 7, increases with flux not according to a power–law, except in the case of GRB 980329, in which this law gives the best description of the data, with an index .
An outstanding anti-correlation between seed photon temperature and the photospheric radius is found (see Fig. 11), which is well described by a power–law, with best–fit parameters reported in Table 8. By summing together the data points of GRBs with known redshift (980329, 990123 and 990510), we find the very robust result (, ) also shown in Table 8 and Fig. 12, with a weighted mean power–law index of .
4 Discussion
By merging together the WFC and BATSE prompt emission spectra of 20 GRBs simultaneously observed with both instruments, it has been possible to perform a time–resolved analysis in the broad energy band from 2 keV to 2 MeV, still scarcely explored. For each GRB time profile, we have obtained a number of time–resolved spectra. The highest number of time–resolved spectra has been obtained for the brightest GRBs in our sample: 970111 (8 spectra), 980329 (6), 990123 (19), and 990510 (8), with a total number of 41 spectra.
With the brightest GRBs in our sample, we tested three physical models: the bbpl model proposed by Ryde & Pe’er (2009), in which bb is the blackbody radiation emitted at the photospheric radius and pl could describe a non–thermal component (like synchrotron or Comptonization of blackbody photons), the sum of a bb plus the bf function, and the grbcomp model proposed by T12.
As discussed in Section 1, Ryde & Pe’er (2009) found that the bbpl model is consistent with the time–resolved spectra of about 50 GRBs detected with BATSE in the energy band from 25 to 1900 keV. This result was very appealing, even if the derived values of the power–law photon index , generally (see Table 3), would require an energy break beyond 2 MeV to avoid a divergence of the total emitted power. Such breaks generally are not observed in the GRBs detected with the Large Area Telescope (LAT) aboard the Fermi satellite (see, e.g., Abdo et al. 2009b, c, a), but they could be present in a significant fraction of GRBs not detected with LAT (Ackermann et al. 2012).
We find however that, when extending the energy band of the time–resolved spectra down to 2 keV, the bb pl model does not fit our spectra (see examples in Fig. 5), except for a very few cases, near the GRB onset (see Table 3).
As shown in a previous paper (Frontera et al. 2012a, b), the bf function gives a good description of most time–resolved spectra of the GRBs in our sample. In the few cases (6 of 41 spectra) in which this is not the case, we have added to bf a bb that resulted to describe well the prompt emission spectra of a few Fermi GRBs (Guiriec et al. 2011; Tierney et al. 2013; Ghirlanda et al. 2013). In our case, we find that this addition gives a significant improvement of the fit only in one case (interval No. 7 of GRB970111, see Table 2 and Fig. 6).
Instead, we find that the grbcomp model fits very well almost all the time–resolved spectra, in some cases, even better than the empirical bf (see bottom panels of Fig. 3 and Fig. 4). Given this result, we have further investigated this model also to understand if the best–fit parameter values derived, their time behavior and their correlation with other parameters of the same model or bf, are physically acceptable.
According to grbcomp, the intrinsic peak energy of the spectrum has a power–law dependence on the intrinsic outflow electron temperature according to the following equation
| (2) |
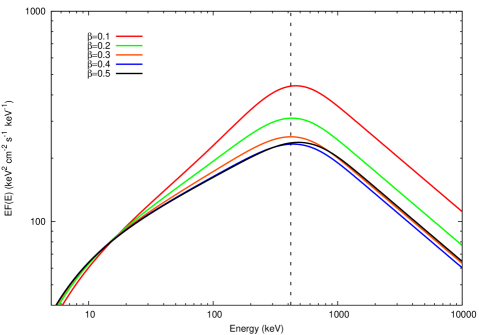
where the parameters ) and are both dependent on time and optical thickness at which the observed spectrum is coming out. In Figure 13 we show the model prediction and the dependence of the power–law parameters on the optical depth of the electron cloud. The best fit to the parameters data points derived from the numerical code is obtained by the two following empirical functions:
| (3) |
where , (frozen), , and ,
and
| (4) |
where (frozen), (frozen), , , and .
It is worth noting the asymptotic forms of these two functions for , namely and , which lead to the well known relation, in units, , typical of fully saturated Comptonization.
We find, as shown in Fig. 7 and in Table 4, that and are indeed positively correlated with each other according to a power–law for three of the 4 GRBs (970111, 990123, and 990510), while this correlation is absent for GRB 980329. This seemingly strange behavior of 980329 is discussed below (see Section 4.1). The measured power-law index () for 970111, 990123, 990510 (weighted mean value ) is greater than 1, and, from the best–fit values found for (see Table 3), it is consistent, within its statistical uncertainties, with that expected.
In agreement with the grbcomp model expectations, we find that the electron temperature of the outflowing plasma is positively correlated with flux, except in the case of the peculiar event 980329. In this case, we find an almost flat dependence of on flux, likely as a consequence of the behavior of versus for this event (see Section 4.1).
Consistently with the grbcomp model predictions, we also find that the electron temperature of the outflowing plasma is not correlated with the seed temperature of the bb photon bath.
It is noteworthy that the grbcomp model gives a physical interpretation of the low-energy power–law photon index with its sign of bf (Band et al. 1993). According to grbcomp, the corresponding energy index is related to the index (slope) of the Comptonization Green function and thus to the bulk parameter (see T12):
| (5) |
where depends on the Comptonization level. In the case of saturated Comptonization, , and . Thus an almost linear correlation between and is predicted. Our results confirm the model prediction for GRBs 970111, 980329, and 990123, while for GRB 990510 the correlation is not significant (see Table 9 and Fig. 14).
In agreement with the model expectations, we find a positive correlation between radiation flux and intrinsic seed photon temperature (see Fig. 10). This correlation is not well described by a power–law, except one case (980329) in which a power–law () gives a good fit, with an index consistent with 0.25. This index is expected when all the parameters which determine the GRB luminosity [see eq. (6)], but the BB temperature , are fixed during the event (see Sect. 4.1). In general, the luminosity and thus the flux, for a given (see Fig. 2), depend on , on the BB emitting surface and on the Comptonization enhancement factor , which is proportional to the electron plasma temperature (T12). Indeed, for 3 of the 4 events in our sample, assuming a power–law (but the fit is not good), the index is found to be consistent with 0.5.
Another important result of our test is shown in Fig. 11: the seed photon temperature anticorrelates, following a power–law, with the photospheric radius (), with an average value of the power–law index for the three GRBs with known redshift (see Table 8). In the scenario of the grbcomp model, this negative correlation, found to occur during the entire GRB prompt phase, is a consequence of the dependence of the BB luminosity on and on the BB emitting area , which is proportional to . Thus, if would be constant, then . But, this a special case. The fact that average power–law index is about 0.9 is a strong hint that is not constant during the prompt emission. In any case, what is important is the fact that, when increases, the seed photon temperature drops. The photospheric radius is found to increase from to cm for all GRBs of our sample, but GRB 980329 (see Sect. 4.1). This range of values is consistent with other model predictions (e.g., Zhang & Pe’er 2009).
The seed photon temperature we found could appear not consistent with an origin from the star photosphere, dominated by optical-UV photons. In fact, when the star explodes, its parts next to the outflow should be hotter than the effective temperature of the star atmosphere because the subrelativistic outflow heats them. More precisely, as the outflow passes throughout the star atmosphere while moving outwards, together with kinetic energy dragging, the development of turbulent mixing dictated by Kelvin-Helmholtz instabilities is expected. Consequently, the outer parts of the hot outflow, while interacting with the much cooler star photosphere, unavoidably are expected to cool down, leading to the formation of a seed photon population with characteristic energy in the range between that of the optical-UV star photons and of the outflow electrons at hundreds keV. This photon field presumably illuminates the outflow either from backward or, at most, at right angles (depending on the distance from the star where spectral formation mostly occurs) and is different from the isotropic optical-UV photon field assumed by Lazzati et al. (2000) to be present since before the GRB event.
4.1 GRB 980329: does this event confirm the grbcomp predictions?
As discussed above, GRB 980329 show peculiar properties, seemingly in contrast with the grbcomp predictions. Unlike the other three events in our sample, its intrinsic peak energy is almost independent on (see Fig. 7); in addition it does show an almost insignificant anticorrelation between and the bulk parameter (see Fig. 9), and between the seed photon temperature and the photosperic radius . Other peculiarities, that we have already discussed, concern an almost absent dependence of on flux, and a dependence of on flux according to a power–law with an index of 0.25.
All these peculiarities are found to be related to the fact that is constant during the event (see Fig. 3) and that also the bb emission region has to be almost constant. These features are a matter of fact, are not required by the model and may depend on the properties of the electron plasma and phenomenon evolution.
In the context of the grbcomp model, the consequences of a constant electron-temperature behaviour as a function of time unavoidably are expected to impact, in a well-predictable way, on the other parameters. We have established these consequences and found that all of them are satisfied by the data. If is almost constant, we do not expect a correlation between and , and this result is found (see Fig. 7). In addition, we expect a weak or no dependence of the measured 2–2000 keV flux on , which is also found (see Fig. 8). We expect a weakening of the correlation between and (see eq. (1)), given that only the electron cloud optical thickness variations influence , which is also observed (see Fig. 9). Thus we expect a dependence of on , which is found in the data, as it can be seen in Fig. 15.
The constancy of the bb emission region during the prompt emission, derives from (and tests) the main assumption of the grbcomp model, i.e., that the GRB luminosity (see eq. (6)), as discussed above, depends, in addition to the Comptonization enhancement factor, on the seed photon luminosity assumed to be a blackbody emission (). In the case of GRB 980329, given that the electron temperature does not significantly change with time, the received flux should depend on the BB temperature and on the blackbody emission region size (). If also this surface does not change during the prompt emission, we expect no correlation between flux and , no correlation between and , and a power–law dependence of on flux with an index of 0.25. All these conditions are satisfied in the case of GRB 980329: almost independent of flux (see Fig. 16), no correlation between and (see Table 8 and Fig. 11) and a power–law dependence of on flux with an index , which is consistent, within 1 with the expected value of 0.25.
A legitimate question is what observationally distinguishes GRB 980329 from the other GRBs in our sample. Our answer is that, unlike other events, 980329 shows a fast rise and exponential decay (FRED) light curve. It would be very interesting to test whether this feature is the observational signature of the behaviour we have observed in the correlations between grbcomp parameters or between these parameters and measured quantities (e.g., flux). Unfortunately, broad band observations extending down to 2 keV are not available in the current data sets. Future GRB missions with a detection threshold of 2 keV or less are desirable (see, e.g., Amati et al. 2013).
4.2 Interpretation of the – relation
The grbcomp model gives a physical interpretation of the – relation (T12). The model interprets the peak energy of the spectrum in terms of the temperature of the electron plasma modified by the plasma outflow bulk velocity and other properties, all expressed through the bulk motion Comptonization parameter . In this view, the – relation is interpreted as a result of the Stephan–Boltzmann law modified by the Comptonization enhancement factor , which, as discussed by T12, in the case of saturated Comptonization, is proportional to . The final result is that, on average, , or that and thus .
This interpretation can be extended to the time–resolved – relation found within each GRB by us (Frontera et al. 2012a, b) and other authors (Ghirlanda et al. 2010; Lu et al. 2012). Indeed, according to grbcomp, the GRB luminosity at a given time can be written as
| (6) |
where is the emitting area, and the other (intrinsic) quantities have already been defined above. However we have seen that is related to the outflow temperature through eq. (2), with the parameters and that may depend on time, because they are functions of which in general is not constant through the prompt emission phase.
For a given observing time interval (, ), which is short enough that all intrinsic (we omit the index ) quantities can be considered almost constant, the average luminosity and intrinsic peak energy are given by
| (7) |
| (8) |
If now the emission area follows the law (see equation [24] of T12), equation (7) becomes
| (9) |
where is the factor obtained by simply integrating the function over the interval (, ).
The Compton amplification factor (CAF) has a general dependence on the electron temperature and the optical depth, which can be approximated, as shown in Fig. 17 obtained with a numerical code, by a power–law:
| (10) |
where the dependence on of the parameters and can be best fit by two following empirical functions, similar to those describing and (see eqs. 3 and 4):
| (11) |
where , , , , ,
and
| (12) |
where , , , .
| (13) |
which can be reverted to
| (14) |
The intriguing implication of the last result is that the behavior of the parameters and , shown in Figs. 13 and 17, is such that the exponent of the term is always for any value of the optical depth , and not only in the asymptotic limit where and .
However, from eq. (14), only in the asymptotic case of very large optical depth when , we get
| (16) |
We actually find that, within each GRB, the measured flux is correlated with the electron temperature, while a correlation between flux and peak energy within each GRB is well established (see, e.g., Frontera et al. 2012a, b). As also expected, the correlation between flux and is almost absent when the electron temperature is almost constant during the event, as found for GRB 980329.
Similarly, for GRBs with time variable and known redshift (990123 and 990510), the intrinsic temperature of each GRB is correlated with the corresponding isotropic luminosity (see top panels of Fig. 18 and Table 10) according to a power–law (). When we merge these data (see bottom panel of Fig. 18 and Table 10), the power–law dependence of on , becomes more robust (see Table 10) with an average index , as expected in the scenario underlying the grbcomp model in the case the optical depth is not so large. Indeed, looking at the theoretical behaviour of (see Fig. 17) and at the best fit values of for 980329, 990123 and 990510 (Table 3), it becomes evident from eq. (14) that the relation should have , which is in full agreement with what we found.
Given the importance of the time behavior during the prompt emission and the change of from one GRB to other, the dispersion of these two parameters, in addition to , could be at the origin of the dispersion of the average – relation and eventually of the – relation.
5 Conclusions
With a sample of 4 strong GRBs (970111, 980329, 990123, and 990510) simultaneously detected with both BeppoSAX WFCs and BATSE we have performed a time–resolved spectral analysis in the energy band from 2 keV to 2000 keV. In total we derived 41 spectra, all used to test three different models: bbpl, bfbb, and the recently proposed model grbcomp.
We do not expect significant systematic errors from this joint analysis. The response functions of both instruments are well known. Indeed, in the fits the cross-calibration factor was found to be consistent with 1, in spite of being left free to vary between 0.8 and 1.2 (see Section 2). This is not the first time that a joint WFC/BATSE spectral analysis has been performed. Results of similar analyses have been reported in the past by the BATSE team (Briggs et al. 2000; Kippen et al. 2003, 2004). In addition, the BATSE–deconvolved spectra of bright GRBs were cross-checked with those obtained with BeppoSAX GRBM (Frontera et al. 2009); these in turn were cross-calibrated with WFC, with many published results (e.g. Frontera et al. 1998, 2000).
The result is that the bf function fits almost all spectra (Frontera et al. 2012a, b). In the few cases (14%) in which this function does not work, following other authors (Guiriec et al. 2011; Axelsson et al. 2012), we have added a bb. In one case we obtained a significantly better fit.
The fit of the time–resolved spectra with the bbpl model has provided negative results. Only in few cases this model is suitable to describe the time–resolved 2–2000 keV spectra, thus this model does not appears to interpret the 2–2000 keV GRB prompt emission spectra.
Instead, we find that the grbcomp model, even better than bf, describes almost all the 41 time–resolved spectra we have analyzed. Most of the predictions of this model have been confirmed by the discussed correlation results. Very constraining expectations of the grbcomp model have been tested and verified. Even the behavior of one of the four GRBs in our sample (980329), which is different from that of the other three, fits very well the expectations of the model. Moreover, this GRB gives the best opportunity to verify the validity of the model. In addition, the physical interpretation of the time–resolved – relation given by grbcomp is confirmed by our results.
The very good description of our time–resolved spectra with grbcomp model strengthens the physical scenario assumed by the model: an early subrelativistic expanding outflow that interacts with a bath of black–body seed photons whose temperature is a free parameter. This scenario is fully compatible with a supernova explosion. From the fit of the model to our data, we find that this temperature is in the keV range, which is not usual in a common supernova explosion (see, e.g., Lazzati et al. 2000). A likely interpretation is that the seed photons are energized by the jet. The best fit of our spectra with the grbcomp model is also in favor of an early non–relativistic phase of the outflow velocity. This is not the standard assumption in the collapsar model. However, as discussed by T12, whether the early expansion phase is soon relativistic may depend on several parameters, such as the initial jet energy, the chemical composition of the star envelope (in particular the presence or not of a H-envelope), the core angular momentum, and the influence of magnetic torques (Gehrels et al. 2009; Woosley 2011). Independently of all that, the important result of our test is that a Comptonization process of an initially non–relativistic expanding outflow with seed photons in a region close to the photospheric radius well describes the low energy part () of more than 40 time–resolved spectra. A further convolution of the Comptonized part of the seed spectrum with a Green function, physically representing a relativistic Inverse Compton (T12), well describes the high–energy part of our time–resolved spectra. T12 do not analyze in detail the possible mechanisms to get in the late phase a relativistic outflow. However the peak energy of the spectra is mainly determined by the temperature of the electron plasma non–relativistically outflowing. Possible scenarios for the formation of a relativistic phase are discussed in Section 1. The positive results obtained from the test of this model motivate us to study more in detail the formation of the relativistic stage of the model.
Unfortunately, our data are inadequate to perform an extended test of the grbcomp model. This test should be done with a large sample of GRBs observed in a very broad–energy band extending down to 2 keV like the time–resolved spectra obtained for the GRBs in our sample, in order to discriminate between the grbcomp and other models. Indeed, an important feature of the predicted grbcomp spectra is their break at low energies (see Fig. 7 of T12), where the blackbody spectrum of the seed photons takes over. Even the GBM experiment aboard Fermi is not fully adequate to test this model, having a passband with a lower threshold at about 10 keV. New satellite missions devoted to GRBs should include detectors with a broad passband extending down to at least 1 keV or even better below.
References
- Abdo et al. (2009a) Abdo, A. A., Ackermann, M., Ajello, M., Asano, K., Atwood, W. B., Axelsson, M., Baldini, L., Ballet, J., Barbiellini, G., Baring, et al. 2009a, ApJ, 706, L138
- Abdo et al. (2009b) Abdo, A. A., Ackermann, M., Arimoto, M., Asano, K., Atwood, W. B., Axelsson, M., Baldini, L., Ballet, J., Band, D. L., Barbiellini, G., & et al. 2009b, Science, 323, 1688
- Abdo et al. (2009c) Abdo, A. A., Ackermann, M., Asano, K., Atwood, W. B., Axelsson, M., Baldini, L., Ballet, J., Band, D. L., Barbiellini, G., Bastieri, et al. 2009c, ApJ, 707, 580
- Ackermann et al. (2012) Ackermann, M., Ajello, M., Baldini, L., Barbiellini, G., & et al. 2012, ApJ, 754, 121
- Amati et al. (2013) Amati, L., Del Monte, E., D’Elia, V., Gendre, B., Salvaterra, R., & Stratta, G. 2013, Nuclear Physics B Proceedings Supplements, 239, 109
- Amati et al. (2002) Amati, L., Frontera, F., Tavani, M., in’t Zand, J. J. M., Antonelli, A., Costa, E., Feroci, M., Guidorzi, C., Heise, J., Masetti, N., Montanari, E., Nicastro, L., Palazzi, E., Pian, E., Piro, L., & Soffitta, P. 2002, A&A, 390, 81
- Amati et al. (2001) Amati, L., Frontera, F., Tavani, M., in’t Zand, J. J. M., Costa, E., Guidorzi, C., Montanari, E., & Soffitta, P. 2001, in Gamma-ray Bursts in the Afterglow Era, ed. E. Costa, F. Frontera, & J. Hjorth, 34
- Amati et al. (2008) Amati, L., Guidorzi, C., Frontera, F., Della Valle, M., Finelli, F., Landi, R., & Montanari, E. 2008, MNRAS, 391, 577
- Arnaud (1996) Arnaud, K. A. 1996, in Astronomical Society of the Pacific Conference Series, Vol. 101, Astronomical Data Analysis Software and Systems V, ed. G. H. Jacoby & J. Barnes, 17
- Axelsson et al. (2012) Axelsson, M., Baldini, L., Barbiellini, G., Baring, M. G., Bellazzini, R., & et al. 2012, ApJ, 757, L31
- Band et al. (1993) Band, D., Matteson, J., Ford, L., Schaefer, B., Palmer, D., Teegarden, B., Cline, T., Briggs, M., Paciesas, W., Pendleton, G., Fishman, G., Kouveliotou, C., Meegan, C., Wilson, R., & Lestrade, P. 1993, ApJ, 413, 281
- Band & Preece (2005) Band, D. L., & Preece, R. D. 2005, ApJ, 627, 319
- Bevington (1969) Bevington, P. R. 1969, Data reduction and error analysis for the physical sciences (New York: McGraw-Hill, 1969)
- Blinnikov et al. (1999) Blinnikov, S. I., Kozyreva, A. V., & Panchenko, I. E. 1999, Astronomy Reports, 43, 739
- Briggs et al. (2000) Briggs, M. S., Preece, R. D., van Paradijs, J., in’t Zand, J., Heise, J., Kuulkers, E., & Kouveliotou, C. 2000, in American Institute of Physics Conference Series, Vol. 526, Gamma-ray Bursts, 5th Huntsville Symposium, ed. R. M. Kippen, R. S. Mallozzi, & G. J. Fishman, 125–129
- Butler et al. (2009) Butler, N. R., Kocevski, D., & Bloom, J. S. 2009, ApJ, 694, 76
- Butler et al. (2007) Butler, N. R., Kocevski, D., Bloom, J. S., & Curtis, J. L. 2007, ApJ, 671, 656
- Crider et al. (1997) Crider, A., Liang, E. P., Smith, I. A., Preece, R. D., Briggs, M. S., Pendleton, G. N., Paciesas, W. S., Band, D. L., & Matteson, J. L. 1997, ApJ, 479
- Fan (2010) Fan, Y.-Z. 2010, MNRAS, 403, 483
- Fishman et al. (1994) Fishman, G. J., Meegan, C. A., Wilson, R. B., Brock, M. N., Horack, J. M., Kouveliotou, C., Howard, S., Paciesas, W. S., Briggs, M. S., Pendleton, G. N., Koshut, T. M., Mallozzi, R. S., Stollberg, M., & Lestrade, J. P. 1994, ApJS, 92, 229
- Friis & Watson (2013) Friis, M., & Watson, D. 2013, ApJ, 771, 15
- Frontera et al. (2000) Frontera, F., Amati, L., Costa, E., Muller, J. M., Pian, E., Piro, L., Soffitta, P., Tavani, M., Castro-Tirado, A., Dal Fiume, D., Feroci, M., Heise, J., Masetti, N., Nicastro, L., Orlandini, M., Palazzi, E., & Sari, R. 2000, ApJS, 127, 59
- Frontera et al. (2012a) Frontera, F., Amati, L., Guidorzi, C., Landi, R., & in’t Zand, J. 2012a, ApJ, 754, 138
- Frontera et al. (2012b) —. 2012b, ApJ, 757, 107
- Frontera et al. (2004) Frontera, F., Amati, L., in ’t Zand, J. J. M., Lazzati, D., Königl, A., Vietri, M., Costa, E., Feroci, M., Guidorzi, C., Montanari, E., Orlandini, M., Pian, E., & Piro, L. 2004, ApJ, 616, 1078
- Frontera et al. (2001) Frontera, F., Amati, L., Vietri, M., in ’t Zand, J. J. M., Costa, E., Feroci, M., Heise, J., Masetti, N., Nicastro, L., Orlandini, M., Palazzi, E., Pian, E., Piro, L., & Soffitta, P. 2001, ApJ, 550, L47
- Frontera et al. (1998) Frontera, F., Costa, E., Piro, L., Muller, J. M., Amati, L., Feroci, M., Fiore, F., Pizzichini, G., Tavani, M., Castro-Tirado, A., Cusumano, G., dal Fiume, D., Heise, J., Hurley, K., Nicastro, L., Orlandini, M., Owens, A., Palazzi, E., Parmar, A. N., in ’t Zand, J., & Zavattini, G. 1998, ApJ, 493, L67+
- Frontera et al. (2009) Frontera, F., Guidorzi, C., Montanari, E., Rossi, F., Costa, E., Feroci, M., Calura, F., Rapisarda, M., Amati, L., Carturan, D., Cinti, M. R., Dal Fiume, D., Nicastro, L., & Orlandini, M. 2009, ApJS, 180, 192
- Gehrels et al. (2009) Gehrels, N., Ramirez-Ruiz, E., & Fox, D. B. 2009, ARA&A, 47, 567
- Ghirlanda et al. (2007) Ghirlanda, G., Bosnjak, Z., Ghisellini, G., Tavecchio, F., & Firmani, C. 2007, MNRAS, 379, 73
- Ghirlanda et al. (2003) Ghirlanda, G., Celotti, A., & Ghisellini, G. 2003, A&A, 406, 879
- Ghirlanda et al. (2010) Ghirlanda, G., Nava, L., & Ghisellini, G. 2010, A&A, 511, A43
- Ghirlanda et al. (2013) Ghirlanda, G., Pescalli, A., & Ghisellini, G. 2013, MNRAS, 432, 3237
- Ghisellini et al. (2006) Ghisellini, G., Ghirlanda, G., Mereghetti, S., Bosnjak, Z., Tavecchio, F., & Firmani, C. 2006, MNRAS, 372, 1699
- Giannios & Spruit (2007) Giannios, D., & Spruit, H. C. 2007, A&A, 469, 1
- Guidorzi et al. (2011) Guidorzi, C., Lacapra, M., Frontera, F., Montanari, E., Amati, L., Calura, F., Nicastro, L., & Orlandini, M. 2011, A&A, 526, A49+
- Guiriec et al. (2011) Guiriec, S., Connaughton, V., Briggs, M. S., Burgess, M., Ryde, F., Daigne, F., Mészáros, P., Goldstein, A., McEnery, J., Omodei, N., Bhat, P. N., Bissaldi, E., Camero-Arranz, A., Chaplin, V., Diehl, R., Fishman, G., Foley, S., Gibby, M., Giles, M. M., Greiner, J., Gruber, D., von Kienlin, A., Kippen, M., Kouveliotou, C., McBreen, S., Meegan, C. A., Paciesas, W., Preece, R., Rau, A., Tierney, D., van der Horst, A. J., & Wilson-Hodge, C. 2011, ApJ, 727, L33
- Jager et al. (1997) Jager, R., Mels, W. A., Brinkman, A. C., Galama, M. Y., Goulooze, H., Heise, J., Lowes, P., Muller, J. M., Naber, A., Rook, A., Schuurhof, R., Schuurmans, J. J., & Wiersma, G. 1997, A&AS, 125, 557
- Jaunsen et al. (2003) Jaunsen, A. O., Andersen, M. I., Hjorth, J., Fynbo, J. P. U., Holland, S. T., Thomsen, B., Gorosabel, J., Schaefer, B. E., Björnsson, G., Natarajan, P., & Tanvir, N. R. 2003, A&A, 402, 125
- Kalberla et al. (2005) Kalberla, P. M. W., Burton, W. B., Hartmann, D., Arnal, E. M., Bajaja, E., Morras, R., & Pöppel, W. G. L. 2005, A&A, 440, 775
- Kaneko et al. (2006) Kaneko, Y., Preece, R. D., Briggs, M. S., Paciesas, W. S., Meegan, C. A., & Band, D. L. 2006, ApJS, 166, 298
- Katz (1994) Katz, J. I. 1994, ApJ, 432, L107
- Kippen et al. (2004) Kippen, R. M., in’t Zand, J. J. M., Woods, P. M., Heise, J., Preece, R. D., & Briggs, M. S. 2004, in American Institute of Physics Conference Series, Vol. 727, Gamma-Ray Bursts: 30 Years of Discovery, ed. E. Fenimore & M. Galassi, 119–122
- Kippen et al. (2003) Kippen, R. M., Woods, P. M., Heise, J., in’t Zand, J. J. M., Briggs, M. S., & Preece, R. D. 2003, in American Institute of Physics Conference Series, Vol. 662, Gamma-Ray Burst and Afterglow Astronomy 2001: A Workshop Celebrating the First Year of the HETE Mission, ed. G. R. Ricker & R. K. Vanderspek, 244–247, arXiv:astro-ph/0203114
- Laming & Titarchuk (2004) Laming, J. M., & Titarchuk, L. 2004, ApJ, 615, L121
- Laurent & Titarchuk (2007) Laurent, P., & Titarchuk, L. 2007, ApJ, 656, 1056
- Lazzati et al. (2000) Lazzati, D., Ghisellini, G., Celotti, A., & Rees, M. J. 2000, ApJ, 529, L17
- Lazzati et al. (2009) Lazzati, D., Morsony, B. J., & Begelman, M. C. 2009, ApJ, 700, L47
- Liang et al. (1997) Liang, E., Kusunose, M., Smith, I. A., & Crider, A. 1997, ApJ, 479, L35+
- Lloyd & Petrosian (2000) Lloyd, N. M., & Petrosian, V. 2000, ApJ, 543, 722
- Lu et al. (2012) Lu, R.-J., Wei, J.-J., Liang, E.-W., Zhang, B.-B., Lü, H.-J., Lü, L.-Z., Lei, W.-H., & Zhang, B. 2012, ApJ, 756, 112
- Lyutikov (2009) Lyutikov, M. 2009, ArXiv e-prints, 0911.0349
- Lyutikov & Blandford (2003) Lyutikov, M., & Blandford, R. 2003, ArXiv Astrophysics e-prints: 0312.347, arXiv:astro-ph/0312347
- Mészáros & Rees (2000) Mészáros, P., & Rees, M. J. 2000, ApJ, 530, 292
- Panaitescu (2009) Panaitescu, A. 2009, MNRAS, 393, 1010
- Pe’er et al. (2012) Pe’er, A., Zhang, B.-B., Ryde, F., McGlynn, S., Zhang, B., Preece, R. D., & Kouveliotou, C. 2012, MNRAS, 420, 468
- Preece et al. (1998) Preece, R. D., Briggs, M. S., Mallozzi, R. S., Pendleton, G. N., Paciesas, W. S., & Band, D. L. 1998, ApJ, 506, L23
- Preece et al. (2000) —. 2000, ApJS, 126, 19
- Rees & Meszaros (1994) Rees, M. J., & Meszaros, P. 1994, ApJ, 430, L93
- Rees & Mészáros (2005) Rees, M. J., & Mészáros, P. 2005, ApJ, 628, 847
- Ryde (2004) Ryde, F. 2004, ApJ, 614, 827
- Ryde (2005) —. 2005, ApJ, 625, L95
- Ryde et al. (2010) Ryde, F., Axelsson, M., Zhang, B. B., McGlynn, S., Pe’er, A., Lundman, C., Larsson, S., Battelino, M., Zhang, B., Bissaldi, E., Bregeon, J., Briggs, M. S., Chiang, J., de Palma, F., Guiriec, S., Larsson, J., Longo, F., McBreen, S., Omodei, N., Petrosian, V., Preece, R., & van der Horst, A. J. 2010, ApJ, 709, L172
- Ryde & Pe’er (2009) Ryde, F., & Pe’er, A. 2009, ApJ, 702, 1211
- Sakamoto et al. (2005) Sakamoto, T., Lamb, D. Q., Kawai, N., Yoshida, A., Graziani, C., Fenimore, E. E., Donaghy, T. Q., Matsuoka, M., Suzuki, M., Ricker, G., Atteia, J.-L., Shirasaki, Y., Tamagawa, T., Torii, K., Galassi, M., Doty, J., Vanderspek, R., Crew, G. B., Villasenor, J., Butler, N., Prigozhin, G., Jernigan, J. G., Barraud, C., Boer, M., Dezalay, J.-P., Olive, J.-F., Hurley, K., Levine, A., Monnelly, G., Martel, F., Morgan, E., Woosley, S. E., Cline, T., Braga, J., Manchanda, R., Pizzichini, G., Takagishi, K., & Yamauchi, M. 2005, ApJ, 629, 311
- Shahmoradi & Nemiroff (2011) Shahmoradi, A., & Nemiroff, R. J. 2011, MNRAS, 411, 1843
- Sparre & Starling (2012) Sparre, M., & Starling, R. L. C. 2012, MNRAS, 427, 2965
- Starling et al. (2012) Starling, R. L. C., Page, K. L., Pe’Er, A., Beardmore, A. P., & Osborne, J. P. 2012, MNRAS, 427, 2950
- Stern & Poutanen (2004) Stern, B. E., & Poutanen, J. 2004, MNRAS, 352, L35
- Tavani (1996) Tavani, M. 1996, ApJ, 466, 768
- Thompson (2006) Thompson, C. 2006, ApJ, 651, 333
- Thompson et al. (2007) Thompson, C., Mészáros, P., & Rees, M. J. 2007, ApJ, 666, 1012
- Tierney et al. (2013) Tierney, D., McBreen, S., Preece, R. D., Fitzpatrick, G., Foley, S., Guiriec, S., Bissaldi, E., Briggs, M. S., Burgess, J. M., Connaughton, V., Goldstein, A., Greiner, J., Gruber, D., Kouveliotou, C., McGlynn, S., Paciesas, W. S., Pelassa, V., & von Kienlin, A. 2013, A&A, 550, A102
- Titarchuk et al. (2012) Titarchuk, L., Farinelli, R., Frontera, F., & Amati, L. 2012, ApJ, 752, 116
- Woosley (2011) Woosley, S. E. 2011, ArXiv e-prints, 1105.4193
- Yamazaki et al. (2003) Yamazaki, R., Yonetoku, D., & Nakamura, T. 2003, ApJ, 594, L79
- Yonetoku et al. (2004) Yonetoku, D., Murakami, T., Nakamura, T., Yamazaki, R., Inoue, A. K., & Ioka, K. 2004, ApJ, 609, 935
- Zhang (2011) Zhang, B. 2011, Comptes Rendus Physique, 12, 206
- Zhang & Mészáros (2002) Zhang, B., & Mészáros, P. 2002, ApJ, 581, 1236
- Zhang & Pe’er (2009) Zhang, B., & Pe’er, A. 2009, ApJ, 700, L65
- Zhang et al. (2011) Zhang, B.-B., Zhang, B., Liang, E.-W., Fan, Y.-Z., Wu, X.-F., Pe’er, A., Maxham, A., Gao, H., & Dong, Y.-M. 2011, ApJ, 730, 141
| GRB | Redshift | Fluence | No. of Intervals | No. of Useful Intervals |
|---|---|---|---|---|
| ( cgs) | ||||
| 970111 | – | 39.180.08 | 10 | 8 |
| 980329 | 3.5a | 8 | 6 | |
| 990123 | 1.60 | 26 | 19 | |
| 990510 | 1.619 | 15 | 8 |
Note. — For each GRB we report the redshift, the fluence in the 2-2000 keV energy band, the number of time intervals in which we subdivided the time profile and those used in the time-resolved spectral analysis. The uncertainty in the fluence is only statistical.
| GRB | Interval No. | F–test | F–test/add | |||
|---|---|---|---|---|---|---|
| bf | bfbb | (keV) | ||||
| 970111 | 7 | 29.3/13 | 11.8/11 | 0.11 | 0.0067 | |
| 970111 | 8 | 32.9/13 | 19.9/11 | 0.30 | 0.07 | |
| 980329 | 6 | 97.7/77 | 90.0/75 | 0.40 | 0.046 | |
| 990123 | 9 | 192/166 | 187/164 | 0.46 | 0.11 | |
| 990123 | 12 | 136.5/118 | 128/116 | 0.40 | 0.024 | |
| 990510 | 1 | 74/48 | 60.7/46 | 0.30 | 0.01 |
.
Note. — For each time interval of the GRB light curve, in which the bf does not provide a good fit of the corresponding spectrum, we report, in addition to the by using bf alone and bfbb, the fit improvement level () by using bfbb.
| BB PL model | GRBCOMP model | |||||||||||||
|---|---|---|---|---|---|---|---|---|---|---|---|---|---|---|
| GRB | Interval | Start (t) | N | |||||||||||
| (keV) | (keV) | (keV) | () | |||||||||||
| 970111 | 3 | 35045.0 (3) | 219.8/97 | [3] | 22.1 | 5.80 | 126.5/97 | |||||||
| 4 | 35048.0 (6) | 653.4/75 | 13.7 | 86.4 | 7.9 | 4.7 | 79.8/74 | |||||||
| 5 | 35054.0 (3) | 677.6/73 | 11.7 | 85 | 7.3 | 4.7 | 1.0 | 77.6/72 | ||||||
| 6 | 35057.0 (5) | 1030.7/73 | 9.6 | 6.5 | 5.5 | 2.2 | 75.7/72 | |||||||
| 7 | 35062.0 (3) | 374.8/13 | 10.8 | 57 | 6.7 | 4.4 | 1.1 | 18.6/12 | ||||||
| 8 | 35065.0 (4) | 163.0/13 | 8.5 | 37 | 8.3 | 4.3 | 2.1 | 16.7/12 | ||||||
| 9 | 35069.0 (4) | 129.3/12 | 3.2 | 22 | 14.2 | 3.3 | 34 | 12.7/11 | ||||||
| 10 | 35073.0 (13) | 163.8/13 | 3.1 | 21 | 14.3 | 2.9 | 18.3/12 | |||||||
| 980329 | 2 | 13477.0 (4) | 161.1/83 | 6.3 | 183 | 5.2 | 2.23 | 7.2 | 105.5/82 | |||||
| 3 | 13481.0 (2) | 403.3/90 | 12.0 | 190 | 5.1 | 2.50 | 2.2 | 102.5/89 | ||||||
| 4 | 13483.0 (3) | 584.5/97 | 11.1 | 201 | 4.5 | 2.57 | 4.9 | 105.0/96 | ||||||
| 5 | 13486.0 (4) | 977.3/105 | 11.9 | 202 | 4.17 | 2.31 | 3.6 | 130.3/104 | ||||||
| 6 | 13490.0 (4) | 213.4/77 | 6.4 | 196 | 3.2 | 2.34 | 11.0 | 91/76 | ||||||
| 7 | 13494.0 (19) | 73.8/47 | 4.4 | 242 | 2.55 | 2.8 | 10 | 53.8/46 | ||||||
| 990123 | 2 | 35221.9 (6) | 50.5/35 | [3] | 43 | 22 | 2.5 | 6.9 | 41.5/35 | |||||
| 3 | 35227.9 (6) | 44.2/44 | [3] | 49 | 28 | 2.2 | 12 | 29.2/44 | ||||||
| 4 | 35233.9 (2) | 75.8/57 | [3] | 63 | 23.5 | 1.9 | 905 | 61.5/57 | ||||||
| 5 | 35235.9 (2) | 119.6/105 | 1.7 | 148 | 9.9 | 2.0 | 228 | 105/104 | ||||||
| 6 | 35237.9 (2) | 181.5/151 | 4.5 | 173 | 8.3 | 1.7 | 31 | 153.4/150 | ||||||
| 7 | 35239.9 (2) | 275.6/182 | 5.2 | 207 | 7.8 | 1.78 | 31 | 189.0/181 | ||||||
| 8 | 35241.9 (2) | 294/183 | 6.2 | 214 | 7.8 | 1.74 | 21 | 177.7/182 | ||||||
| 9 | 35243.9 (2) | 236.4/166 | 1.8 | 134 | 11.6 | 1.81 | 450 | 195.6/165 | ||||||
| 10 | 35245.9 (2 | 196.0/140 | 1.5 | 154 | 8.9 | 2.6 | 505 | 145.8/139 | ||||||
| 11 | 35247.9 (2) | 124.5/104 | 2.7 | 89 | 11.3 | 2.5 | 72 | 95.9/103 | ||||||
| 12 | 35249.9 (2) | 147.8/118 | [3] | 145 | 10.0 | 2.8 | 469 | 126.6/118 | ||||||
| 13 | 35251.9 (2) | 273.0/188 | 1.8 | 136 | 12.9 | 1.95 | 459 | 209.8/187 | ||||||
| 14 | 35253.9 (2) | 238.3/180 | 1.6 | 176 | 8.8 | 2.0 | 756 | 201.4/179 | ||||||
| 15 | 35255.9 (2) | 239.6/182 | 3.3 | 148 | 9.3 | 2.03 | 83 | 170.1/181 | ||||||
| 16 | 35257.9 (2) | 188.3/125 | 2.6 | 120 | 9.7 | 2.1 | 151 | 147.0/124 | ||||||
| 17 | 35259.9 (5) | 272.7/170 | 1.8 | 118 | 7.4 | 2.2 | 346 | 171.6/169 | ||||||
| 18 | 35264.9 (5) | 220.0/147 | 1.6 | 74 | 8.5 | 1.96 | 641 | 163.9/146 | ||||||
| 19 | 35269.9 (5) | 185.9/147 | 2.2 | 146 | 5.3 | 2.5 | 211 | 135.8/146 | ||||||
| 20 | 35274.9 (5) | 157.0/134 | 0.172 | 111.9/133 | ||||||||||
| 990510 | 1 | 31745.9 (5) | 151.4/48 | 9.2 | 83 | 4.7 | 3.9 | 1.0 | 61.0/47 | |||||
| 2 | 31750.9 (5) | 179.6/53 | 5.7 | 79 | 5.3 | 4.2 | 6.3 | 46.6/52 | ||||||
| 7 | 31785.9 (5) | 267.4/81 | 5.5 | 123 | 5.5 | 2.5 | 12 | 93.0/80 | ||||||
| 8 | 31790.9 (3) | 313.6/80 | 5.2 | 102 | 6.1 | 2.8 | 15 | 91.1/79 | ||||||
| 9 | 31793.9 (4) | 165.6/62 | 3.3 | 105 | 5.1 | 3.3 | 36 | 72.5/61 | ||||||
| 11 | 31802.9 (4) | 105.1/16 | 3.5 | 50 | 6.6 | 3.0 | 37 | 15.2/15 | ||||||
| 12 | 31806.9 (10) | 48.8/34 | [1] | 71 | 5.0 | [3.4] | 973 | 40.8/36 | ||||||
| 13 | 31816.9 (5) | 30.2/14 | 2.1 | 23 | [9.3] | 2.20 | 109 | 12.7/13 | ||||||
Note. — The grbcomp parameters are given in the rest frame. In the case of GRB 970111, a redshift equal to 1 was assumed. In the case of , it was estimated from its dependence on and (see text). Uncertainties are 1 errors. In square parenthesis, parameters frozen in the fits.
| GRB | (keV) | (keV) | (dof) | |||
|---|---|---|---|---|---|---|
| 970111 | 0.76 | 0.028 | 39.9 | 10.8 (6) | ||
| 980329 | 0.21 | 225.7 | 0.33 (4) | |||
| 990123 | 0.88 | 85.6 | 0.72 (17) | |||
| 990510 | 0.93 | 44.2 | 0.91 (6) |
Note. — A power–law relation between the two parameters is assumed: . In addition to the best–fit parameters , , and the median value , the correlation coefficient , , and the best–fit reduced with dof are reported.
| GRB | (keV) | flux0 (cgs) | (dof) | |||
|---|---|---|---|---|---|---|
| 970111 | 0.95 | 2.5 (6) | ||||
| 980329 | 0.87 | 0.49 (4) | ||||
| 990123 | 0.82 | 1.3 (17) | ||||
| 990510 | 0.76 | 2.8 (6) |
Note. — A power–law relation between the two parameters is assumed: . In addition to the best–fit parameters , and the median value flux0, the correlation coefficient , and the best–fit reduced with dof are reported.
| GRB | (keV) | (dof) | ||||
|---|---|---|---|---|---|---|
| 970111 | 0.233 | 7.6 (6) | ||||
| 980329 | 0.11 | 0.197 | 0.44 (4) | |||
| 990123 | 0.110 | 0.90 (17) | ||||
| 990510 | 0.366 | 0.10 (6) |
Note. — A power–law relation between the two parameters is assumed: . In addition to the best–fit parameters , , and the median value , the correlation coefficient , , and the best–fit reduced with the corresponding dof are reported.
| GRB | (dof) | ||||
|---|---|---|---|---|---|
| 970111 | 0.71 | 2.8 (5) | |||
| 980329 | 0.71 | 0.34 (4) | |||
| 990123 | 0.46 | 0.86 (13) | |||
| 990510 | 0.38 | 2.8 (6) |
Note. — A power–law relation between the two parameters is assumed, i.e. . In addition to the best–fit parameters and , the correlation coefficient , , and the best–fit reduced with the corresponding dof are reported.
| GRB | (keV) | (cm) | (dof) | |||
|---|---|---|---|---|---|---|
| 970111 | -0.93 | 0.07 (5) | ||||
| 980329 | -0.82 | 0.10 (4) | ||||
| 990123 | -0.96 | 0.05 (13) | ||||
| 990510 | -0.95 | 0.04 (6) | ||||
| 980329990123990510 | 0.21 (29) |
Note. — A power–law relation between the two parameters is assumed, i.e. . In addition to the best–fit parameters , and the median value , the correlation coefficient , , and the best–fit reduced with the corresponding dof are reported.
| GRB | (dof) | |||||
|---|---|---|---|---|---|---|
| 970111 | 0.96 | 0.42 | 0.9 (6) | |||
| 980329 | 0.94 | 0.217 | 0.06 (4) | |||
| 990123 | 0.62 | 0.16 | 0.36 (17) | |||
| 990510 | 0.57 | 0.13 | 0.47 | 0.47 (6) |
Note. — A linear relation between the two parameters is assumed: . In addition to the best–fit parameters , and the median value , the correlation coefficient , , and the best–fit reduced with the corresponding dof are reported.
| Parameter | 980329 | 990123 | 990510 | 990123990510 |
|---|---|---|---|---|
| 0.82 | 0.76 | 0.87 | ||
| 1.068 | 1.068 | 1.068 | 1.068 | |
| 0.46 | 1.07 | 2.8 | 2.08 | |
| dof | 4 | 17 | 6 | 25 |
Note. — A power–law relation between the two parameters is assumed: . In addition to the best–fit parameters , and the median value , the correlation coefficient , , and the best-fit reduced with its dof are reported. The relatively high found for 990510, and for 990123 and 990510 by merging their data together, is due to an intrinsic spread of the data points around the best–fit power–law.