Spatially extended OH+ emission from the Orion Bar and Ridge. ††thanks: Herschel is an ESA space observatory with science instruments provided by European-led Principal Investigator consortia and with important participation from NASA
Abstract
Context. The reactive HnO+ ions (OH+, H2O+ and H3O+) are widespread in the interstellar medium and act as precursors to the H2O molecule. While HnO+ absorption is seen on many Galactic lines of sight, active galactic nuclei often show the lines in emission.
Aims. This paper shows the first example of a Galactic source of HnO+ line emission: the Orion Bar, a bright nearby photon-dominated region (PDR).
Methods. We present line profiles and maps of OH+ line emission toward the Orion Bar, and upper limits to H2O+ and H3O+ lines. We analyze these HIFI data with non-LTE radiative transfer and PDR chemical models, using newly calculated inelastic collision data for the e-OH+ system.
Results. Line emission is detected over 1′ (0.12 pc), tracing the Bar itself as well as a perpendicular feature identified as the Southern tip of the Orion Ridge, which borders the Orion Nebula on its Western side. The line width of 4 km s-1 suggests an origin of the OH+ emission close to the PDR surface, at a depth of 0.3–0.5 into the cloud where most hydrogen is in atomic form. Models with collisional and radiative excitation of OH+ require unrealistically high column densities to match the observed line intensity, indicating that the formation of OH+ in the Bar is rapid enough to influence its excitation. Our best-fit OH+ column density of 1.01014 cm-2 is similar to that in previous absorption line studies, while our limits on the ratios of OH+/H2O+ (40) and OH+/H3O+ (15) are somewhat higher than seen before.
Conclusions. The column density of OH+ is consistent with estimates from a thermo-chemical model for parameters applicable to the Orion Bar, given the current uncertainties in the local gas pressure and the spectral shape of the ionizing radiation field. The unusually high OH+/H2O+ and OH+/H3O+ ratios are probably due to the high UV radiation field and electron density in this object. Photodissociation and electron recombination are more effective destroyers of OH+ than the reaction with H2, which limits the production of H2O+. The appearance of the OH+ lines in emission is the result of the high density of electrons and H atoms in the Orion Bar, since for these species, inelastic collisions with OH+ are faster than reactive ones. In addition, chemical pumping, far-infrared pumping by local dust, and near-UV pumping by Trapezium starlight contribute to the OH+ excitation. Similar conditions may apply to extragalactic nuclei where HnO+ lines are seen in emission.
Key Words.:
ISM: molecules – astrochemistry1 Introduction
Although interstellar clouds have ionization fractions of only 10-4–10-8, ionic species are very useful to probe physical conditions in such clouds (Larsson et al. 2012). In diffuse clouds (), the main ion source is UV photoionization of carbon, while in dense clouds (), cosmic-ray ionization of hydrogen is the dominant ionization mechanism (Bergin & Tafalla 2007). Proton transfer reactions of interstellar H with abundant species such as CO and N2 lead to HCO+ and N2H+, which are widely observed in the interstellar medium. Such stable ionic species are useful as tracers of the interaction of interstellar gas with magnetic fields (Houde et al 2004, Schmid-Burgk et al 2004), whereas ions which react rapidly with H2 trace other parameters such as the gas density and the ionization rate.
At temperatures 250 K, the formation of interstellar H2O in the gas phase proceeds through a series of ion-molecule reactions. After charge transfer of H+ or H to O, repeated reactions of O+ with H2 produce OH+, H2O+, and finally H3O+, which upon dissociative recombination with a free electron produces H2O. The OH+ and H2O+ ions are well known from the spectra of comets where they appear as photodissociation products of H2O (Swings & Page 1950; Herzberg & Lew 1974). In the interstellar medium, H2O and H3O+ have been known for decades (Phillips et al. 1992), but observation of the intermediate products OH+ and H2O+ had to await the launch of ESA’s Herschel Space Observatory (Pilbratt et al. 2010). Strong absorption in rotational lines of interstellar OH+ and H2O+ is seen with Herschel on many lines of sight in our Galaxy (Gerin et al 2010, Ossenkopf et al 2010) and even some beyond (Weiß et al. 2010). In addition, electronic absorption lines of OH+ have been reported in sensitive near-UV spectra of several diffuse interstellar clouds (Krełowski et al. 2010).
The Herschel data, as well as the single OH+ line observed from the ground toward the Galactic Center source SgrB2 (Wyrowski et al. 2010), imply large column densities of OH+ and H2O+. The hydrogen in the absorbing clouds thus cannot be purely in atomic form, because no OH+ and H2O+ would be produced, nor in purely molecular form, because all OH+ and H2O+ would react into H3O+ and H2O. Using models of UV-irradiated interstellar clouds (PDRs), the observed abundances of OH+ and H2O+ can be used to infer the relative fractions of hydrogen in atomic and molecular forms (Neufeld et al. 2010), which itself traces the ionization rates of the clouds (Hollenbach et al. 2012).
While the interpretation of interstellar HnO+ absorption is reasonably well understood, lines of OH+ and H2O+ have also been observed in emission from the nuclei of several active galaxies, most famously Mrk 231 (Van der Werf et al. 2010). The large dipole moments and small reduced masses of the HnO+ ions imply high line frequencies and large radiative decay rates, so that collisional excitation of their rotational levels requires extremely high densities and line emission is not expected to be observable. Understanding this phenomenon benefits from finding a Galactic source of HnO+ line emission, which can be studied in more detail than extragalactic nuclei.
This paper presents the first observation of OH+ line emission toward a source within our Galaxy: the Orion Bar. Due to its brightness and nearly edge-on geometry, this PDR is well-suited to observe physical and chemical changes in the gas as a function of depth into the cloud, as the intensity of UV irradiation by the Trapezium stars decreases (e.g., Van der Wiel et al. 2009). The Orion Bar is also notable as the only known Galactic source of interstellar HF line emission (Van der Tak et al. 2012). In this case, the proximity of this region (420 pc: Menten et al 2007, Hirota et al 2007) allows us to resolve the HnO+ line emission both spatially and spectrally. We use non-LTE radiative transfer models and PDR thermo-chemical models to interpret our results.
2 Observations
| Molecule / Transition | Frequency | |||
| GHz | K | s-1 | ||
| OH+ | – =1/2–3/2 | 909.159 | 43.6 | 0.011 |
| OH+ | – =5/2–3/2a𝑎aa𝑎aBlend with the hyperfine component. The frequency and are averages, while the is the sum. | 971.804 | 46.7 | 0.033 |
| OH+ | – =3/2–3/2 | 1033.119 | 49.6 | 0.018 |
| p-H2O+ | – | 607.227 | 59.2 | 0.006 |
| o-H2O+ | – | 1115.186 | 53.6 | 0.027 |
| H3O+ | – | 984.709 | 54.7 | 0.023 |
| H3O+ | – | 1655.831 | 79.5 | 0.055 |
The CO+ peak (, ) in the Orion Bar (Störzer et al. 1995) has been observed as a spectral scan over the full HIFI range as part of the HEXOS (Herschel observations of EXtra-Ordinary Sources) guaranteed-time key program (Bergin et al. 2010) using the HIFI instrument (De Graauw et al. 2010) of the Herschel Space Observatory (Pilbratt et al. 2010). This paper uses data from HIFI bands 1b (H2O+ –), 3b (OH+ –), 4a (OH+ – and –), 5a (H2O+ –), and 6b (H3O+ –). These observations were carried out in 2011 March and April in load chop mode with a redundancy of 4, except that frequency switching was used in band 5. On-source integration times are 50 s for most spectra except OH+ – (20 s) and H2O+ – (190 s). The ObsIDs of the spectra, without the leading 1342, are 215923 for Band 1b, 216380 for Band 3b, 218628 for Band 4a, 194666 for Band 5a and 218426 for Band 6b.
Table 1 lists the frequencies of the lines as well as other spectroscopic parameters, which have been taken from the CDMS database (Müller et al. 2001)222http://www.astro.uni-koeln.de/cdms/. The size of the telescope beam for these observations is 19–23′′ FWHM, corresponding to 9000 AU or 0.04 pc, except for the H2O+ – line where it is 35′′, and for the H3O+ – line where it is 15′′. The WBS (Wide-Band Spectrometer) was used as backend, covering 4 GHz bandwidth in four 1140 MHz subbands at 1.1 MHz resolution. The velocity calibration of HIFI data is accurate to 0.5 kms-1 or better. The data were reduced with HIPE (Ott 2010) pipeline version 6.0, using the task doDeconvolution for the sideband deconvolution, while further analysis was done in the CLASS package.
In addition to the HIFI spectral scans, a area centered on = 05:35:20.81, = –05:25:17.1 with a position angle of 145∘ was mapped in the OH+ transition with HIFI, in On-The-Fly (OTF) mapping mode with position-switch reference, using a total integration time of 20 min. The noise level of the map is 0.22 K per 0.7 km s-1 channel and its ObsID is 218216. The fully sampled map was reduced with HIPE 6.0 and exported to CLASS for further analysis. We compare these data to a map of the same area in the CO 10-9 line at = 1151.985 GHz ( = 304 K), also observed within the HEXOS program under ObsID 217736, with a noise level of 0.56 K per 1.0 km s-1 channel.
3 Results
| Line | V | V | rms | |
|---|---|---|---|---|
| K km s-1 | km s-1 | km s-1 | mK | |
| OH+ – | 0.80 | … | … | 58 |
| OH+ – | 2.3(3) | 10.9(3) | 5.1(6) | 133 |
| OH+ – | 1.2(1) | 10.1(3) | 4.3(5) | 88 |
| H2O+ – | 0.18 | … | … | 20 |
| H2O+ – | 1.90 | … | … | 112 |
| H3O+ – | 1.17 | … | … | 78 |
| H3O+ – | 2.27 | … | … | 90 |
3.1 Line profiles
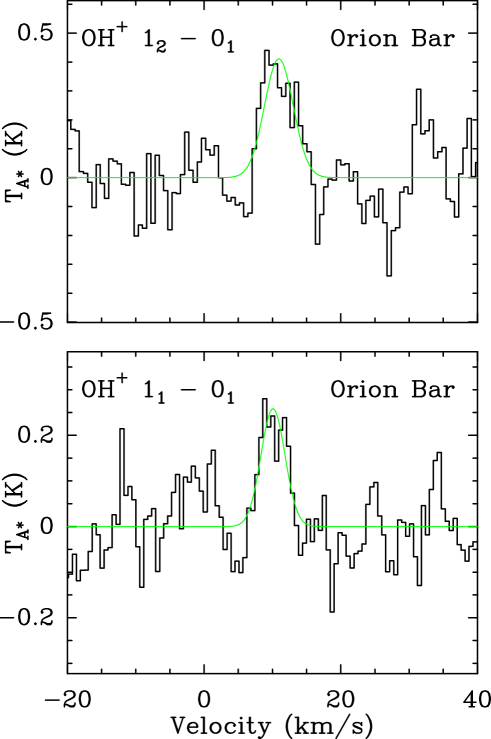
Figure 1 presents the line profiles of the OH+ lines at 971 and 1033 GHz, as observed with HIFI toward the Orion Bar. Although hints of OH+ and H2O+ emission have been seen toward the high-mass protostar W3 IRS5 (Benz et al. 2010), this is the first time that a pure emission profile is seen toward a Galactic source. As the line profiles appear single-peaked at our sensitivity and spectral resolution, we have fitted a Gaussian model to extract the line parameters. Table 2 presents the results of these Gaussian fits, and also reports our upper limits to other lines of OH+, H2O+ and H3O+ from our spectral survey of the Orion Bar. We have also searched for the O+ excited fine structure (2D = 5/2 3/2) line near 593.7 GHz (Blagrave & Martin 2004; Sharpee et al. 2004), leading to an upper limit on of 30 mK rms per 0.5 km s-1 channel. No continuum emission is detected in the spectra, down to upper limits ranging from = 0.1 K at 607 GHz to 0.3 K at 1655 GHz, which is consistent with the SPIRE measurements of Arab et al. (2012).
The difference between the measured central velocities and FWHM widths of the two detected OH+ lines is mostly due to hyperfine blending of the – line. We thus adopt the measured parameters of the – line as the best estimate of the central velocity and FWHM width of the OH+ emitting gas in the Orion Bar. While the central velocity of this line of 10.1 km s-1 is in good agreement with the value of 10.00.2 km s-1 from ground-based observations of other molecular species toward this source, its width of 4.3 km s-1 is much larger than the value of 1.70.3 km s-1 measured for the dense gas deep inside () the Bar (Hogerheijde et al 1995, Leurini et al 2006). On the other hand, its width is smaller than the value of 5 km s-1 measured in species such as HF which trace the surface () of the PDR (Van der Tak et al. 2012), and more similar to the width of the [C II] line (Ossenkopf et al. 2013). Based on the line width, the OH+ emission thus seems to originate from close to the PDR surface () where CH+ and SH+ peak as well in the chemical model of Nagy et al. (2013). In contrast, the non-hydride reactive molecular ions CO+, SO+ and HOC+ have smaller line widths (2–3 km s-1, Fuente et al. 2003). These species have a different formation channel and thus a different sensitivity to the abundances of atomic H and electrons.
3.2 Spatial distribution
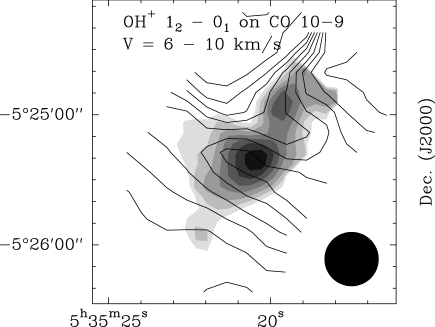
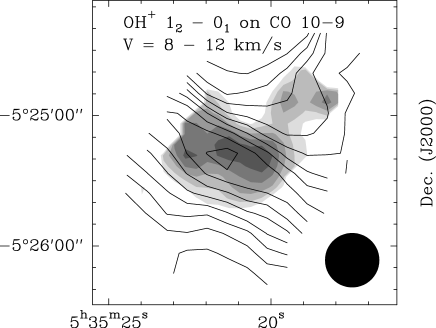
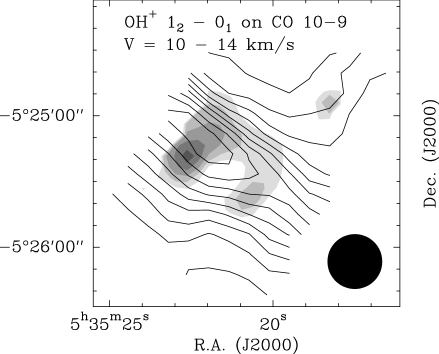
Figure 2 presents our maps of the OH+ 971 GHz line emission, as observed with HIFI toward the Orion Bar, integrated over three velocity ranges, shown in greyscale. The contours show the CO 10–9 line emission, integrated over the same velocity ranges. The OH+ emission around the central velocity (middle panel) is seen to be extended over at least an arc minute (25,000 AU or 0.12 pc) on the sky, and to roughly follow the structure of the Bar seen in CO 10–9 and other molecular tracers (e.g., Van der Wiel et al. 2009). The emission from the Bar is concentrated in two clumps: one peaking near the map center at 10 km s-1, and another peaking 20–25′′ to the East near = 12 km s-1, which is seen most pronounced in the figure’s bottom panel. This second peak lies 10′′ South-East of the CO 10–9 peak at the same velocity, which coincides with H13CN clumps 2 and 3 from Lis & Schilke (2003). Since OH+ is not expected deeper into the PDR than CO and HCN, we suggest that the location of the second OH+ clump marks a deviation from pure plane-parallel geometry.
The map of low-velocity OH+ in the top panel of Figure 2 shows a third clump which lies to the North-West of the Bar, and is connected to it by a bridge of fainter OH+ emission. This ‘perpendicular’ emission is also seen in CO 10–9 and other tracers of the Bar surface such as OH 119 m (Goicoechea et al. 2011), [CII] 158 m (Ossenkopf et al. 2013), and CH+ 3–2 (Nagy et al. 2013). The feature corresponds to the Southern tip of the Orion Ridge facing the Trapezium cluster, which confines the HII region, as visible in large-scale maps of CN line emission (Rodríguez-Franco et al. 1998) and 13CO 3–2 emission (Lis & Schilke 2003; Melnick et al 2012). From multi-line CN observations, Rodríguez-Franco et al. (2001) derive H2 densities as high as 106 cm-3 for this ridge, which may be favourable to excite OH+ line emission. However, this density is probably an overestimate, as collisions of CN with electrons were not taken into account, which are known to be important for CN (Black & van Dishoeck 1991; Harrison et al. 2013). Furthermore, we note that the OH+ line is not detected toward the Orion S clump further up the Orion Ridge, possibly because emission and absorption from different layers cancel out each other.
| (K) | OH+ | H2O+ | H3O+ |
|---|---|---|---|
| 10 | 82.1 | 2.85 | 7.21 |
| 20 | 8.61 | 0.21 | 0.64 |
| 40 | 4.01 | 0.10 | 0.27 |
| 80 | 3.90 | 0.13 | 0.32 |
| 160 | 5.45 | 0.25 | 0.64 |
3.3 Column densities
The variations in OH+ emission level by factors of 2–3 across the maps in Figure 2 likely correspond to variations in the total column density or the OH+ abundance with position, although excitation conditions (volume density, kinetic temperature) may also play a role. Since the emission does not appear to be strongly peaked, We focus in the following analysis on the CO+ peak where we have limits on the other HnO+ ions. To estimate the column densities of these ions, we use the line fluxes from Table 2 and apply a main beam efficiency of 76% at 607 GHz, 70% at 1655 GHz, and 74% at our other line frequencies (Roelfsema et al. 2012). The column density depends on the excitation temperature through
where is the line frequency, is the partition function, is the upper state degeneracy, and is the spontaneous decay rate. This equation assumes optically thin emission and negligible background radiation (), but does not assume the Rayleigh-Jeans limit () because our measurements are at high frequency. The optically thin assumption is reasonable given the low expected abundances of the HnO+ ions, and neglecting background radiation is justified given the low level of continuum radiation in our observations. Adopting a background brightness temperature of 9 K increases the column density estimates by 5% for = 20 K, and by 1% for higher values of .
To evaluate the above expression for the column density, we use the spectroscopic parameters of the lines in Table 1. Table 3 presents estimates of the column densities of OH+, H2O+ and H3O+ for values of between 10 and 160 K, which is the expected range for the Orion Bar. If the excitation of HnO+ is close to LTE, would be close to the kinetic temperature of the gas, which ranges from 85 K for the dense gas (Hogerheijde et al. 1995) to 150 K near the cloud surface (Batrla & Wilson 2003; Goicoechea et al. 2011). If collisional excitation of the lines cannot compete with their radiative decay, will drop below , while may exceed if radiative or chemical pumping plays a role. Section 5 discusses these processes in more detail. For now, the table shows that the derived column densities of HnO+ vary by factors of 2–3 for 20 K, but that the estimate increases by an order of magnitude if is as low as 10 K.
The OH+ column density in Table 3 for = 10 K is comparable to the values toward other Galactic sources, while the estimates for 20 K are 10 lower. Absorption line studies indicate (OH+) values between a few 1013 and a few 1014 cm-2, both for the diffuse foreground clouds toward G10.6, W49N, W51 and OMC-2 (Gerin et al. 2010; Neufeld et al. 2010; Indriolo et al. 2012; López-Sepulcre et al. 2013) and the dense gas around the protostars AFGL 2591, W3 IRS5, and Orion-KL (Bruderer et al. 2010; Benz et al. 2010; Gupta et al. 2010). Our OH+/H2O+ ratio of 40 and OH+/H3O+ ratio of 15 are larger than in previous observations of diffuse clouds, suggesting an origin of the observed emission in very diffuse low-extinction layers of the PDR.
4 PDR models
| Reaction | (cm3 s-1) | (K) |
| 10–41000 | ||
| 10–41000 | ||
| 10–41000 | ||
| 10–41000 | ||
| – a𝑎aa𝑎aRate from the OSU database (version March 2008). | ||
| 10–1000 | ||
| 10–1000 | ||
| Reaction | (s-1) | (K) |
| 10–41000 | ||
| – b𝑏bb𝑏bAssumed value. | ||
| 10–41000 |
To understand the chemistry of HnO+ in more detail, we model the Orion Bar with version 1.4.4 of the Meudon PDR model (Le Petit et al. 2006; Goicoechea & Le Bourlot 2007; González-García et al. 2008). We describe the object with an isobaric model, where the pressure is kept constant and the program solves for the thermal and chemical balance as a function of depth. Isobaric models are the simplest description of gas in steady-state, stationary molecular clouds where gravitation is negligible. The model includes a gas-phase chemical network based on the UMIST database, as well as H2 formation on grains and neutralization of ions on grains and PAHs.
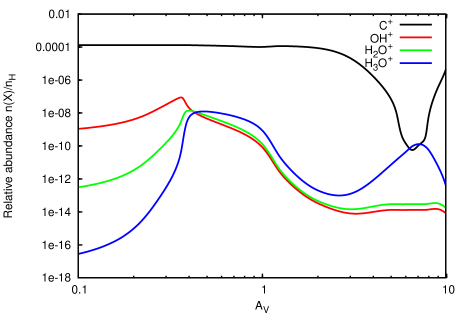
Figure 3 shows the predicted abundances of OH+, H2O+ and H3O+ as a function of visual extinction, for a radiation field of =10,000 Draine (1978) units ( = 2.710-3 erg s-1 cm-2), a cosmic-ray ionization rate of 210-16 s-1, and a pressure of =108 K cm-3. The radiation field is taken from Goicoechea et al. (2011) and the pressure is chosen to match the intensities of the CH+ = 1–0 to 6–5 transitions observed toward the Orion Bar CO+ peak with Herschel HIFI and PACS (Nagy et al. 2013). For these parameters, the total gas density at the depth where the HnO+ abundances peak () is in the range between and cm-3. The temperatures at these depths in the model (Table 5) agree well with estimates for the PDR surface from lines of H2 (400–700 K, Allers et al. 2005) and H (550 K, Van der Werf et al. 2013). The column densities of our observed species, integrated up to =1 mag, are (OH+) = 1.61013 cm-2, (H2O+) = 4.41012 cm-2, and (H3O+) = 7.51012 cm-2. When integrating up to =10 mag, the values for OH+ and H2O+ remain the same to 1%, and (H3O+) increases by just 6% which is insignificant. These predictions are consistent with the estimates in Table 3 for = 10–20 K, except that the observed OH+/H2O+ ratio is larger than in the models. Note that the predictions correspond to a face-on model; to compare to the observations, they must be multiplied by a factor of 1/sin 4, where for the Orion Bar (Nagy et al. 2013).
As shown in Figure 3, HnO+ abundances in the high UV illumination Orion Bar PDR peak near the cloud surface, at depths of , and decrease rapidly beyond . Given the clumpy structure of the Orion Bar, this narrow range in is spatially rather extended, as indicated by the maps in Fig. 2. To understand the chemistry of HnO+ in the Orion Bar, we study the main formation and destruction channels of these ions at depths of = 0.3, 0.4 and 1.0 mag. The corresponding reaction coefficients and rates are listed in Tables 4 and 5. At a depth of = 0.3 – 0.4, the dominant pathways for OH+ formation are:
| (1) |
| (2) |
| (3) |
The dominant OH+ formation path is via H2 and O+, which accounts for 70% of the total OH+ production at and 85% at . Photoionization of OH accounts for 18% of OH+ formed at and 12% at . Charge exchange between OH and H+ is mostly significant at , resulting in 12% of OH+ production which decreases to 3% at . This reaction is more important in X-ray dominated regions (XDRs), which is a key difference between such regions and high-illumination PDRs (Van der Werf et al. 2010). At a depth of , the path via H2 and O+ is still the dominant OH+ formation path (72.1%). However, the role of OH photoionization increases, as it accounts for producing 27% of OH+ at this depth.
Once OH+ is formed, H2O+ and H3O+ formation rapidly follows via similar reactions with H2:
| (4) |
| (5) |
At a depth of , 100% of H2O+ forms from OH+ in the reaction with H2. At a depth of , as the H3O+ abundance is increased compared to that at = 0.3, a secondary reaction apart from the reaction from H2 (83%) produces 17% of the H2O+ formed at this depth:
| (6) |
At a depth of = 1.0, the role of H2O+ production from H3O+ decreases to 9%, compared to the dominant reaction from H2 (88%). At each of these depths in the model,100% of H3O+ is produced in the reaction of H2O+ with H2.
The destruction of OH+ is mainly via reactions with electrons, photons and H2. The reaction with H2 (Eqn. 4) is the most important H2O+ formation path, as mentioned above. It is also the most important destruction path for OH+ at depths of = 0.4 and beyond. At smaller depths, both dissociative recombination with electrons and UV photodissociation contribute significantly to the OH+ destruction: at ,
| (7) |
contributes 52%, and
| (8) |
contributes 18%. Destruction of H2O+ occurs mainly via dissociative recombination with electrons at low depths ( = 0.3 – 0.4):
| (9) |
| (10) |
Reaction 9 accounts for 71% of H2O+ destruction at = 0.3, while reaction 10 contributes 20%. At a depth of = 0.4, reactions 9 and 10 contribute 44 and 12% (respectively) to the H2O+ destruction. As H2O+ does not have photodissociation channels longward of 13.6 eV, the model does not include this process (Hollenbach et al. 2012). Destruction by H2, which controls H3O+ production is only significant at (87%). Therefore, the high electron density and UV radiation field in the Orion Bar may explain the H2O+ and H3O+ non-detections, as a significant fraction of OH+ and H2O+ is directly destroyed by UV photons or by recombination with electrons, limiting the H2O+ and H3O+ formation. Our non-detections of H2O+ and H3O+ are thus consistent with an origin of the OH+ emission in diffuse gas where C+ is abundant.
Alternatively, our observed H2O+/OH+ ratio may be due to a low molecular fraction (H2/H ratio) in the gas probed by our observations. Gerin et al. (2010) derive an analytic expression for the OH+/H2O+ abundance ratio as a function of the gas temperature, electron density, and H2 volume density:
As most OH+ forms in the outermost layers of the PDR () at very low molecular fractions (0.01%-0.4% for and , respectively), this formula is consistent with the observed abundance ratio of (OH+)/(H2O+)2. This suggests that, apart from the effect of the high electron density mentioned above, the low molecular fraction in the surface of the PDR also contributes to the observed OH+/H2O+ column density ratios. We conclude that most of our observed OH+ emission originates at extinctions below .
Fig. 3 shows a second peak in the H3O+ abundance at a depth of . This second peak is expected in the abundance of HnO+ in interstellar clouds with a large range of physical conditions (e.g., Hollenbach et al. 2012) and does not significantly contribute to the total H3O+ column density. The sequence of HnO+ formation at this depth is initiated by the cosmic-ray ionization of H2, followed by a reaction of H with H2 producing H. At this depth, OH+ is formed from H, whose abundance is increased due to the lower electron abundance. The second abundance peak disappears toward higher as oxygen freezes out on the grain surfaces as water.
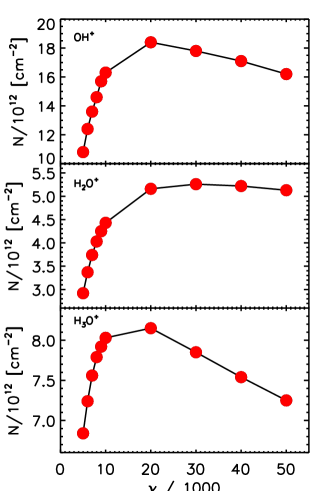
Fig. 4 shows the effect of changing the radiation field on the HnO+ column densities. The model corresponds to =108 cm-3 K and the figure considers radiation fields between =5000 and 50000 Draine units. The predicted column densities of the HnO+ species are seen to peak for =20,000–30,000 and to drop for higher radiation fields. The HnO+ column densities in our model are similar to those by Hollenbach et al. (2012) under Orion Bar conditions (their Figs. 8 and 9).
5 Excitation of OH+
| 0.3 | 0.4 | 1.0 | |
| 1783 K | 1013 K | 569 K | |
| 5.6104 cm-3 | 9.9104 cm-3 | 1.8105 cm-3 | |
| (H2) | 1.9101 cm-3 | 3.9103 cm-3 | 1.0105 cm-3 |
| Reaction | Rate | ||
Our estimated column densities of OH+, H2O+ and H3O+ are in reasonable agreement with the predictions from the Meudon PDR model, but the appearance of the lines in emission is unlike other Galactic sources observed in OH+ so far. To understand this behaviour we perform a non-LTE analysis of the excitation of OH+, which takes both reactive and inelastic collisions into account, as well as excitation by the background continuum radiation field.
5.1 Collisional and radiative excitation
The calculations in Appendix A indicate inelastic electron collision rates for the OH+ 971 GHz line of 610-7 cm3 s-1, which is 10 higher than the dissociative recombination rate at 100 K (Table 4). At this temperature, for this transition, so that by detailed balance, the upward and downward rates differ by only a few percent. For collisions with H2, inelastic collision rates are not known, but it may be reasonable to assume that reactive collisions dominate. In contrast, the reaction of OH+ with H is endothermic, and inelastic collisions with H could influence the excitation of OH+. Test calculations assuming a collisional rate coefficient of cm3 s-1 (cf. Andersson et al 2008 for the case of CO+) for all radiatively allowed transitions indicate that this effect is comparable with electron collisions. Very recent calculations on the OH+-He system confirm this estimate, at least to order of magnitude (F. Lique, priv. comm.). We therefore first calculate the excitation of OH+ assuming that inelastic collisions with H and electrons dominate, and consider the effect of reactive collisions with H2 in §5.2.
We have used the non-LTE radiative transfer program Radex (Van der Tak et al. 2007) to calculate the excitation of OH+ in the Orion Bar, assuming steady-state conditions and using the inelastic collision rates from Appendix A. Observations of C recombination lines toward the Orion Bar surface indicate hydrogen densities of 5104–2.5105 cm-3 (Wyrowski et al. 1997), which for all carbon in C+ and C/H = 1.410-4 translates into an electron density of (e) 10 cm-3, as we have used before for HF (Van der Tak et al. 2012). We use an electron temperature of = 300 K, but our results are insensitive to variations in between 100 and 1000 K. The adopted line width is the observed 4.3 km s-1 and for the background radiation field we adopt a modified blackbody distribution with a dust temperature of =50 K and a dust emissivity index of =1.6, as found by Arab et al. (2012) for the interior of the Bar, so that =0.21 at 971 GHz. The model is insensitive to the details of this radiation field; in particular, the results are unchanged when adopting =70 K and =1.2 as found by Arab et al for the Bar’s surface.
The model predicts an excitation temperature of 10 K for the OH+ lines near 1 THz. The excitation is due to the combination of collisions and radiation: a model with the modified blackbody replaced by the 2.73 K cosmic microwave background results in 7 K. The effect on the emerging line intensities is large, since the Planck function at 1 THz increases by a factor of 4 from = 7 K to 9 K.
The calculated excitation temperature of 10 K is above the background radiation temperature of 9.2 K, which explains the appearance of the line in emission, but the models require (OH+) 51014 cm-2 to match our observed 971 GHz line intensity. At this high column density, the OH+ lines become optically thick which drives the three =1–0 lines to approximately the same peak brightness, inconsistent with our non-detection of the line of OH+. We therefore regard this model as untenable, conclude that the observed line emission is optically thin, and search for a model with a higher excitation temperature in the next section.
5.2 Effect of reactive collisions
The above calculation indicates that inelastic collisions are sufficient to make the OH+ line appear in emission given the low background intensity of the Orion Bar. A fully self-consistent model should however include formation and destruction terms in the rate equations. We use Equation 12 from Van der Tak et al. (2007), where the number density of OH+ molecules (in cm-3) is the ratio of its formation rate (in cm-3 s-1) and its destruction rate (in s-1). We adopt a destruction rate of OH+ in the Orion Bar of 10-4 s-1, which is due to reactions with H2, electron recombination, and photodissociation. In contrast, the formation of OH+ through ion-molecule reactions should proceed at a rate at or below the Langevin rate of 10-9 cm3 s-1 and is limited by the supply of hydrogen or oxygen ions.
Lacking state-to-state formation rates, we approximate the distribution of the newly-formed OH+ over its energy levels by a thermal distribution at a temperature . The value of depends on the dominant formation route and is likely to be a significant fraction of its excess energy. The reactions of O+ with H2 and of O with H have exothermicities of 0.55 and 0.66 eV (Federer et al. 1984; Milligan & McEwan 2000), so should be in the range 2000–3000 K.
For OH+ formation rates between 10-12 and 10-9 cm3 s-1 and formation temperatures of 2000–3000 K, the model predicts excitation temperatures of 12 K for the OH+ lines near 1 THz. Compared to models with a negligible formation rate, the line brightness increases by a factor of 5, almost independent of , for the same column density. The observed intensities of the and lines are matched for (OH+) 11014 cm-2, which is considerably lower than for the steady-state excitation model. The difference with the estimates in Table 3 is the presence of background radiation. This model predicts some emission in the line, but only at the 2 level of our observations. We conclude that formation pumping plays an important role for OH+ in the Orion Bar.
6 Discussion
6.1 Effect of X-ray ionization
Our derived OH+ column density of 11014 cm-2 is similar to that in diffuse clouds, as observed in absorption toward W49N and other sources (see references in §3.3), but 1.6 higher than the model prediction of 6.41013 cm-2 in §4. The calculations in §4 assume a cosmic-ray ionization rate of 210-16 s-1, which is a typical value for diffuse interstellar clouds in the Solar neighbourhood (Indriolo & McCall 2012) and an order of magnitude higher than the value for dense clouds (Van der Tak & van Dishoeck 2000). However, the actual ionization rate of the Orion Bar may be atypically high because of its proximity to the Trapezium stars. The effects of X-rays from these stars on the chemistry are similar to those of cosmic rays (Meijerink et al. 2006). In particular, Gupta et al. (2010) estimate an ionization rate of 310-15 s-1 for the Orion KL region, dominated by X-rays from the star C Ori. Calculations using the Meudon code with an ionization rate of 210-15 s-1 result in very similar HnO+ column densities as before, though, presumably because of the high gas density in the Orion Bar.
6.2 Possible ion sources
Alternatively, the discrepancy between our observed and modeled column densities of OH+ may arise because the assumption of a stationary medium is inappropriate. Regarding the Orion Bar as a molecular cloud under external illumination and heating, the main source of OH+ may be the reaction of H with O, where the H is due to cosmic-ray ionization as well as leakage of UV photons from the ionized region. However, interaction of the PDR with the neighbouring photoionized nebula may supply O+ ions which produce extra OH+ in their reaction with H2. The supply of O+ ions may be due to leakage of hydrogen- and oxygen-ionizing photons, but also to advection of H+ and O+ ions from the ionized nebula into the mostly neutral PDR, as in some planetary nebulae (Black 1983)666Very recently, OH+ emission has been detected towards the Helix nebula (Van Hoof et al, in prep).. The concentration of H+ with depth into the PDR is then important, because charge transfer reactions (H+ + O O+ + H) will rapidly couple the O+/O ratio to the H+/H ratio. Observations of the [OIII] 88 m line toward the Orion Bar with Herschel/PACS show that ionized oxygen is widespread in the region (C. Joblin & J. Goicoechea, priv. comm.); the emission extends well into the mostly-neutral gas traced by the [OI] 63 m line (M. Gerin, priv. comm.), making the O+ + H2 channel a likely source of OH+ at low depths. Detailed comparison of the optical and near-IR (forbidden and/or permitted) lines of O and O+ would be a stronger test of this scenario (Walmsley et al. 2000; Mesa-Delgado et al. 2011). In addition, simulations of the full molecular + atomic + ionized gas in the Orion PDR with the Cloudy program (Ferland et al. 2013) would be useful to constrain the role of possible ion sources in the Orion Bar.
6.3 Radiative pumping
Besides changing the chemistry of OH+, the strong infrared and ultraviolet radiation fields in the Orion Bar may change its excitation. Section 5.1 already showed that far-infrared continuum radiation raises the OH+ excitation temperature significantly above the level due to inelastic collisions alone. In addition, mid-infrared pumping through the =1–0 band at 3.38 m may contribute if the radiative excitation rate of OH+ in the Bar exceeds the collisional excitation rate by electrons, which is (e) = 10 cm-3 610-7 cm3 s-1 = 610-6 s-1. The radiative rate is , the Einstein absorption coefficient times the radiative energy density, which is approximately , where is the dust emissivity, the dust filling factor, the spontaneous decay rate of 265 s-1, and the dust temperature. For the Orion Bar, the filling factor should be close to unity, and for the emissivity we assume 1 at the short wavelength of the fundamental vibrational band of OH+. Equating the radiative rate to the electron collision rate indicates a minimum temperature of 240 K, which is reasonable for the gas at the Bar’s surface, but too much for the dust, as the PACS and SPIRE data show (Arab et al. 2012). Only PAHs and small grains would reach such high temperatures, but with very low opacities, even though the OH+ vibrational fundamental is close to the PAH 3.3 m and aliphatic 3.4 m emission features.
Besides continuum radiation from dust in the Bar itself, pumping by infrared starlight from the Trapezium may influence the excitation of OH+. The brightest of these stars is C Ori, which is 127′′ away from our observing position (Van Leeuwen 2007). If both objects lie at the same distance from the Sun, the stellar continuum flux at the Orion Bar is 2.96 million times stronger than at the Earth. The stellar temperature of 37,000 K implies a radiative intensity of 0.2 Jy/nsr or 210-15 erg s-1 cm-2 Hz-1 sr-1. Setting this equal to the Planck function at a radiation temperature , we obtain K at = 3.38 m. The corresponding pumping rate in the OH+ vibrational fundamental is of order = 5.710-8 s-1, which is much less than the collisional excitation rate by electrons.
While infrared pumping does not seem play a role for OH+ in the Orion Bar, the absorption rate through electronic transitions in the near ultraviolet is rather higher. The radiative intensity of C Ori at the wavelength of the A – X =0–0 band of OH+ at 27949 cm-1 (3577 Å) is 1.8 Jy/nsr. The A-value for this band is 8.01105 s-1 (de Almeida & Singh 1981), so that the absorption rate in this band alone is 3.310-6 s-1, which is only slightly less than the collisional excitation rate.
6.4 Comparison with extragalactic systems
The Orion Bar is the first and so far only position within our Galaxy where lines of OH+ appear purely in emission, although a mix of emission and absorption is seen in W3 IRS5 (Benz et al. 2010) and NGC 3603 (Makai et al, in prep.) and possibly many more star-forming regions. Detections of extragalactic OH+ and H2O+ emission have been made with Herschel-SPIRE by Van der Werf et al. (2010) toward the active nucleus of the galaxy Mrk 231, with Herschel-PACS toward the ultraluminous merger Arp 220 by Rangwala et al. (2011) and with Herschel-SPIRE toward the Seyfert nucleus NGC 1068 by Spinoglio et al. (2012). In addition, detections of extragalactic HnO+ absorption exist toward M 82 using HIFI (Weiß et al. 2010) and SPIRE (Kamenetzky et al. 2012). Recently, PACS observations of excited OH+, H2O+ and H3O+ toward NGC 4418 and Arp 220 have been discussed by González-Alfonso et al. (2013). We suspect that the nuclei where HnO+ lines appear in emission have an enhanced electron density, far-infrared continuum, and/or ionizing (UV/X-ray) continuum. The Orion Bar is special in our Galaxy for its large column density of warm, mostly-atomic gas and its weak far-infrared continuum; we suspect that extragalactic nuclei where HnO+ lines appear in emission have similar conditions. In addition, supernova remnants may contribute, as the recent detection of OH+ emission towards the Crab nebula suggests (Barlow et al, in prep.).
7 Conclusions
We have presented maps and spectra of OH+ line emission toward the Orion Bar, and limits on lines of H2O+ and H3O+. The OH+ line emission is extended over 1′ (=25,000 AU = 0.12 pc) and traces the Bar itself as well as the Southern tip of the Orion Ridge. Analysis of the chemistry and the excitation of OH+ suggests an origin of the emission at a depth of =0.3–0.5, similar to CH+ and SH+. The OH+ column density of 1.01014 cm-2, derived using a non-LTE model including both inelastic and reactive collisions and radiative pumping, is similar to that in previous absorption line studies, while our limits on the OH+/H2O+ and OH+/H3O+ ratios are higher than seen before.
Non-LTE models of the excitation of OH+ show that the unusual appearance of the OH+ lines in emission is the combined result of inelastic electron collisions, far-infrared radiative pumping by dust, and chemical pumping through the O+ + H2 and O + H channels. The same conditions may apply to extragalactic sources of HnO+ line emission. In the future, high-resolution maps of Galactic and extragalactic OH+ line emission with ALMA will shed further light on the chemistry of this reactive ionic species.
Our observed HnO+ column densities are qualitatively reproduced by a model of the Orion Bar (using the Meudon PDR code) using a radiation field of =104 and a pressure of =108 K cm-3 as suggested by previous observations. Analysis of the main formation and destruction paths of the ions indicates that our high OH+/H2O+ and OH+/H3O+ ratios are due to the high UV radiation field and electron density in the Orion Bar. Destruction of OH+ and H2O+ by photodissociation and electron recombination limits the formation of H2O+ and H3O+. In addition, the low molecular fraction at the PDR surface limits the production of H2O+ and H3O+.
Quantitatively, the Meudon PDR models underpredict the absolute OH+ column density by a factor of 1.6. To match the observed line intensity with an OH+ column density similar to that in the PDR model, the electron density would have to be 100 cm-3, which is much higher than the PDR model predicts at the depth where the HnO+ ions are abundant, as seen in Fig. 10 of Nagy et al. (2013). However, raising the pressure in the PDR model by 50% would increase the predicted (OH+) to the value suggested by the non-LTE models. Such an increase is consistent with the CH+ and SH+ observations, and is also suggested by observations of high- CO lines with PACS (Joblin et al, in prep.). Furthermore, the Meudon PDR model uses a scaling of the average interstellar radiation field, while realistic models should use direct observations of the dominant hot star C Ori for the H-ionizing part of the spectrum and the wavelength range where OH photoionization occurs, which could contribute significantly to the formation of OH+.
Acknowledgements.
The authors thank Sébastien Bardeau and Jérôme Pety (IRAM) for help with the data reduction, Franck le Petit (Paris-Meudon) for assistance with the PDR model calculations, Arturo Rodríguez-Franco (Madrid) for sending his CN map in electronic form, Xander Tielens (Leiden) for useful discussions, Inga Kamp (Groningen) for a careful reading of the manuscript, Christine Joblin (Toulouse) & Javier Goecoechea (Madrid) for sharing their PACS observations of the [OIII] line, and the referee for a useful report. AF acknowledges support by the Agence Nationale de la Recherche (ANR-HYDRIDES), contract ANR-12-BS05-0011-01. HIFI has been designed and built by a consortium of institutes and university departments from across Europe, Canada and the US under the leadership of SRON Netherlands Institute for Space Research, Groningen, The Netherlands with major contributions from Germany, France and the US. Consortium members are: Canada: CSA, U.Waterloo; France: CESR, LAB, LERMA, IRAM; Germany: KOSMA, MPIfR, MPS; Ireland, NUI Maynooth; Italy: ASI, IFSI-INAF, Arcetri-INAF; Netherlands: SRON, TUD; Poland: CAMK, CBK; Spain: Observatorio Astronómico Nacional (IGN), Centro de Astrobiología (CSIC-INTA); Sweden: Chalmers University of Technology - MC2, RSS & GARD, Onsala Space Observatory, Swedish National Space Board, Stockholm University - Stockholm Observatory; Switzerland: ETH Zürich, FHNW; USA: Caltech, JPL, NHSC.References
- Allers et al. (2005) Allers, K. N., Jaffe, D. T., Lacy, J. H., Draine, B. T., & Richter, M. J. 2005, ApJ, 630, 368
- Andersson et al. (2008) Andersson, S., Barinovs, Ģ., & Nyman, G. 2008, ApJ, 678, 1042
- Arab et al. (2012) Arab, H., Abergel, A., Habart, E., et al. 2012, A&A, 541, A19
- Batrla & Wilson (2003) Batrla, W. & Wilson, T. L. 2003, A&A, 408, 231
- Benz et al. (2010) Benz, A. O., Bruderer, S., van Dishoeck, E. F., et al. 2010, A&A, 521, L35
- Bergin et al. (2010) Bergin, E. A., Phillips, T. G., Comito, C., et al. 2010, A&A, 521, L20
- Bergin & Tafalla (2007) Bergin, E. A. & Tafalla, M. 2007, ARA&A, 45, 339
- Black (1983) Black, J. H. 1983, in IAU Symposium, Vol. 103, Planetary Nebulae, ed. D. R. Flower, 91–100
- Black & van Dishoeck (1991) Black, J. H. & van Dishoeck, E. F. 1991, ApJ, 369, L9
- Blagrave & Martin (2004) Blagrave, K. P. M. & Martin, P. G. 2004, ApJ, 610, 813
- Bruderer et al. (2010) Bruderer, S., Benz, A. O., van Dishoeck, E. F., et al. 2010, A&A, 521, L44
- Chu & Dalgarno (1974) Chu, S.-I. & Dalgarno, A. 1974, Phys. Rev. A, 10, 788
- Corey & McCourt (1984) Corey, G. C. & McCourt, F. R. 1984, J. Chem. Phys., 81, 3892
- de Almeida & Singh (1981) de Almeida, A. A. & Singh, P. D. 1981, A&A, 95, 383
- De Graauw et al. (2010) De Graauw, T., Helmich, F. P., Phillips, T. G., et al. 2010, A&A, 518, L6
- Draine (1978) Draine, B. T. 1978, ApJS, 36, 595
- Faure & Lique (2012) Faure, A. & Lique, F. 2012, MNRAS, 425, 740
- Faure & Tennyson (2001) Faure, A. & Tennyson, J. 2001, MNRAS, 325, 443
- Federer et al. (1984) Federer, W., Villinger, H., Howorka, F., et al. 1984, Phys. Rev. Lett., 52, 2084
- Ferland et al. (2013) Ferland, G. J., Porter, R. L., van Hoof, P. A. M., et al. 2013, Rev. Mexicana Astron. Astrofis., 49, 137
- Fuente et al. (2003) Fuente, A., Rodrıguez-Franco, A., Garcıa-Burillo, S., Martın-Pintado, J., & Black, J. H. 2003, A&A, 406, 899
- Gerin et al. (2010) Gerin, M., de Luca, M., Black, J., et al. 2010, A&A, 518, L110
- Goicoechea et al. (2011) Goicoechea, J. R., Joblin, C., Contursi, A., et al. 2011, A&A, 530, L16
- Goicoechea & Le Bourlot (2007) Goicoechea, J. R. & Le Bourlot, J. 2007, A&A, 467, 1
- González-Alfonso et al. (2013) González-Alfonso, E., Fischer, J., Bruderer, S., et al. 2013, A&A, 550, A25
- González-García et al. (2008) González-García, M., Le Bourlot, J., Le Petit, F., & Roueff, E. 2008, A&A, 485, 127
- Gupta et al. (2010) Gupta, H., Rimmer, P., Pearson, J. C., et al. 2010, A&A, 521, L47
- Harrison et al. (2013) Harrison, S., Faure, A., & Tennyson, J. 2013, MNRAS, 435, 3541
- Herzberg & Lew (1974) Herzberg, G. & Lew, H. 1974, A&A, 31, 123
- Hirota et al. (2007) Hirota, T., Bushimata, T., Choi, Y. K., et al. 2007, PASJ, 59, 897
- Hogerheijde et al. (1995) Hogerheijde, M. R., Jansen, D. J., & van Dishoeck, E. F. 1995, A&A, 294, 792
- Hollenbach et al. (2012) Hollenbach, D., Kaufman, M. J., Neufeld, D., Wolfire, M., & Goicoechea, J. R. 2012, ApJ, 754, 105
- Houde et al. (2004) Houde, M., Dowell, C. D., Hildebrand, R. H., et al. 2004, ApJ, 604, 717
- Indriolo & McCall (2012) Indriolo, N. & McCall, B. J. 2012, ApJ, 745, 91
- Indriolo et al. (2012) Indriolo, N., Neufeld, D. A., Gerin, M., et al. 2012, ApJ, 758, 83
- Kamenetzky et al. (2012) Kamenetzky, J., Glenn, J., Rangwala, N., et al. 2012, ApJ, 753, 70
- Krełowski et al. (2010) Krełowski, J., Beletsky, Y., & Galazutdinov, G. A. 2010, ApJ, 719, L20
- Larsson et al. (2012) Larsson, M., Geppert, W. D., & Nyman, G. 2012, Rep. Prog. Phys., 75, 066901
- Le Petit et al. (2006) Le Petit, F., Nehmé, C., Le Bourlot, J., & Roueff, E. 2006, ApJS, 164, 506
- Leurini et al. (2006) Leurini, S., Rolffs, R., Thorwirth, S., et al. 2006, A&A, 454, L47
- Lis & Schilke (2003) Lis, D. C. & Schilke, P. 2003, ApJ, 597, L145
- López-Sepulcre et al. (2013) López-Sepulcre, A., Kama, M., Ceccarelli, C., et al. 2013, A&A, 549, A114
- Meijerink et al. (2006) Meijerink, R., Spaans, M., & Israel, F. P. 2006, ApJ, 650, L103
- Melnick et al. (2012) Melnick, G. J., Tolls, V., Goldsmith, P. F., et al. 2012, ApJ, 752, 26
- Menten et al. (2007) Menten, K. M., Reid, M. J., Forbrich, J., & Brunthaler, A. 2007, A&A, 474, 515
- Mesa-Delgado et al. (2011) Mesa-Delgado, A., Núñez-Díaz, M., Esteban, C., López-Martín, L., & García-Rojas, J. 2011, MNRAS, 417, 420
- Milligan & McEwan (2000) Milligan, D. B. & McEwan, M. J. 2000, Chemical Physics Letters, 319, 482
- Müller et al. (2001) Müller, H. S. P., Thorwirth, S., Roth, D. A., & Winnewisser, G. 2001, A&A, 370, L49
- Nagy et al. (2013) Nagy, Z., Van der Tak, F. F. S., Ossenkopf, V., et al. 2013, A&A, 550, A96
- Neufeld et al. (2010) Neufeld, D. A., Goicoechea, J. R., Sonnentrucker, P., et al. 2010, A&A, 521, L10
- Ossenkopf et al. (2010) Ossenkopf, V., Müller, H. S. P., Lis, D. C., et al. 2010, A&A, 518, L111
- Ossenkopf et al. (2013) Ossenkopf, V., Röllig, M., Neufeld, D. A., et al. 2013, A&A, 550, A57
- Ott (2010) Ott, S. 2010, in Astronomical Society of the Pacific Conference Series, Vol. 434, Astronomical Data Analysis Software and Systems XIX, ed. Y. Mizumoto, K.-I. Morita, & M. Ohishi, 139
- Phillips et al. (1992) Phillips, T. G., van Dishoeck, E. F., & Keene, J. 1992, ApJ, 399, 533
- Pilbratt et al. (2010) Pilbratt, G. L., Riedinger, J. R., Passvogel, T., et al. 2010, A&A, 518, L1
- Rangwala et al. (2011) Rangwala, N., Maloney, P. R., Glenn, J., et al. 2011, ApJ, 743, 94
- Rodríguez-Franco et al. (1998) Rodríguez-Franco, A., Martín-Pintado, J., & Fuente, A. 1998, A&A, 329, 1097
- Rodríguez-Franco et al. (2001) Rodríguez-Franco, A., Wilson, T. L., Martín-Pintado, J., & Fuente, A. 2001, ApJ, 559, 985
- Roelfsema et al. (2012) Roelfsema, P. R., Helmich, F. P., Teyssier, D., et al. 2012, A&A, 537, A17
- Schmid-Burgk et al. (2004) Schmid-Burgk, J., Muders, D., Müller, H. S. P., & Brupbacher-Gatehouse, B. 2004, A&A, 419, 949
- Schöier et al. (2005) Schöier, F. L., van der Tak, F. F. S., van Dishoeck, E. F., & Black, J. H. 2005, A&A, 432, 369
- Sharpee et al. (2004) Sharpee, B. D., Slanger, T. G., Huestis, D. L., & Cosby, P. C. 2004, ApJ, 606, 605
- Spinoglio et al. (2012) Spinoglio, L., Pereira-Santaella, M., Busquet, G., et al. 2012, ApJ, 758, 108
- Störzer et al. (1995) Störzer, H., Stutzki, J., & Sternberg, A. 1995, A&A, 296, L9
- Swings & Page (1950) Swings, P. & Page, T. 1950, ApJ, 111, 530
- Van der Tak et al. (2007) Van der Tak, F. F. S., Black, J. H., Schöier, F. L., Jansen, D. J., & van Dishoeck, E. F. 2007, A&A, 468, 627
- Van der Tak et al. (2012) Van der Tak, F. F. S., Ossenkopf, V., Nagy, Z., et al. 2012, A&A, 537, L10
- Van der Tak & van Dishoeck (2000) Van der Tak, F. F. S. & van Dishoeck, E. F. 2000, A&A, 358, L79
- Van der Werf et al. (2013) Van der Werf, P. P., Goss, W. M., & O’Dell, C. R. 2013, ApJ, 762, 101
- Van der Werf et al. (2010) Van der Werf, P. P., Isaak, K. G., Meijerink, R., et al. 2010, A&A, 518, L42
- Van der Wiel et al. (2009) Van der Wiel, M. H. D., van der Tak, F. F. S., Ossenkopf, V., et al. 2009, A&A, 498, 161
- Van Leeuwen (2007) Van Leeuwen, F. 2007, A&A, 474, 653
- Walmsley et al. (2000) Walmsley, C. M., Natta, A., Oliva, E., & Testi, L. 2000, A&A, 364, 301
- Weiß et al. (2010) Weiß, A., Requena-Torres, M. A., Güsten, R., et al. 2010, A&A, 521, L1
- Werner et al. (1983) Werner, H.-J., Rosmus, P., & Reinsch, E.-A. 1983, J. Chem. Phys., 79, 905
- Woodall et al. (2007) Woodall, J., Agúndez, M., Markwick-Kemper, A. J., & Millar, T. J. 2007, A&A, 466, 1197
- Wyrowski et al. (2010) Wyrowski, F., Menten, K. M., Güsten, R., & Belloche, A. 2010, A&A, 518, A26
- Wyrowski et al. (1997) Wyrowski, F., Schilke, P., Hofner, P., & Walmsley, C. M. 1997, ApJ, 487, L171
Appendix A Inelastic collision rates for the OH+– e- system
The electronic ground state symmetry of the radical OH+ is . Each rotational level is therefore split by the spin-rotation coupling between and the electronic spin so that each rotational level has two sub-levels given by . In addition, owing to the non-zero nuclear spin of the hydrogen atom (=1/2), each fine-structure level is further split into 2 hyperfine levels . The rotational constant of OH+ is 492.26 GHz. The fine-structure splitting is of the order of 60–90 GHz while the hyperfine splitting is less than 0.3 GHz. The dipole moment of OH+ is 2.26 D (Werner et al. 1983).
Electron-impact hyperfine excitation rate coefficients for OH+ were computed using a three-step procedure: i) rotational excitation rate coefficients for the dipolar () transitions were first computed within the Coulomb-Born approximation; ii) fine-structure excitation rate coefficients were then obtained from the Coulomb-Born rotational rates using the (scaled) infinite-order-sudden (IOS) approximation; and iii) hyperfine excitation rate coefficients were finally obtained using the so-called “statistical” or “proportional” approach. The Coulomb-Born approximation (Chu & Dalgarno 1974) is expected to be accurate for polar molecules with dipoles in excess of D because the dipolar cross sections are entirely dominated by long-range effects and cross sections for transitions with are significantly smaller (Faure & Tennyson 2001). In practice, Coulomb-Born cross sections were computed for collision energies below 2 eV and rate coefficients were deduced for temperatures ranging from 10 to 2000 K. The IOS approximation was employed to derive the fine-structure rate coefficients in terms of the rotational rates for excitation out of the lowest rotational level . This IOS formalism was first introduced by Corey & McCourt (1984) for linear molecules with symmetry. As the Coulomb-Born rotational rates do not strictly obey the IOS factorization formulae, however, the IOS fine-structure rate coefficients were scaled, as recommended by Faure & Lique (2012) (see their Eqs. (8), (10) and (13), where the quantum number should be replaced by ). While in principle the IOS approximation should be also applicable to obtain the hyperfine rate coefficients of OH+, there is to our knowledge no available factorization formula for a molecule. Hyperfine rate coefficients were therefore obtained from the fine-structure rates by assuming that they are proportional to the degeneracy of the final hyperfine level. We note that this simple statistical approach does not account for the collisional propensity rule . As shown by Faure & Lique (2012), however, at low total optical depth () the statistical approach is applicable because in this regime the relative populations of each hyperfine component are close to the statistical weights.
The above three-step procedure was applied to the first 49 levels of OH+, that is up to the level which lies 1689 K above the ground state (0, 1, 3/2), resulting in 176 collisional transitions. A typical accuracy of 30% is expected for these rate coefficients, with the largest rate coefficients being of the order of cm3s-1. The rates will be posted on the website of the LAMDA database (Schöier et al. 2005)777http://home.strw.leidenuniv.nl/moldata/.