Search for the Infrared Emission Features from Deuterated Interstellar Polycyclic Aromatic Hydrocarbons
Abstract
We report the results of a search for emission features from interstellar deuterated polycyclic aromatic hydrocarbons (PAHs) in the 4 m region with the Infrared Camera (IRC) onboard AKARI. No significant excess emission is seen in 4.34.7 m in the spectra toward the Orion Bar and M17 after the subtraction of line emission from the ionized gas. A small excess of emission remains at around 4.4 and 4.65 m, but the ratio of their intensity to that of the band emission from PAHs at 3.33.5 m is estimated as 23%. This is an order of magnitude smaller than the values previously reported and also those predicted by the model of deuterium depletion onto PAHs. Since the subtraction of the ionized gas emission introduces an uncertainty, the deuterated PAH features are also searched for in the reflection nebula GN 18.14.0, which does not show emission lines from ionized gas. We obtain a similar result that excess emission in the 4 m region, if present, is about 2% of the PAH band emission in the 3 m region. The present study does not find evidence for the presence of the large amount of deuterated PAHs that the depletion model predicts. The results are discussed in the context of deuterium depletion in the interstellar medium.
1 Introduction
Deuterium (D) is one of the light elements created in the big bang, whose primordial abundance depends sensitively on the cosmological constants (Boesgaard & Steigman, 1983). D is destroyed by nuclear reactions in stellar interiors, a process termed astration, and its abundance decreases monotonically along with the chemical evolution of the Galaxy (Epstein et al., 1976; Mazzitelli & Moertti, 1980). The abundance of D in the present day is thus directly related to the primordial nucleosynthesis and the subsequent Galactic chemical evolution. The D astration factor, defined as the ratio of the primordial to the present-day D to hydrogen (D/H) ratio, should reflect the history of the star-formation and the infall of the pristine gas to the Galactic disk (e.g., Romano et al., 2006; Tsujimoto, 2011). However, the observed D/H ratio of the interstellar gas shows no systematic trend with the metallicity, but shows a considerable scatter, which cannot be accounted for solely by Galactic chemical evolution models (Tosi, 2010). Linsky et al. (2006) show several pieces of evidence that D is depleted onto dust grains in the interstellar medium (ISM), which was originally suggested by Jura (1982). They show that the D/H ratio of the interstellar gas is well correlated with the depletion of iron and silicon and also with the excitation temperature of molecular hydrogen. Enrichment of D found in interplanetary dust particles (Messenger, 2002) further supports the depletion model of D.
Draine (2006) proposes that interstellar polycyclic aromatic hydrocarbons (PAHs) can be the major reservoir of interstellar D. PAHs are thought to be responsible for a series of the emission bands in the near- to mid-infrared region (Leger & Puget, 1984; Allamandola et al., 1985, 1989), referred to as “PAH features,” which are ubiquitously observed in the ISM (e.g., Onaka et al., 1996; Mattila et al., 1996; Tsumura et al., 2013). PAHs are small particles of less than 1 nm in size and carry about 3.5% of cosmic carbon atoms (Tielens, 2008). Based upon a thermodynamic equilibrium argument, Draine (2006) shows that the D/H ratio in PAHs can be as high as , which is sufficient to account for the observed range of D/H of the interstellar gas, if the gas temperature is lower than 90K.
When H in PAHs is replaced by D, the emission bands originating from vibration modes of C−H bonds should be shifted to longer wavelengths by a factor of the difference in reduced mass between the C−H and C−D oscillators. The emission bands at 3.3 and 3.43.5 m, which come from stretching vibrations of aromatic and aliphatic C−H bonds, are thus expected to move to and 4.7 m in deuterated PAHs (PADs, Hudgins et al., 2004). Verstraete et al. (1996) report detection of an emission feature at 4.65 m with the 4.4 level in M17 based on observations with the Short Wavelength Spectrometer (SWS) onboard the Infrared Space Observatory (ISO). Subsequently Peeters et al. (2004) report detection of emission bands at 4.4 and 4.65 m at 1.9 and 4.4 levels in the Orion Bar region with SWS observations and attribute them to aromatic and aliphatic stretching vibration modes of C−D in PADs, respectively. They estimate the ratio of the sum of the integrated band intensities at 4.4 and 4.65 m to those at 3.3 and 3.43.5 m as in the Orion Bar and in M17. While those ratios are in the range of D/H predicted by the depletion model of D onto PAHs (Draine, 2006), the spectral range 4.085.30 m of the SWS (band 2a) has a rather high noise level and similar features are not detected in any other objects. Therefore, it is strongly desirable to obtain spectra with higher signal-to-noise ratios and confirm the detection, particularly for the 4.4 m band, giving a better constraint on the D/H ratio in PAHs.
The spectral range of 4.34.7 m is largely obscured by the terrestrial atmosphere and we need space telescopes to observe these PAD features. The Infrared Camera (IRC) onboard the AKARI infrared satellite (Murakami et al., 2007) has a spectroscopic capability in the near-infrared (NIR; 25 m) with a high sensitivity (Onaka et al., 2007; Ohyama et al., 2007). In this paper, we report observations of the PAD features in the Orion Bar, M17, and the reflection nebula GN18.14.0 in 4.34.7 m with the Infrared Camera (IRC), carried out in its warm mission phase (Phase 3, Onaka et al., 2010).
2 Observations and data reduction
The present observations were carried out in the warm mission phase of AKARI after the exhaustion of liquid helium, where only NIR observations were executed, as part of the “Interstellar Medium in our Galaxy and Nearby Galaxies” program (ISMGN, Kaneda et al., 2009). Even after the exhaustion of liquid helium, the telescope and focal plane instruments were kept sufficiently cold ( K) by the onboard cryocooler and the NIR channel of the IRC was able to be operated. At temperatures below 47 K, the thermal background from the telescope was still negligible for wavelengths shorter than 5 m and the IRC was able to perform NIR spectroscopy with high sensitivity compared to large, but warm telescopes, particularly for observations of the diffuse emission, being free from the disturbance of the terrestrial atmosphere (Onaka et al., 2010).
The IRC has a variety of options for the NIR spectroscopy using its special aperture mask pattern (Onaka et al., 2007). In the present observations, slit spectroscopy was performed, using the Ns and Nh slits with the grism disperser. The Ns slit is , while the Nh slit has a size of . The Ns and Nh slits observe the sky separated by about 2′ simultaneously. The Ns slit width is adjusted to the mid-infrared (MIR) channel and the Nh width matches with about 2 pixels of the NIR channel (292). The NIR grism (NG) provides a dispersion of 0.0097 m per pixel for 2.55 m and spectroscopy with Nh gives a slightly better spectral resolution than that with Ns.
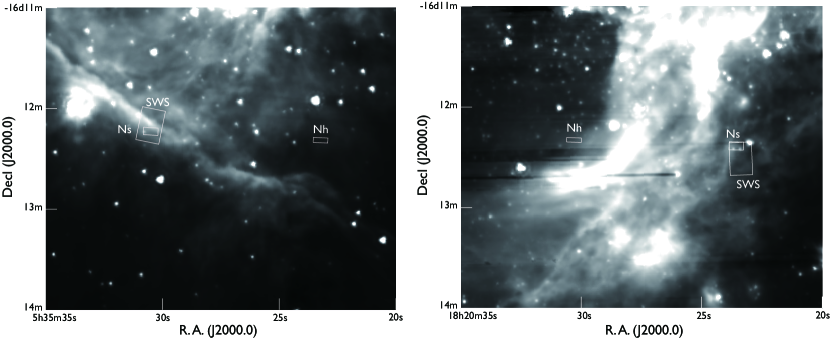
In the program ISMGN, a number of extended objects in the Galactic plane have been observed with NIR spectroscopy, including the Orion Bar and M17. For both targets, the center of the Ns slit was intended to be at the position of the SWS observations. Since the IRC Ns slit is smaller than the aperture of the SWS (), only a part of the SWS aperture is covered with the Ns slit. Due to the limited accuracy of the absolute pointing, the actual slit position was slightly different from those intended, but the Ns slit overlapped with part of the SWS aperture in both targets. NIR Ns spectra are extracted from the overlapping region with the slit length of 6 pixels (876) and they are analyzed in the following sections. Variation along the slit is not significant for both targets. The central part of the Nh slit spectra is also extracted for comparison. Figure 1 shows the slit positions of the SWS (large boxes) and the regions where the spectra are extracted in the present study (small boxes). The Nh slit turns out to be located toward the ionized region in both objects (see § 3). In addition to these two objects, we also include the reflection nebula G18.14.0, which does not show a signature of the ionized gas, in the present study. The observation was carried out toward the western boundary of the nebula of G18.14.0. Details of the present observation data are summarized in Table 1.
The data reduction was performed with the official pipeline optimized for Phase 3 version 20111121. Due to the increase in the temperature in Phase 3, the dark current becomes non-negligible and the number of hot pixels increases. Even after the subtraction of the dark current in the official pipeline, the residual dark signals are still recognizable at the edge region of a 10 pixel width next to the Nh slit, which is supposed to be blocked by the aperture mask. The residual dark signals are estimated from this region and subtracted in the post pipeline process. This process also corrects for spurious patterns parallel to the spatial direction due to the detector anomaly. The present targets are sufficiently bright and this correction has only a small effect on their spectra. Then the spectra are averaged for a pixel region, both in the spectral and spatial directions, with the official pipeline software. This averaging process significantly reduces the noise level with a minimum cost to spectral and spatial resolutions.
3 Results and analysis
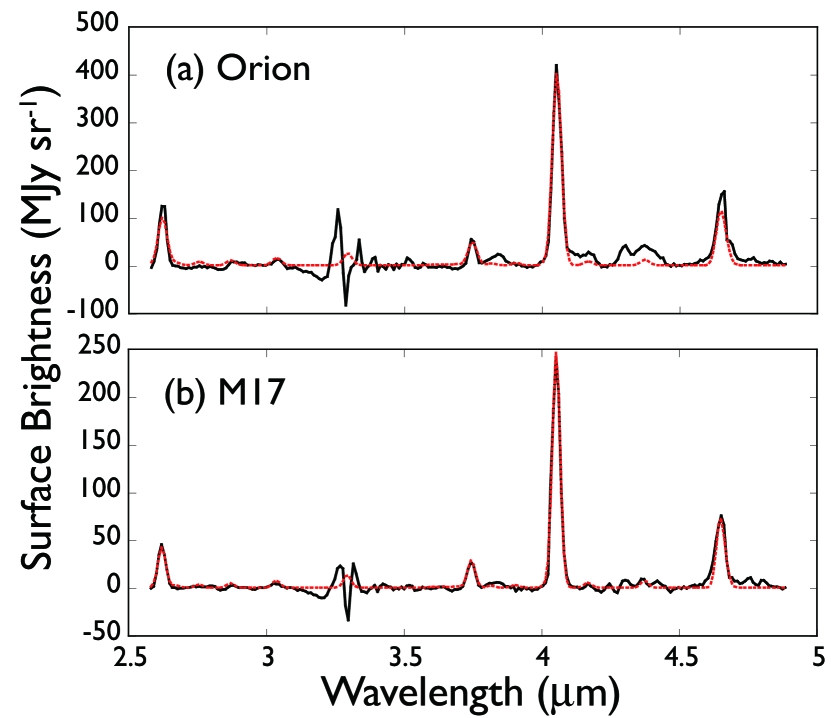
Figure 2 displays the obtained spectra. The Ns spectra of the Orion Bar and M17 are rich in features. Both are dominated by PAH band emission at 3.33.5 m and a number of hydrogen recombination lines are also seen clearly. The general characteristics of the Ns spectra are in agreement with the SWS spectra (Peeters et al., 2004) and are typical for the photodissociation region (PDR) associated with ionized gas. The Ns spectrum of M17 (Fig. 2c) also indicates the presence of CO2 ice absorption at 4.27 m. The CO2 ice absorption is not evident in other spectra. The hydrogen recombination lines appear quite strong in the Nh spectra of the Orion and M17 with the faint PAH band emission, suggesting that the ionized gas dominates in these regions. The Ns spectrum of G18.14.0 shows clear PAH features, but the recombination lines are not observed. G18.14.0 is associated with a young stellar cluster (Bica et al., 2003). The spectral type of the central star of the nebula HD 167638 is B2II, consistent with the absence of ionized gas emission in the spectrum. We assume that this target represents a typical PDR without ionized gas. Possible identification of the features in these spectra is indicated in Figures 2a, c, and e and summarized in Table 2. Note that some of the features in these spectra are blended with bright emission lines and bands, and therefore are not individually resolved. Also unambiguous identification of the faint features is difficult with the low spectral resolution of these observations.
The Ns spectra of the Orion Bar and M17 show a number of emission features in the range 45 m (Figure 2). To estimate the feature intensities, first we make a spline fit to the continuum and then fit the PAH band emission and the ice absorption. The pivot points for the spline fit are set as around 2.57, 2.67, 3.70, 3.95, 4.14, 4.50, and 4.88 m. For the Orion Bar, the 4.14 m point is shifted to 4.24 m to avoid possible excess emission around 4.16 m. Three PAH band components are clearly seen at 3.29, 3.41, and 3.48 m. The former two bands have sufficiently broad intrinsic widths compared to the present spectral resolution, while the 3.48 m band is known to consist of more than one components, which cannot be resolved by the present resolution (Geballe et al., 1989). Hence, we approximate the 3.29 and 3.41 m bands by Lorentzian functions and the 3.48 m band by a Gaussian in the fitting. This combination of functions provides the best fit for the 3 m emission. The CO2 ice absorption at 4.27 m is clearly seen in the M17 spectrum. The presence of the CO2 ice band also suggests the presence of the broad H2O ice absorption at around 3 m, (e.g., Gibb et al., 2004; Shimonishi et al., 2010), but it is not obvious when the absorption is weak and overlaps with the bright PAH band emission. A simple screen geometry, in which the ice species are located in front of the emission source, is assumed in the spectrum fit. For the H2O ice absorption, we employ laboratory data taken at 10K (Ehrenfreund et al., 1996), whereas we assume a Gaussian profile in absorption for the CO2 ice because of its narrow width (Shimonishi et al., 2010). Details of the fit are given in Mori et al. (2013), which employ a slightly different method to estimate the continuum. In the present study, we intend to fit the lower boundary of the spectrum in the estimate of the continuum to obtain an upper limit for the remaining emission.
The best fit indicates the presence of H2O ice with a column density of cm-2 for the Orion Bar, which is in the weakest end of the observed range (Gibb et al., 2004). No positive detection of the CO2 ice is obtained for the Orion Bar. The fit of the M17 spectrum provides the column densities of the H2O and CO2 ices as and cm-3, respectively. The ratio of the CO2 to H2O ice column densities is %, which is in agreement with the ratios found in massive young stellar objects (%, Gerakines et al., 1999; Nummelin et al., 2001). The spectrum of G18.14.0 also suggests the presence of weak ice absorption. The best fit yields a column density of and cm-3 for H2O and CO2 ices, respectively. The column density ratio of % is again in the range expected for massive young stellar objects. The fitted spectra are shown by the red dashed lines in Figure 2.
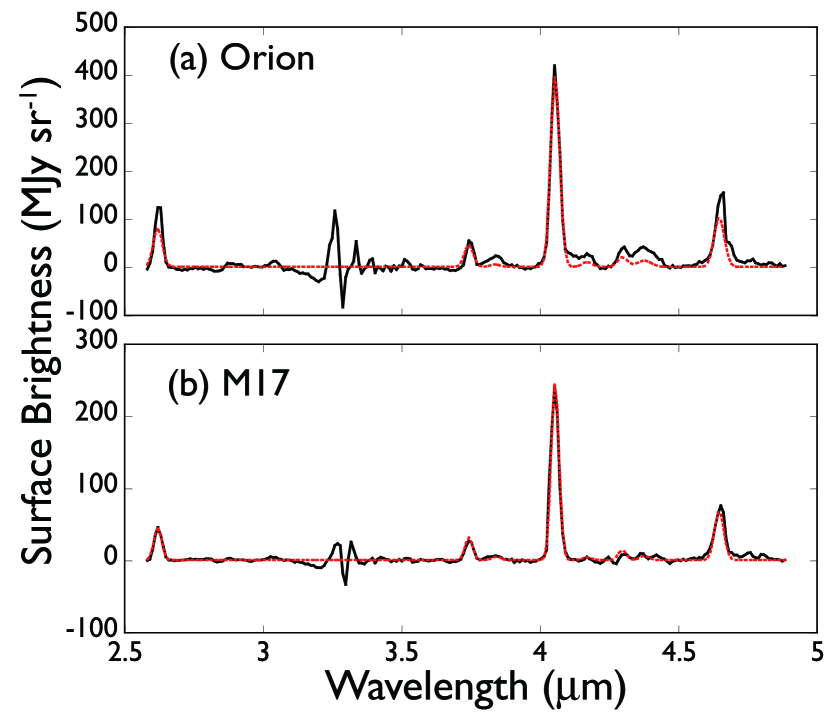
In the next step we subtract the estimated continuum, the PAH band emission, and the ice absorption from the observed spectrum. Figures 3a and b show the residual spectra for the Orion Bar and M17, which show the remaining emission features. The residual seen around the 3 m region comes from the imperfect modeling of the PAH band emission, and it does not affect the following discussion. In the range 4.34.7 m, several features appear clearly. The strongest one is H I Pf at 4.6538 m. Pf in the Orion spectrum seems to be broader than other H I lines and may be blended with the pure rotation line of H2 S(9) at 4.6946 m. H I Hu at 4.6725 m could also make a contribution. The 4.65 m emission of the Orion spectrum is found to be better fitted by two Gaussians at 4.65 and 4.69 m, supporting the contribution from the H2 line (see below). The presence of H2 emission in the Orion spectrum is also supported by possible detection of other pure rotational lines of H2 of S(10), S(11), and S(13) at 4.41, 4.18, and 3.85 m, respectively (Figure 2a). The S(12) line overlaps with Br and cannot be confirmed. The H2 lines are not clearly detected in the M17 spectrum. The feature at 4.3 m, which appears strong in the Orion spectrum, is identified as the recombination line of He I (van den Ancker et al., 2000). A broad emission is also seen at around 4.4 m. The He I line is weak and the presence of a feature around 4.4 m is not obvious in the M17 spectrum. There are no other excess emission features seen in 4.34.7 m.
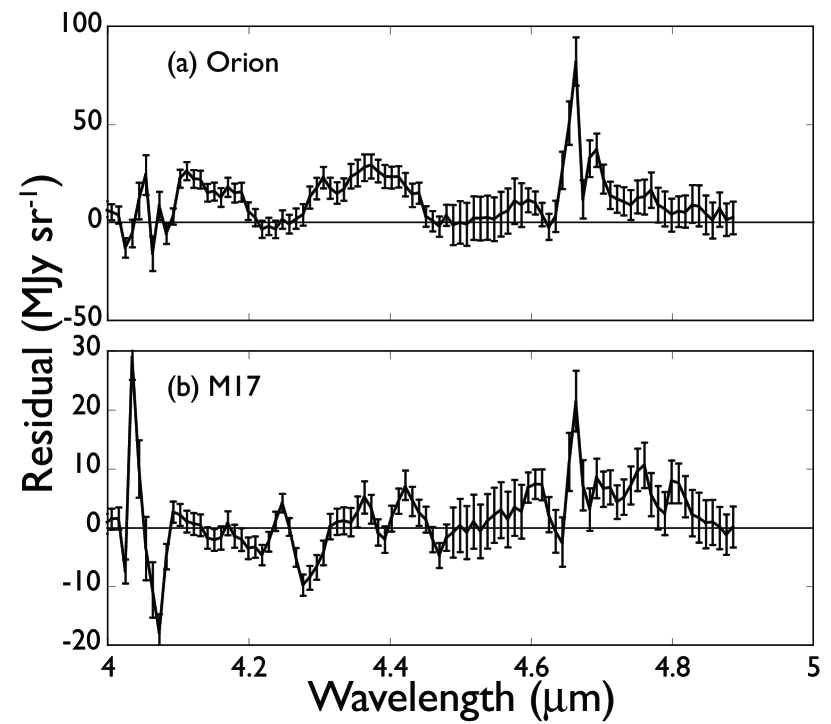
To estimate the contribution of H I recombination lines, we calculate a simple hydrogen recombination line model of the Case B conditions with K and cm-3, where and are the electron temperature and density of the ionized gas, respectively (Storey & Hummer, 1995) and scale it to the observed Br intensity. The estimated H I emission is shown by the red dotted lines in Figure 3. For the Orion spectrum we assume no extinction, while we set mag for M17 to fit the Br intensity. The models fit most of the H I recombination lines fairly well, including faint ones, particularly for M17, suggesting the validity of the Case B calculation for the estimate of the H I line intensities. The uncertainty in is estimated to be smaller than 1 mag, which will affect the Pf intensity estimated from the Br only by 0.7%. Then we subtract the model line emission from the observed spectra and plot the residuals in the range 45 m in Figure 4. The locations of the known emission lines (Table 2) are also indicated in Figure 4a. The He I line at 4.3 m remains together with a broad emission around 4.4 m in the spectrum of the Orion Bar. Part of the 4.4 m residual emission can be attributed to H2 S(10) and residual H I Hu12, although the latter is too faint to account for the amount of the entire residual emission. Residual emission is also seen at 4.654.7 m. Part of the residual comes from H2 S(9) at 4.6946 m, which now appears clearly in Figure 4a. For M17, the residuals are smaller than the Orion spectrum. There may be some residual in the blue part of the Pf around 4.6 m.
The intensity of the He recombination line depends sensitively on the conditions of the ionized gas in contrast to the hydrogen recombination lines and it is difficult to predict its intensity from the present data accurately. We cannot rule out a possibility of unknown faint emission features present in the ionized gas either. As an alternative way to the Case B model calculation, we make use of the spectra taken at the Nh slit, which are dominated by the ionized gas, to estimate the emission lines from the ionized gas in each region. Here we simply assume that the relative emission line intensities do not vary from the Nh to Ns positions appreciably as a first approximation. Figure 5 shows the spectrum estimated from the Nh spectra after being scaled to the Br intensity and adjusted to the spectral resolution of Ns. The H I emission line intensities in the Nh spectra are also in good agreement with the Case B model calculation and thus the overall agreement in the H I lines is not unexpected.
Figure 6 plots the residual between the observed Ns spectra and the spectra estimated from the Nh spectra. The residual emission at 4.3 m in the Orion spectrum is reduced, confirming that it comes from the He I line. The line emission estimated from the Nh spectra also accounts for part of the emission at 4.4 m region in the Orion, but not perfectly, suggesting a partial contribution from the ionized gas components. The emission around 4.4 m still remains. The excess emission around 4.65 m is also reduced in the M17 spectrum to some extent. Some excess emission is apparent at the position of Pf (4.65 m) in both spectra.
The residuals in Figure 6 are generally smaller than those in Figure 4. To estimate the excess intensities conservatively, however, we use the residuals shown in Figure 4, in which the line emission estimated from the Case B conditions is subtracted. We assume that the emission at 4.3 m is the He I line and take account of the emission only at around 4.4 m. For the emission around 4.65 m, we separate the contribution from H2 S(9) by fitting two Gaussians for the Orion spectrum and estimate the residual emission at around 4.65 m. For the M17 spectrum, we simply calculate the residual emission at 4.65 m. The results are summarized in Table 3 together with the intensities of the PAH bands. Intensities of the excess emission are estimated by a fit of the excess with a Gaussian and errors are derived from the fitting, also taking account of any observational error. For the estimate of the PAH bands, the separation of the 3.41 and 3.48 m bands cannot be made accurately at this spectral resolution and only the summation of the two features is given. Contribution to the 3.29 m band from Pf is subtracted assuming the Case B model, which is small (%) for both spectra. In the following, we assume that the 3.29 m band comes from aromatic C−H bonds and the 3.41 and 3.48 m bands from aliphatic C−H bonds in PAHs. The features at 4.4 and 4.65 m are assumed to be the corresponding features from aromatic and aliphatic C−D bonds in PADs, respectively (Peeters et al., 2004). No extinction correction is applied for the estimate of the PAH band intensities.
The spectrum that contains contribution from the ionized gas shows a number of emission lines. It is difficult to predict and identify faint features accurately with the resolution and sensitivity obtained here. To avoid possible faint emission from unknown species in the ionized gas, we require a spectrum that does not show a signature of the ionized gas, but has PAH emission with a sufficient signal-to-noise in our targets. Most of the spectra taken in the ISMGN program show some sign of the ionized gas. The reflection nebula G18.14.0 is the best target on these criteria in the ISMGN sample. The spectrum of G18.14.0 shows no evidence of the ionized gas, but has prominent PAH emission. There are weak emission features seen in 2.53 m (Figure 2e), some of which can be attributed to H2 10 O(2), O(3), and (4) at 2.627, 2.803, and 3.004 m (e.g., Lee et al., 2011). The O(2) line is at the same wavelength as H I Br and the absence of Br suggests that the excess at 2.63 m is attributable to O(2). These bands are weak, but at least the O(3) line seems to be real. Figure 4c plots the residual after the subtraction of the continuum and the PAH band emission with the ice absorption for 45 m (red dashed line in Figure 2e). There is small excess emission remaining at around 4.4 and 4.65 m. The detection of H2 10 lines in 2.53 m suggests possible contribution from H2 00 S(10) and S(9) to the excess at around 4.4 and 4.65 m, respectively. The emission features in 2.53 m are too weak to constrain the emission mechanism and conditions with accuracy, even if they are attributed to the H2 emission. Therefore, from the present spectra it is rather difficult to estimate the intensities of H2 S(9) and S(10) transitions accurately and thus they are not subtracted from the intensity of the excess emission. The intensities of the excess in G18.14.0 are also listed in Table 3 together with the PAH band intensities. As indicated in Table 3 the excess emission at 4.65 m is only at the 2.5 level and the presence of any excess is marginal.
4 Discussion
4.1 PAD to PAH ratio
The last three columns of Table 3 show the ratios of the intensities of PADs to those of PAHs. We estimate the ratios for the aromatic (4.4 m to 3.29 m) and the aliphatic (4.65 m to 3.41 and 3.48 m) components separately as well as for the total (aromatic + aliphatic) PAD to PAH features. The aliphatic component in the Orion Bar and M17 shows the ratios of 4% and 7%, respectively, but the ratios of the aromatic component and the total intensities are all less than 3%. The effect of extinction is not taken into account in these estimates. If we take account for the extinction effect for M17, the ratio will be decreased further by about 20%. The extinction is estimated to be not significant for the Orion Bar. For G18.14.0, the estimate of extinction using H I lines is not possible, but weaker ice absorption suggests that the effects should be smaller than for M17. Note that the contributions from H I lines are subtracted in these estimates, but those from molecular hydrogen are not except for the S(9) line in the Orion Bar.
The present result shows a clear contrast to the results by Peeters et al. (2004), who report the total ratio of for the Orion Bar and for M17. The present spectra do not show any strong excess emission in the 4 m region except for H I Pf. The remaining excess is about 10% of Br (Table 3) and the intensity of Pf is predicted with better accuracy than the excess. This is also supported by the estimate using the Nh spectra. The basic result is not affected by the method of the subtraction of the emission lines. The present observation covers only a part of the aperture of the SWS observations and it is possible that strong excess emission is present in the region that the IRC observations did not cover. The spatial variation along the Ns slit is, however, not significant, and no strong excess emission in the 4 m region is seen in the entire slit spectra. Thus it seems unlikely that the present observations miss the right spot in both targets, although we cannot rule out the possibility.
It should also be noted that the present estimate gives upper limits on the PAD band emission. The residual spectra, in which the line emission estimated from the ionized gas (Nh) spectra is subtracted, show smaller residuals, particularly for the 4.4 m emission, than those after subtraction of the Case B spectra. There could be contributions from faint emission of unknown species at around 4.4 m. Marginal detection of the excess emission at 4.65 m for G18.14.0 also suggests that the residual emission in this spectral range in the Orion Bar and M17 may have contribution from faint emission components in the ionized gas. For G18.14.0, there may be contribution from the pure rotation lines of H2. Since these features are weak, it is difficult to unambiguously attribute the excess emission seen at 4.4 and 4.65 m, if real, to deuterated PAHs or others from the present data. Spectra with higher spectral resolution and better signal-to-noise ratios are needed to make clear confirmation and identification of these excess emissions.
In the above discussion, we simply compare the intensities of the features in the 3 and 4 m regions according to the previous study (Peeters et al., 2004). However, the emission intensity depends on the transition probabilities, which may not be the same for C−H and C−D bonds. Also the emission in the NIR requires high excitation, whose conditions are different between the emission at 3 and 4 m. Bands at 4 m should be more easily excited than those at 3 m.
Bauschlicher et al. (1997) show that perdueterated PAHs have integrated intensities for their spectroscopic transitions reduced by a factor of 1.75 compared to fully hydrogenated PAHs. Assuming this reduction factor in the cross-section, we make a calculation based on a simple PAH emission model given by Mori et al. (2012) for D/H = 0.1 and 0.025 to roughly estimate the effects. The 3 m PAH emission is thought to come mainly from neutral PAHs (Draine & Li, 2001). Since we discuss only the ratio of the 4.4 m to 3.3 m band intensity, we simply assume that all the PAHs are neutral in the following estimate. Even if a half of the PAHs are assumed to be ionized, the band ratio is changed only by 0.5%. We also assume as a standard case that the temperature of the exciting source is 30000 K, and the size distribution of PAHs is given by a power-law with the number of carbon atoms in the smallest and largest PAHs of 20 and 4000, respectively. The results indicate that the ratio of the 4.4 m to 3.3 m band intensity is about 0.095 and 0.024, respectively. Easier excitation of the 4.4 m band compensates the smaller cross-section, resulting in an intensity ratio similar to the D/H abundance ratio. The result is obviously sensitive to the assumed parameters of the exciting source and the size distribution of PAHs. If the minimum number of carbon atoms is increased to 50, the intensity ratio becomes 0.14 and 0.035, respectively, which are larger than the abundance ratio by about 40%. Thus the observed intensity ratio may overestimate the true D/H ratio by several tens %, but not by an order of magnitude. The present study does not find evidence for the D fraction of more than 3% in the carriers that emit the 3 m PAH band emission.
4.2 Deuterium depletion model
The expected amount of the depleted D onto solid particles depends on the abundance of the observed distribution of the D/H ratios in the ISM, which is related to the primordial D abundance via chemical evolution in the Galaxy. The primordial D/H can be estimated from observations of distant quasars. The latest estimate based on quasar observations suggests (D/H) ppm, which is smaller than a previous estimate (Pettini et al., 2008), but is in good agreement with the most recent cosmological parameters deduced from the angular power spectrum of the comics microwave background (Pettini & Cooke, 2012). Prodanović et al. (2010) make a Bayesian analysis on the observations of gaseous D in the ISM and find that the maximum and minimum D/H in the ISM are and ppm, respectively, for a top hat distribution. The astration factor suggested by these results becomes less than 1.3, if the variation in the D/H ratio in the ISM is attributed to the depletion and the largest ratio is taken as the intrinsic D/H at the present. The small astration factor can be accounted for by a recent model of the chemical evolution that takes account of the declining star-formation together with the infall of pristine gas onto the Galactic disk (Tsujimoto, 2011).
The above analysis of the interstellar D/H distribution suggests that D/H of about 13 ppm needs to be depleted onto interstellar grains at maximum. Using this value, the D/H ratio expected in dust grains is estimated following Draine (2006). The C/H in interstellar grains is assumed to be about 200 ppm, 85% of which are in aromatic (Pendleton & Allamandola, 2002). For aromatic materials, H/C is about 0.35, which suggests 60 ppm of H in aromatic grains. Thus, the expected maximum D/H in PAHs is 0.28. The present result does not find evidence for D/H % in PAHs and only accounts for the interstellar D/H variation of ppm.
UV observations of D in the ISM generally probe regions with medium density and cannot investigate dense regions, while current NIR spectroscopy is not sensitive enough to detect emission from regions with relatively small optical depth. Thus if deuterated PAHs are present only in less dense regions, PAD emission cannot be detected in the present observations. Unimolecular photodissociation may work at moderate temperatures and can increase D fraction in PAHs in regions where UV radiation penetrates (Allamandola et al., 1989; Tielens, 1997; Hudgins et al., 2004). However it is difficult to obtain the high concentration of D suggested by the depletion observations with this mechanism. The observed amount of D depletion may be achieved only by the deuteration process in dense and cold environments (Draine, 2006). If the depletion of D onto PAHs predominantly occurs in cold and dense regions and is preserved in diffuse H I clouds toward which UV observations are carried out, a signature of PADs should appear in PDRs, targets of the present observations.
It should be noted that the present observation is only sensitive to the population of the smallest aromatic dust grains that emit 34 m emission. If D is depleted in PAHs whose size is too large to make prominent emission in the 34 m region, they could elude detection in the NIR spectroscopy. We estimate the size dependence using the simple model as above. Assuming that only PAHs whose number of carbon atoms is larger than 50 are deuterated and the total D/H = 0.1, then the 4.4 to 3.3 m band ratio becomes 0.049. Hence, if a large amount of interstellar D is depleted on PAHs, it might reside only in large PAHs. Emission expected from large deuterated PAHs would appear at longer wavelengths in a more complicated way than at the 4 m region because of the interaction between C−H and C−D in bending modes (Hudgins et al., 2004). A dedicated search for MIR features from large PADs is needed to test the depletion model and make a clear conclusion on D depletion onto PAHs.
5 Summary
We made sensitive spectroscopic observations in the NIR towards the Orion Bar, M17, and the reflection nebula G18.14.0 with the IRC on board AKARI. Neither of the spectra of the Orion Bar nor M17 shows evidence for strong emission features expected from deuterated PAHs in the 4 m region. Some excess emission remains at around 4.4 and 4.65 m after subtraction of the contribution from hydrogen recombination lines, but its intensity is less than previously reported. To avoid potential contributions from faint emission components in ionized gas, the spectrum of the reflection nebula G18.14.0 is also analyzed in a similar way. It shows a typical PDR spectrum without any sign of ionized gas. The spectrum indicates slight excess emission at around 4.4 m and a marginal detection of the excess at 4.65 m (2.7).
These excess emissions are weak and it should be emphasized that it is difficult to unambiguously rule out other possibilities and attribute these two features to PADs because of the low spectral resolution of the present observations. If we assume that they come from aromatic and aliphatic C−D in PADs, then the ratio of PAD (4.4 and 4.65 m) to PAH (3.29, 3.41, and 3.48 m) features is estimated as 3% at most in the three targets. If these 4 m features have different origins or there are contributions from other species, the ratio will further be reduced.
The effects of the difference in the cross-section and excitation between the 3 and 4 m emission are investigated based on a simple model calculation. The results suggest that the effects may overestimate the D/H ratio by several tens %, and do not affect the conclusion. The present study does not find evidence for the presence of a large amount of deuterated PAHs as predicted from the D depletion model.
The PAD/PAH ratio required to account for the observed distribution of D in the ISM is larger by an order of magnitude than the result of present observations. If interstellar D is depleted onto PAHs, then it must reside in large PAHs, which do not contribute dominantly to the NIR PAH emission. Search for MIR emission from PADs is needed to further test the D depletion model onto PAHs, although the band emission of PADs at the MIR is more complicated than at the 4 m region.
References
- Allamandola et al. (1985) Allamandola, L. J., Tielens, A. G. G. M.. & Barker, J. R. 1985, ApJ, 290, L25
- Allamandola et al. (1989) Allamandola, L. J., Tielens, A. G. G. M.. & Barker, J. R. 1989, ApJS, 71, 733
- Bauschlicher et al. (1997) Bauschlicher, C. W., Jr., Langhoff, S. R., Sandford, S. A., & Hudgins, D. M. 1997, J. Phys. Chem. A., 101, 2414
- Bica et al. (2003) Bica, E., Dutra, C. M., Soares, J., & Barbuy, B. 2003, A&A, 404, 223
- Boesgaard & Steigman (1983) Boesgaard, A. M., & Steigman, G. 1983, ARA&A, 23, 319
- Draine (2006) Draine, B. T. 2006, in ASP Conf. Ser. 348, Proc. Astrophysics in the Far Ultraviolet: Five Years of Discovery with FUSE, ed. G. Sonneborn, H. Moos, & B-G Andersson (San Francisco, CA: ASP) 58
- Draine & Li (2001) Draine, B. T., & Li, A. 2001, ApJ, 551, 807
- Ehrenfreund et al. (1996) Ehrenfreund, P., Boogert, A. C. A., Gerakines, P. A., et al. 1996, A&A, 315, L341
- Epstein et al. (1976) Epstein, R. I., Lattimer, J. M., & Shramm, D. N. 1976, Nature, 264, 198
- Geballe et al. (1989) Geballe, T. R., Tielens, A. G. G. M., Allamandola, L. J., Moorhouse, A., & Brand, P. W. J. L. 1989, ApJ, 341, 278
- Gerakines et al. (1999) Gerakines, P. A., Whittet, D. C. B., Ehrenfreund, P., et al. 1999, ApJ, 522, 357
- Gibb et al. (2004) Gibb, E. L., Whittet, D. C. B., Boogert, A. C. A., & Tielens, A. G. G. M. 2004, ApJS, 151 35.
- Hudgins et al. (1994) Hudgins, D. M., Sandford, S. A., & Allamandola, L. J. 1994, J. Phys. Chem., 98, 4243
- Hudgins et al. (2004) Hudgins, D. M., Bauschlicher, C. W., Jr., & Sandford, S. A. 2004, ApJ, 614, 770
- Jura (1982) Jura, M. 1982, in Advances in UV Astronomy: 4 Years of IUE Research, ed. Y. Kondo, J. M. Mead, & R. D. Chapman (NASA CP 2238: Greenbelt MD: NSAS), 54
- Kaneda et al. (2009) Kaneda, H., Koo, B. C., Onaka, T., & Takahashi, H. 2009, PASJ, 59, S401
- Lee et al. (2011) Lee, H.-G., Moon, D.-S., Koo, B.-C., et al. 2011, ApJ, 740, 31
- Leger & Puget (1984) Leger, A., & Puget, J. L. 1984, A&A, 137, L5
- Linsky et al. (2006) Linsky, J. L. Draine, B. T., Moos, H. W., et al. 2006, ApJ, 647, 1106
- Mattila et al. (1996) Mattila, K., Lemke, D., Haikala, L. K., et al. 1996, A&A, 315, L353
- Mazzitelli & Moertti (1980) Mazzitelli, I., & Moretti, M. 1980, ApJ, 235, 955
- Messenger (2002) Messenger, S. 2011, Planet. Space Sci., 50, 1221
- Mori et al. (2012) Mori, T. I., Sakon, I., Onaka, T., et al. 2012, ApJ, 744, 68
- Mori et al. (2013) Mori, T. I., Onaka, T., Sakon, I., Ishihara, D., Shimonishi, T., & Bell, A. C. 2013, ApJ, submitted
- Murakami et al. (2007) Murakami, H., Baba, H., Barthel, R., et al. 2007, PASJ, 59, S369
- Nummelin et al. (2001) Nummelin, A., Whittet, D. C. B., Gibb, E. L., Gerakines, P. A., & Chiar, J. E. 2001, ApJ, 558, 185
- Ohyama et al. (2007) Ohyama, Y., Onaka, T., Matsuhara, H., et al. 2007, PASJ, 59, S411
- Onaka et al. (1996) Onaka, T., Yamamura, I., Tanabé, T., Roellig, T. L., & Yuen, L. 1996, PASJ, 48, L59
- Onaka et al. (2007) Onaka, T., Matsuhara, H., Wada, T., et al. 2007, PASJ, 59, S401
- Onaka et al. (2010) Onaka, T., Matsuhara, H., Wada, T., et al. 2010, Proc. SPIE, 7731, 77310M
- Peeters et al. (2004) Peeters, E., Allamandola, L. J., Bauschlicher, C. W., Jr., et al. 2004, ApJ, 604, 252
- Pendleton & Allamandola (2002) Pendleton, Y. J., & Allamandola, L. J. 2002, ApJS, 138, 75
- Pettini & Cooke (2012) Pettini, M., & Cooke, R. 2012, MNRAS, 425, 2477
- Pettini et al. (2008) Pettini, M., Zych, B. J., Murphy, M. T., Lewis, A., & Steidel, C. C. 2008, MNRAS, 391, 1499
- Prodanović et al. (2010) Prodanović, T., Steigman, G., & Fields, B. D. 2010, MNRAS, 406, 1108
- Romano et al. (2006) Romano, D., Tosi, M., Chiappini, C., & Matteucci, F. 2006, MNRAS, 369, 295
- Shimonishi et al. (2010) Shimonishi, T., Onaka, T., Kato, D., et al. 2010, A&A, 514, A12
- Storey & Hummer (1995) Storey, P. J., & Hammer, D. G. 1995, MNRAS, 272, 41
- Tielens (1997) Tielens, A. G. G. M. 1997, in AIP Conf. Proc. 402, Astrophysical Implications of the Laboratory Study of Presolar Materials, ed. T. H. Bernatowicz and E. K. Zinner (New York: AIP), 523
- Tielens (2008) Tielens, A. G. G. M. 2008, ARA&A, 46, 289
- Tosi (2010) Tosi, M. 2010, in Proc. of IAU Symp. 268, LIght Elements in the Universe, ed., C.Charbonnel, M. Tosi, F. Primas & C. Chiappini, 153
- Tsujimoto (2011) Tsujimoto, T. 2011, MNRAS, 410, 2540
- Tsumura et al. (2013) Tsumura, K., Matsumoto, T., Matsuura, S., et al. 2013, PASJ, in press (arXiv:1307.6736)
- van den Ancker et al. (2000) van den Ancker, M. E., Tielens, A. G. G. M., & Wesselium, P. R. 2000, A&A, 358. 1035
- Verstraete et al. (1996) Verstraete, L., Puget, J. L., Falgarone, E., et al. 1996, A&A, 315, L337
| Source | Slit | (J2000.0) | (J2000.0) | Pointing ID | Observation date |
|---|---|---|---|---|---|
| Orion Bar | Ns | 5h35m19.8s | -05°25′142 | 1420483.1 | 2008 September 14 |
| Nh | 5h35m13.0s | -05°25′196 | 1420483.1 | 2008 September 14 | |
| M17 | Ns | 18h20m23.6s | -16°12′232 | 1420484.1 | 2008 September 27 |
| Nh | 18h20m30.3s | -16°12′198 | 1420484.1 | 2008 September 27 | |
| G18.14.0 | Ns | 18h16m58.6s | -19°47′300 | 1420707.1 | 2009 March 23 |
| Identification | Wavelength (m) | Remarks |
|---|---|---|
| H I Br | 2.6259 | blended with H I Pf13 |
| H2 10 O(2) | 2.6269 | marginally seen in H18.14.0 |
| H I Pf13 | 2.6751 | blended with H I Br and not separately seen in the present spectra |
| H I Pf12 | 2.7583 | |
| H2 10 O(3) | 2.8031 | marginally seen in H18.14.0 |
| H I Pf | 2.8730 | |
| H2O ice | 2.73.3 | absorption feature |
| H2 10 O(4) | 3.0039 | marginally seen in H18.14.0 |
| H IPf | 3.0392 | |
| PAH band | 3.29 | blended with H I Pf |
| PAH band | 3.41 | |
| PAH band | 3.48 | multicomponent (Geballe et al., 1989) |
| H I Pf | 3.2970 | blended with the PAH 3.29 m and not separately seen in the present spectra |
| H I Pf | 3.7406 | |
| H2 00 S(13) | 3.8468 | |
| H2 00 S(12) | 3.9947 | blended with H I Br and not separately seen in the present spectra |
| H I Hu14 | 4.0209 | blended with H I Br and not separately seen in the present spectra |
| H I Br | 4.0523 | blended with H2 0-0 S(12) and H I Hu14 |
| H I Hu13 | 4.1708 | blended with H2 00 S(11) |
| H2 00 S(11) | 4.1813 | blended with H I Hu13 |
| CO2 ice | 4.27 | absorption feature |
| He I () | 4.2954 | |
| H I Hu12 | 4.3765 | blended with H2 00 S(10) |
| H2 00 S(10) | 4.4099 | blended with H I Hu12 |
| H I Pf | 4.6538 | blended with H I Hu and H2 00 S(9) |
| H I Hu | 4.6725 | blended with H I Pf and H2 00 S(9) |
| H2 00 S(9) | 4.6946 | blended with Pf and H I Hu |
| Excessaain units of Wm-2arcsec-2. | PAH bandaain units of Wm-2arcsec-2. | H I Braain units of Wm-2arcsec-2. | Excess/PAH bandbbThe excess to PAH band intensity ratio. ‘Aromatic’ and ‘aliphatic’ indicate the ratio of the 4.4 m excess to the 3.29 m band intensities, and that of the 4.65 m to the m band intensities, respectively, and ‘total’ shows the ratio of summation of the aromatic and aliphatic band intensities (see text). | |||||
|---|---|---|---|---|---|---|---|---|
| Object | 4.4 m | 4.65 m | 3.29 m | 3.42 + 3.48 m | aromatic | aliphatic | total | |
| Orion Bar | ||||||||
| M17 | ||||||||
| G18.14.0 | — | |||||||