Multi-epoch VLBA H2O maser observations toward the massive YSOs AFGL 2591 VLA 2 and VLA 3
Abstract
We present multi-epoch Very Long Baseline Array (VLBA) H2O maser observations toward the massive young stellar objects (YSOs) VLA 2 and VLA 3 in the star-forming region AFGL 2591. Through these observations, we have extended the study of the evolution of the masers towards these objects up to a time span of 10 yrs, measuring their radial velocities and proper motions. The H2O masers in VLA 3, the most massive YSO in AFGL 2591 ( 30–40 M⊙), are grouped within projected distances of 40 mas ( 130 AU) from VLA 3. In contrast to other H2O masers in AFGL 2591, the masers associated with VLA 3 are significantly blueshifted (up to 30 km s-1) with respect to the velocity of the ambient molecular cloud. We find that the H2O maser cluster as a whole, has moved westwards of VLA 3 between the 2001 and 2009 observations, with a proper motion of 1.2 mas yr-1 ( 20 km s-1). We conclude that these masers are tracing blueshifted outflowing material, shock excited at the inner parts of a cavity seen previously in ammonia molecular lines and infrared images, and proposed to be evacuated by the outflow associated with the massive VLA 3 source. The masers in the region of VLA 2 are located at projected distances of 0.7′′ ( 2300 AU) north from this source, with their kinematics suggesting that they are excited by a YSO other than VLA 2. This driving source has not yet been identified.
keywords:
ISM: individual (AFGL 2591) — ISM: jets and outflows — masers — stars: formation1 Introduction
AFGL 2591, located at a distance of 3.3 kpc (Rygl et al. 2012), is one of the most extensively studied and more luminous high-mass star forming regions (e.g., van der Tak et al. 2006; Jiménez-Serra et al. 2012; Sanna et al. 2012; Johnston et al. 2013; Trinidad et al. 2013). It contains several massive young stellar objects (YSOs) over a region of 6′′ ( 0.1 pc) detected at infrared and radio continuum wavelengths (VLA 1, VLA 2, and VLA 3), but completely obscured at optical wavelengths (e.g., Campbell 1984; Trinidad et al. 2003). Water maser emission, which is one of the first observed signposts of high-mass star formation, has been detected toward VLA 2, VLA 3, and 0.5′′ ( 1650 AU) north of VLA 3 (Tofani et al. 1995; Trinidad et al. 2003). Very recent works by Sanna et al. (2012) and Trinidad et al. (2013) show that the cluster of masers observed to the north of VLA 3 (named as VLA 3-N) is formed by two bow shocks separated by 0.1′′ ( 330 AU), and moving away from each other with velocities of 20 km s-1. These authors conclude that in between the two bow shocks lie one or two still unseen YSO(s) driving the H2O masers.
VLA 3 is probably the most massive object ( 30–40 M⊙) dominating the infrared and mm wavelength emission in the AFGL 2591 star-forming region (Tofani et al. 1995; Doty et al. 2002; Stäuber et al. 2005; Jiménez-Serra et al. 2012; Sanna et al. 2012). VLA 3 is embedded within a high-density ( 106 cm-3), hot ( 200 K) core as observed in dust continuum and different molecular species (van der Tak 1999; Jiménez-Serra et al. 2012). The molecular core shows a chemical segregation (Jiménez-Serra et al. 2012), with species like H2S and 13CS peaking close ( 0.2′′, or 600 AU) to the massive YSO, and species like HC3N, OCS, SO2, SO, and CH3OH peaking at larger distances ( 0.4′′, or 1100 AU). Jiménez-Serra et al. (2012) modelled these results through the combination of molecular UV photodissociation and high-temperature gas-phase chemistry within a molecular region of 600 AU radius, with an innermost cavity of 120 AU radius around the central massive object. The presence of a cavity extending westwards of VLA 3 has also been inferred from ammonia molecular lines and near and mid-infrared data, showing in particular an IR-loop with the YSO at one edge (Forrest & Shure 1986; Torrelles et al. 1989; Preibisch et al. 2003). It is believed that this cavity has been evacuated by the extended east-west bipolar outflow associated with VLA 3 and seen in CO and H2, with the blueshifted outflowing molecular gas found westwards of VLA 3 (Mitchell et al. 1992; Tamura & Yamashita 1992).
Very Long Baseline Interferometry (VLBI) techniques for observing H2O maser emission allow the study of the three-dimensional velocity distribution (proper motions and radial velocity) of the masing gas very close to the massive YSOs, with an angular resolution better than 1 mas (e.g., Goddi et al. 2006; Torrelles et. al. 2011; Chibueze et al. 2012; Kim et al. 2013). Sanna et al. (2012) carried out multi-epoch VLBI H2O maser observations in 2008-2009, revealing the kinematics of the masers toward AFGL 2591 VLA 3. These observations indicate that the masers trace the edges of a blueshifted expanding cavity created by an outflow from the central massive object.
In this work we present Very Long Baseline Array (VLBA) H2O maser observations toward the high-mass star forming region of AFGL2591 obtained in 2001-2002 over three epochs, with an angular resolution of 0.45 mas (Section 2). As part of these observations, we have already presented and discussed in a previous paper the results obtained toward AFGL2591 VLA 3-N (Trinidad et al. 2013; hereafter Paper I). We now concentrate on the spatio-kinematical distribution of the cluster of masers detected toward the massive objects AFGL2591 VLA 2 and VLA 3, extending the study of the evolution of these masers from 1999 (VLA data; Trinidad et al. 2003), 2001-2002 (VLBA data; this paper), to 2008-2009 (VLBA data; Sanna et al. 2012), covering a time span of 10 years of their evolution (Section 3). The main conclusions of our studies are presented in Section 4.
2 Observations
The – H2O maser transition (rest frequency = 22235.08 MHz) was observed with the VLBA of the National Radio Astronomy Observatory (NRAO)111The NRAO is a facility of the National Science Foundation operated under cooperative agreement by Associated Universities, Inc. toward AFGL 2591 at three epochs, 2001 December 2, 2002 February 11, and 2002 March 5. A bandwidth of 8 MHz sampled over 512 channels (spectral resolution of 15.625 kHz = 0.21 km s-1) and centred on km s-1 was used, covering a radial velocity range from km s-1 to 46 km s-1. A full description of the set-up of the VLBA observations, amplitude and phase calibration of the observed visibilities, and further imaging of the maser emission using the NRAO Astronomical Image Processing System (AIPS) package are extensively explained in our previous Paper I.
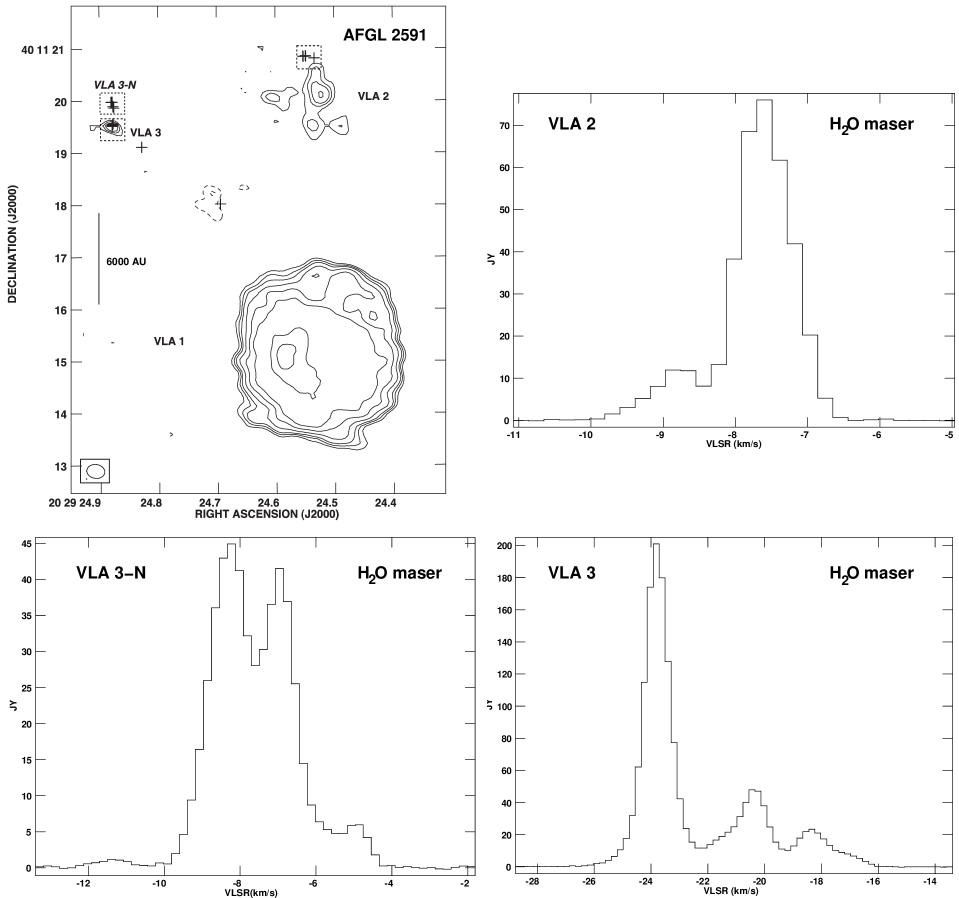
Several clusters of masers were detected in the three epochs of VLBA observations with a beam of 0.45 mas toward VLA 2, VLA 3, and 0.5′′ north of VLA 3 (named as VLA 3-N after Paper I). As a reference, in Figure 1 we show a 3.6 cm wavelength continuum contour map of the sources in the region obtained with the Very Large Array (Trinidad et al. 2003). In Figure 1 we also show the H2O maser spectra observed with the VLBA toward VLA 2, VLA 3, and VLA 3-N in 2001 December 02 (the spectra observed with the VLBA in the two other epochs are similar to those shown here for the first epoch). The H2O maser emission in all the AFGL 2591 region spans a radial velocity range from to km s-1. More specifically, the H2O maser emission is detected in the radial velocity ranges from to 6 km s-1 in VLA 2, 31 to km s-1 in VLA 3, and to km s-1 in VLA 3-N (see Figure 1). The rms noise level of the images is in the range of mJy beam-1 (channels without emission) to 300 mJy beam-1 (channel with the strongest emission, 196 Jy beam-1 at km s-1).
We determined the position, intensity, and radial velocity of all the maser spots in the region for the three observed epochs by means of two-dimensional elliptical Gaussian fits. We refer to a maser spot as emission that appears at a given velocity channel with a signal-to-noise (S/N) ratio 8 and with a distinct spatial position for a particular epoch. The 1 accuracy in the relative positions of the maser spots at each epoch is better than 0.01 mas, estimated from the S/N ratio of the maser spots and the beam size (Meehan et al. 1998). From these maser spots, we then identified maser features in each of the observed epochs for proper motion measurements. Here we refer to a maser feature as a group of maser spots coinciding simultaneously in both, position within a beam size of 0.5 mas, and radial velocity within 1 km s-1.
We chose an isolated maser spot, with a point-like morphology and high intensity ( 10 Jy) in all our three observed epochs to self-calibrate the data and to obtain a first and preliminary coordinate alignment between the three epochs. This maser, with km s-1 and associated with VLA 3, has absolute coordinates (J2000.0) = 20h29m24.879s, (J2000.0) = 40∘11′19.47′′ ( 0.01′′). The procedure to align our set of VLBA epochs with the data set of Sanna et al. (2012) (epoch 2008-2009) is explained with detail in Paper I, and a brief summary is given here. We identified a maser clearly persisting in the two sets of data (maser S17 listed by Sanna et al. 2012, which has a relatively small proper motion, and identified in our data set as maser ID28, as listed in Table 1 of Paper I). Then, we corrected the positions of the maser ID28 as a function of time (and therefore to all our data set of 2001-2002), assigning them to the expected locations of the maser S17, from a extrapolation of its position and proper motions (Sanna et al. 2012), assuming that it has moved with constant velocity through the time span of 7 yr. As mentioned in Paper I, the fact that after this alignment, the whole maser structure observed in epochs 2001-2002 in VLA 3-N (formed by two bow shocks separated by 0.1′′) is within that reported by Sanna et al. (2012) (epochs 2008-2009), and that the estimated shift in position of our observed masers in VLA 3-N for a time span of seven years coincide with the angular separation between the structures observed in 2001-2002 and those of 2008-2009, gave this alignment an additional measure of robustness.
All the offset positions of the maser features shown in the different figures of this paper (Figures 2–5) are relative to the maser spot position (0,0) used for self-calibrating the data of the first epoch of our VLBA observations ((J2000.0) = 20h29m24.879s, (J2000.0) = 40∘11′19.47′′ ( 0.01′′). As mentioned above, this reference maser is associated with VLA 3, which has a 3.6 cm continuum peak position RA (J2000) = , DEC (J2000) = (Trinidad et al. 2003).
In the following Section 3 we present the spatio-kinematical distribution of the H2O masers associated with VLA 2 and VLA 3. The results on VLA 3-N were presented and discussed in Paper I.
3 Results and discussion
3.1 AFGL 2591 VLA 3
VLA 3, detected at infrared (Tamura et al. 1991; de Wit et al. 2009), mm (van der Tak et al. 1999; Jiménez-Serra et al. 2012), and cm wavelengths (Campbell 1984; Trinidad et al. 2003; van der Tak & Menten 2005), is believed to be the most massive and young object in the AFGL 2591 star-forming region (Jiménez-Serra et al. 2012; Sanna et al. 2012). This source is elongated east-west at cm continuum wavelengths, suggesting the presence of an ionised wind driving the east-west bipolar molecular outflow observed at large scales ( arcminutes; Mitchell et al. 1992; Tamura & Yamashita 1992; Trinidad et al. 2003; van der Tak & Menten 2005; Sanna et al. 2012; Johnston et al. 2013). The source is deeply embedded in a hot core (visual extinction AV 20 mag), with molecular gas exhibiting signatures of Keplerian motions consistent with a mass of 40 M⊙ of the central object (van de Wiel et al. 2011; Jiménez-Serra et al. 2012).
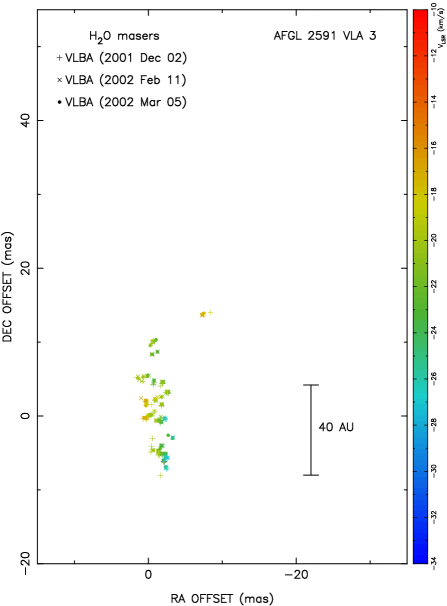
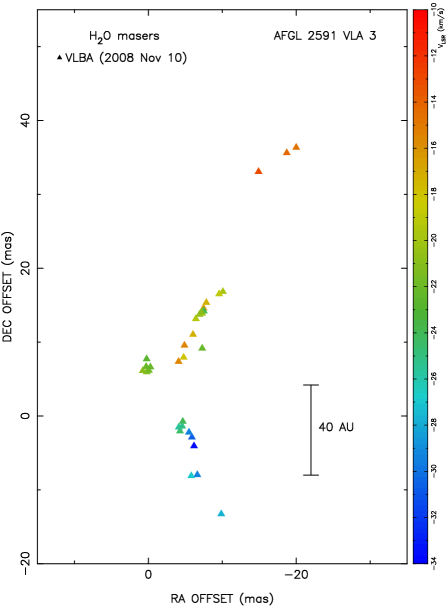
We detected a cluster of masers associated with VLA 3 in our three epochs of VLBA observations (2001 Dec 02, 2002 Feb 11, and 2002 Mar 05). The cluster is extended north-south over a scale of 20 mas ( 66 AU), with a few features detected to the north-west. In Figure 2 we show the positions of the maser features together with their LSR radial velocity (colour scale) for our three epochs of VLBA observations. All the velocities of the maser emission associated with VLA 3 ( 31 to km s-1) are considerably blueshifted with respect to the systemic velocity of the ambient molecular gas of the AFGL 2591 star-forming region ( to km s-1; van der Tak et al. 1989; Jiménez-Serra et al. 2012). This behaviour differs significantly from that of the H2O maser emission toward VLA 2 and VLA 3-N, where their velocities do not have such large blueshifted components ( to 6 km s-1 in VLA 2, and to km s-1 in VLA 3-N; see H2O maser spectra of these regions shown in Figure 1). The large blueshifted components in the maser emission associated with VLA 3 were also seen in 1999 (VLA data; Trinidad et al. 2003) and 2008-2009 (VLBA data; Sanna et al. 2012), although the maser emission detected in the 1999 and 2008-2009 epochs is found over a somewhat more extended region ( 40 mas) than ours. This is shown in Figure 2, where we also plot the positions and radial velocities of the H2O maser features detected in 1999 (Trinidad et al. 2003) and 2008-2009 (Sanna et al. 2012). The predominance of blueshifted (as opposed to redshifted) maser outflows has been discussed recently by Caswell & Phillips (2008), who conclude that the mechanism responsible needs further exploration. Motogi et al. (2013) propose a disc-masking scenario as the origin of the strong blue-shift dominance, where an optically thick disc obscures a red-shifted lobe of a compact jet. In the case of VLA 3, the blueshift predominance could be due to the fact that the free-free continuum appears to be optically thick at 22 GHz (Trinidad et al. 2003).
The spatial alignment between our three epochs of VLBA H2O maser observations and the VLBA observations from Sanna et al. (2012) was well determined for proper motion measurements between these two set of data, and has been extensively explained in our Paper I. The alignment with the VLA data shown in Figure 2 (top left panel) was made by matching the centre of the cluster of masers observed with the VLA (epoch 1999 June 29) with the centre of the cluster observed with the VLBA in the closest epoch (2001 December 02). However, this geometrical centre may have suffered a spatial displacement between these two epochs due to proper motions of the masers. For this reason, we emphasise that the VLA maser alignment with the VLBA data shown in all figures of this paper is only valid for a qualitative comparison of the different data sets, but not for detailed studies of the proper motions.
 |
 |
 |
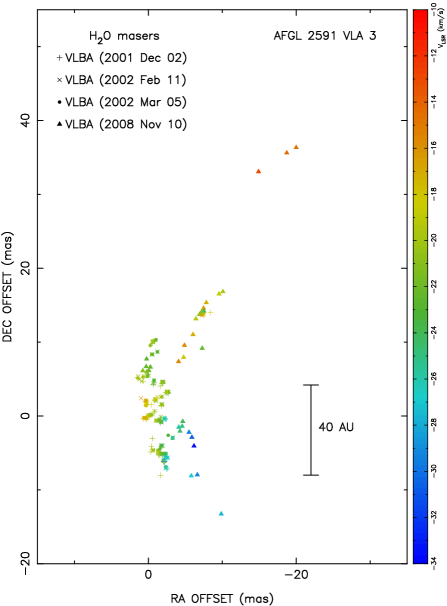 |
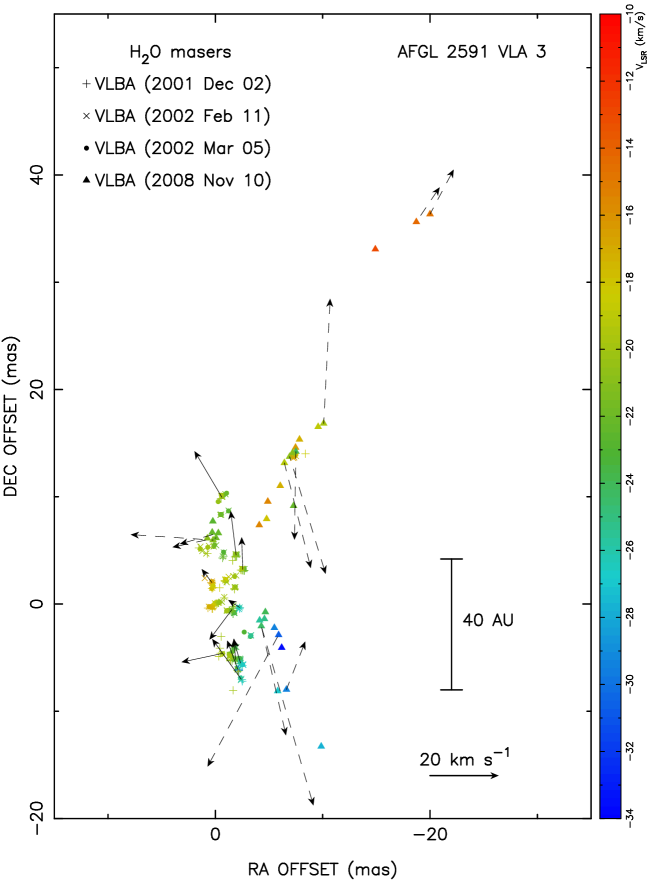
From Figure 2 we see that there is a displacement of the H2O maser structure as a whole toward the west between the 2001-2002 and 2008-2009 epochs. The observed displacement of 9 mas corresponds to a proper motion of 1.2 mas yr-1 ( 20 km s-1) in a time span of seven years. On the other hand, from about 80 H2O maser features that we have found in each of our three observed epochs (2001-2002), we have only been able to identify 11 maser features that persist in the three epochs to measure their individual proper motions. With persisting masers we refer to those having similar positions (within a few mas) and radial velocities (within 12 km s-1) in the three different observed epochs. The resulting proper motions of these 11 persisting maser features are shown in Figure 3 with solid arrows. In Figure 3 we also show the proper motion vectors of 13 H2O maser features measured by Sanna et al. (2012) for epochs 2008-2009 (dashed arrows). We have not been able to identify any individual maser feature persisting from epochs 2001-2002 to 2008-2009 epochs (in contrast to what we find in VLA 3-N, with individual maser features persisting over seven years; Paper I). The magnitudes of the individual proper motions of the maser features range from 0.5 to 3.6 mas yr-1 ( 8 to 60 km s-1). However, we find that these vectors do not show a preferential motion direction in the sky. This indicates that while the whole structure of masers is moving westwards, within it there are individual H2O masers moving in a chaotic way, with a very short lifetime in comparison to the scale of seven years, when the motion of the full structure becomes apparent. This would be consistent with the fact that only a small percentage of the maser features identified in the region have been found to persist in our three consecutive epochs of observations, implying lifetimes for most of them of 3 months (see also below).
Sanna et al. (2012) identified in their VLBA data (epochs 2008-2009) a V-shaped structure of the H2O maser distribution opening toward the west, with its vertex close to the peak of the radio continuum emission of VLA 3 (position in Figure 2; bottom left panel). This structure is not observed in our VLBA observations (2001-2002), where the cluster of masers is concentrated closer to VLA 3 (see Figure 2; top right panel). However, we think that the V-shaped structure is not a new structure that has appeared after a time span of seven years. In fact, the VLA H2O maser observations by Trinidad et al. (2003) also shows signs that it was already there in 1999, as indicated by the masers detected then with positions ( mas, +35 mas) and radial velocities 11 km s-1 (see Figure 2; top left panel). These masers have similar positions and velocities than the VLBA masers of epochs 2008-2009 that constitute the northern part of the V-shaped structure (see Figure 2; bottom left panel). We therefore think that the absence of the V-shaped structure in the 2001-2002 epochs is just due to the well known high time variability of the flux density of the H2O masers.
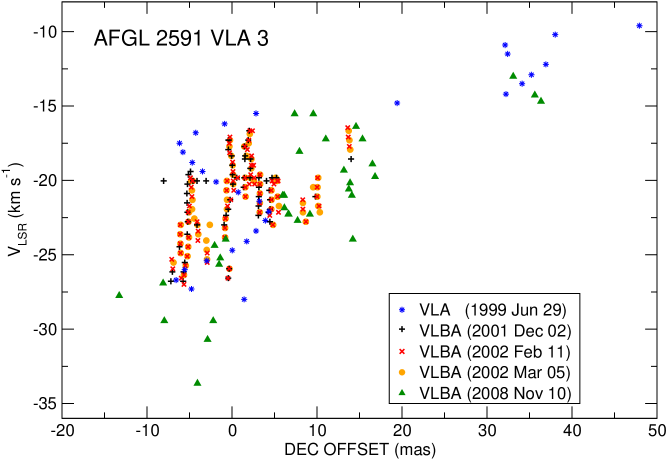
An additional, important result is that the masers in all the observed epochs present a radial velocity gradient from north to south, from 12 km s-1 (northern regions) to 30 km s-1 (southern regions), as shown in Figure 4. This velocity gradient ( 0.12 km s-1 AU-1) was also noticed by Trinidad et al. (2003) and Sanna et al. (2012) in their respective epochs of observations, although by combining all the masers detected in all the epochs as shown in Figure 4, this gradient is seen more clearly. However, we notice that the VLBA data do not show the peculiar velocity-position helical distribution seen with the VLA in 1999 (Trinidad et al. 2003).
The large values of the velocities that we find in the H2O masing region of VLA 3 with respect to the ambient cloud velocity, with total velocities (tangential + radial velocities) 40 km s-1, indicate that the masers are tracing outflowing material. In fact, the central mass required to gravitationally bind these motions would exceed 200 M⊙, which is not observed. The westward proper motion of the whole H2O maser structure associated with VLA 3, in a time span of seven years (Figure 2), together with their large blueshifted velocities with respect to the ambient local medium, suggest a physical relationship between the masers and the blueshifted motions of the large-scale outflow seen in CO and H2, found also toward the west (Mitchell et al. 1992; Tamura & Yamashita 1992). Furthermore, the H2O masers are spatially distributed within a region of 40 mas around the radio continuum emission peak of VLA 3 (Figures 1 and 2), which is located at the edge of the cavity observed through molecular lines and infrared images extending 10′′ ( 3.3103 AU) toward the west (Forrest & Shure 1986; Torrelles et al. 1989; Preibisch et al. 2003). Due to all this, we propose that the H2O masers are tracing the inner parts of the molecular walls of that cavity, very close ( 130 AU) to the massive YSO, and shock excited and evacuated by the east-west outflow, marking a strong interaction between the outflowing gas from VLA3 and the surrounding molecular gas (the H2O maser emission would occur behind shocks propagating in dense regions; Hollenbach, Elitzur, & McKee 2013). This strong interaction could also contribute to the high temperatures observed toward VLA 3 ( 200 K) and measured through ammonia emission (Torrelles et al. 1989).
A rough estimate of upper limits for the coherent path of the maser emission could be derived if we assume unsaturated tubular masers with beaming angles , where and are the maser transverse and longitudinal sizes, respectively (e.g., Vlemmings et al. 2006; Surcis et al. 2011; Hollenbach et al. 2013). As pointed out by Hollenbach et al. (2013), beaming angles themselves are unmeasurable and can only be inferred indirectly using different approaches. In this sense, Vlemmings et al. (2006) and Surcis et al. (2011), through polarisation measurements of the H2O maser emission and using full radiative transfer codes (based on the models for H2O masers of Nedoluha & Watson 1992), obtain beaming angles 10-2 0.5 in different high-mass star-forming regions. Assuming these beaming angles, and a transverse size 0.45 mas ( 1.5 AU, unresolved masers) we obtain a path length 15 AU. Considering that the size of the cavity in VLA 3 is 3.3103 AU, we think that the cavity walls could have enough thickness to provide such a path of coherent velocities (see also Uscanga et al. 2005).
As mentioned above, all the data available and presented in this work reveal a radial velocity gradient in the H2O masers along the north-south direction, with higher blueshifted velocities to the south with respect to the velocity of the ambient molecular gas (Figure 4). Interestingly, Tamura & Yamashita (1992) also find an extinction gradient along the north-south direction of the IR-loop delineating the cavity of VLA 3 (Forrest & Shure 1986), with a higher extinction in the north part of the IR-loop. We think that this north-south asymmetry, with a lower amount of gas to the south relative to the north, could produce higher expansion velocities to the south due to the interaction of outflowing material from VLA 3 with this non-uniform ambient medium, explaining in this way the observed radial velocity gradient in the masers. However, we cannot rule out other effects that could produce the observed north-south velocity gradient in the H2O masers (e.g., shock-excited ambient molecular gas accelerated by a wind from a precessing source, as suggested by Trinidad et al. 2003).
3.2 AFGL 2591 VLA 2
We detected H2O maser emission toward VLA 2 in our three epochs of VLBA observations. The VLBA H2O maser observations reported by Sanna et al. (2012) did not cover the region of VLA 2, so unfortunately in this case we are not able to extend the study of the evolution of the masers beyond our epochs of 2001-2002, as it was done in the case of VLA 3 (Section 3.1).
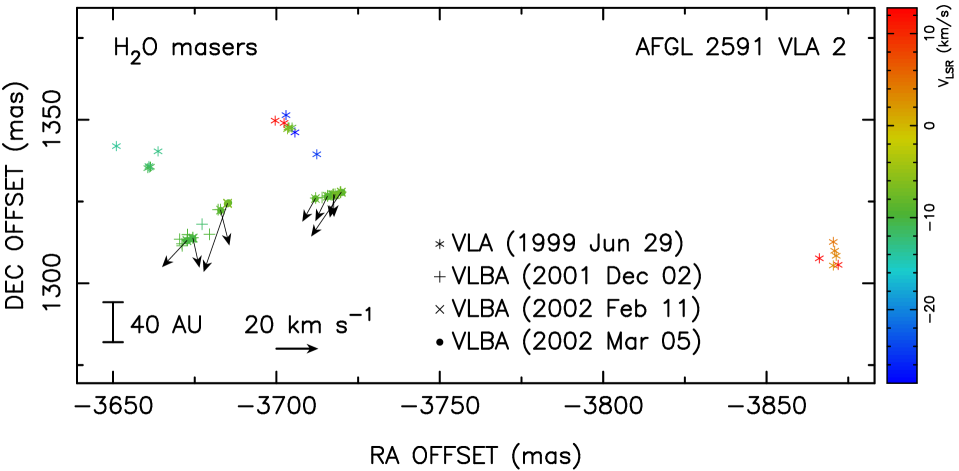
In Figure 5 we show the positions of the H2O maser features together with their proper motions as measured with our VLBA observations. The detected H2O masers are located 0.7′′ ( 2300 AU) north from the peak position of the 3.6 cm continuum emission of VLA 2. The proper motions of the H2O masers are toward the south, with values of 20–40 km s-1. We identify the clusters of masers detected with the VLBA with those found with the VLA in 1999 (see Figures 5 and 1).
The radio continuum emission of VLA 2 is consistent with a partially optically thick HII region excited by an early B-type star (Trinidad et al. 2003). The lack of any symmetry in the spatio-kinematical distribution of the H2O masers detected in this region, together with the lack of additional physical information on the characteristics of VLA 2 (e.g., there is no apparent outflow activity associated with this source), makes difficult to establish a firm conclusion on a possible H2O maser-VLA 2 physical association. A possibility would be that the H2O masers moving southwards are tracing infalling gas motions around VLA 2, but this would require a central mass of 103 M⊙ to bind motions of 20 km s-1 at distances of 2300 AU. This is the reason why we rather favour that the observed H2O masers in this region are excited by a nearby YSO that has yet to be identified. We think that new high-sensitive cm and (sub)mm wavelength continuum observations in the region could clarify this issue.
4 Conclusions
We present and analyse multi-epoch VLBA H2O maser observations toward the massive YSOs AFGL 2591 VLA 2 and VLA 3. By comparing our data with those previously reported by Trinidad et al. (2003) and Sanna et al. (2012), we have extended the study of the kinematics of the H2O masers in these two regions up to a time span of 10 yrs. The cluster of masers found within 40 mas ( 130 AU) from the most massive object in this star-forming region, VLA 3 ( 30–40 M⊙), is significantly blueshifted with respect to the ambient molecular cloud, and moving as a whole toward the west of VLA 3 with a proper motion of 20 km s-1. VLA 3 and its associated H2O masers are located at the edge of a cavity of 10′′ size extending toward the west and seen previously through ammonia lines and infrared images. We propose that the masers are tracing blueshifted outflowing material, shock excited at the inner parts of that cavity evacuated by the outflow of VLA 3. This interpretation is fully consistent with the one proposed previously by Sanna and collaborators. In addition, we find a radial velocity gradient in the H2O masers along the north-south direction, with higher blueshifted velocities to the south. We interpret this radial velocity gradient as due to the decrease of the amount of gas to the south, needed to explain the observed lower extinction in the southern parts.
On the other hand, the spatio-kinematical distribution of the H2O masers in the region of VLA 2 favours that these masers are excited by a YSO other than VLA 2. Future, sensitive radio continuum observations could help to discover this new driving source, as well as the exciting source of the VLA 3-N system (Sanna et al 2012; Trinidad et al. 2013).
Acknowledgments
We would like to thank our referee for the very useful report on our manuscript. We also acknowledge Wouter Vlemmings and Moshe Elitzur for very helpful comments. GA, CC-G, RE, JFG, and JMT acknowledge support from MICINN (Spain) AYA2008-06189-C03 and AYA2011-30228-C03 grants (co-funded with FEDER funds). JC and ACR acknowledge support from CONACyT grant 61547. SC acknowledges the support of DGAPA, UNAM, CONACyT (México) and CSIC (Spain). LFR acknowledges the support of DGAPA, UNAM, and of CONACyT (México). MAT acknowledges support from CONACyT grant 82543. RE and JMT acknowledge support from AGAUR (Catalonia) 2009SGR1172 grant. JMT acknowledges the hospitality offered by the Science Operations Center of the NRAO (Socorro, NM; USA) where part of the data reduction was carried out (June-July, 2013). The ICC (UB) is a CSIC-Associated Unit through the ICE (CSIC).
References
- Campbell (1984) Campbell B. 1984, ApJ, 287, 334
- Caswell & Phillips (2008) Caswell J. L., Phillips C. J. 2008, MNRAS, 386, 1521
- Chibueze et al. (2012) Chibueze J. O., Imai H., Tafoya D., Omodaka T., Kameya O., Hirota T., Chong S., Torrelles J. M. 2012, ApJ, 748, 146
- de Wit et al. (2009) de Wit W. J., Hoare M. G., Fujiyoshi T. et al. 2009, A&A, 494, 157
- Doty et al. (2002) Doty S. D., van Dishoeck E. F., van der Tak F. F. S., Boonman A. M. S. 2002, A&A, 389, 446
- Forrest & Shure (1986) Forrest W. J., Shure M. A. 1986, ApJ, 311, L81
- Goddi et al. (2006) Goddi C., Moscadelli L., Torrelles J. M., Uscanga L., Cesaroni R. 2006, A&A, 447, L9
- Hollenbach et al. (2013) Hollenbach D., Elitzur M., McKee C. F. 2013, ApJ, 773, 70
- Jiménez-Serra et al. (2007) Jiménez-Serra I., Martín-Pintado J., Rodríguez-Franco A., Chandler C., Comito C., Schilke P. 2007, ApJ, 661, L187
- Jiménez-Serra et al. (2012) Jiménez-Serra I., Zhang Q., Viti S., Martín-Pintado J., de Wit W.-J. 2012, ApJ, 753, 34
- Johnston et al. (2013) Johnston K. G., Shepherd D. S., Robitaille T. P., Wood K. 2013, A&A, 551, A43
- Kim et al. (2013) Kim J-S., Kim S-W., Kurayama T., Honma M., Sasao T., Surcis G., Cantó J., Torrelles J. M., Kim S. J. 2013, ApJ, 767, 86
- Meehan et al. (1998) Meehan L. S. G., Wilking B. A., Claussen M. J., Mundy L. G., Wootten A. 1998, AJ, 115, 1599
- Mitchell et al. (1992) Mitchell G. F., Hasegawa T. I., Schella J. 1992, ApJ, 386, 604
- Motogi et al. (2013) Motogi K., Sorai K., Niinuma K., et al. 2013, MNRAS, 428, 349
- Nedoluha & Watson (1992) Nedoluha G. E., Watson W. D. 1992, ApJ, 384, 185
- Preibisch et al. (2003) Preibisch T., Balega Y. Y., Schertl D., Weigelt G. 2003, A&A, 412, 735
- Rygl et al. (2012) Rygl K. L. J., Brunthaler A., Sanna A., Menten K. M., Reid M. J., van Langevelde H. J., Honma M., Torstensson K. J. E., Fujisawa K. 2012, A&A, 539, 79
- Sanna et al. (2012) Sanna A., Reid M. J., Carrasco-González C., Menten K. M., Brunthaler A., Moscadelli L., Rygl K. L. J. 2012, ApJ, 745, 191
- Stäuber et al. (2005) Stäuber P., Doty S. D., van Dishoeck E. F., Benz A. O. 2005, A&A, 440, 949
- Surcis et al. (2011) Surcis G., Vlemmings W. H. T., Torres, R. M., van Langevelde H. J., Hutawarakorn Kramer, B. 2011, A&A, 533, A47
- Tamura et al. (1991) Tamura M., Gatley I., Joyce R. R., Ueno M., Suto H., Sekiguchi M. 1991, ApJ, 378, 611
- Tamura & Yamashita (1992) Tamura M., Yamashita T. 1992, ApJ, 391, 710
- Tofani et al. (1995) Tofani G., Felli M., Taylor G. B., Hunter T. R. 1995, A&AS, 112, 299
- Torrelles et al. (1989) Torrelles J. M., Ho P. T. P., Rodríguez L. F., Cantó J. 1989, ApJ, 343, 222
- Torrelles et al. (2011) Torrelles J. M., Patel N. A., Curiel S., Estalella R., Gómez J. F., Rodríguez L. F., Cantó J., Anglada G., Vlemmings W., Garay G., Raga A. C., Ho P. T. P. 2011, MNRAS, 410, 627
- Trinidad et al. (2003) Trinidad M. A., Curiel S., Cantó J., D’Alessio P., Rodríguez L. F., Torrelles J. M., Gómez J. F., Patel N., Ho P. T. P. 2003, ApJ, 589, 386
- Trinidad et al. (2013) Trinidad M. A., Curiel S., Estalella R., Cantó J., Raga A., Torrelles J. M., Patel N. A., Gómez J. F., Anglada G., Carrasco-González C., Rodríguez L. F. 2013, MNRAS, 430, 1309 [Paper I]
- Uscanga et al. (2005) Uscanga L., Cantó J., Curiel S., Anglada G., Torrelles J. M., Patel N. A., Gómez J. F., Raga A. C. 2005, ApJ, 634, 468
- van der Tak & Menten (2005) van der Tak F. F. S., Menten K. 2005, A&A, 437, 947
- van der Tak et al. (1999) van der Tak F. F. S., van Dishoeck E. F., Evans II N. J., Bakker E. J., Blake G. A. 1999, ApJ, 522, 991
- van der Tak et al. (2006) van der Tak F. F. S., Walmsley C. M., Herpin F., Ceccarelli, C. 2006, A&A, 447, 1011
- van der Wiel et al. (2011) van der Wiel M. H. D., van der Tak F. F. S., Spaans M., Fuller G. A., Plume R., Roberts H., Williams J. L. 2011, A&A, 532, 88
- Vlemmings et al. (2006) Vlemmings W. H. T., Diamond, P. J., van Langevelde H. J., Torrelles J. M. 2006, A&A, 448, 597