Solar Mini-Dimming Kinematics and Their Positive Correlations with Coronal Mass Ejections and Prominence
Abstract
Solar mini-dimmings can be detect in the Extreme Ultra-Violet coronal eruptions. Here, sequences of 171Å images taken by Solar Dynamic Observatory/Atmospheric Imaging Assembaly on 13 June 2010 are used. In this special day, both of coronal mass ejection and prominence were observed. The average velocities and accelerations of 500 mini-dimmings which were detected using on feature based classifier (Alipour et al 2012) are studied. The large number of mini-dimmings shows positive accelerations in the beginning times as similar as Coronal Mass Ejections. On the the start time of prominence eruptions, the number of mini-dimmings is increased to a maximum values. There is a positive correlation between the kinematics of mini-dimmings and both CME and prominences. This study can be extended to understand the exact relationship of CMEs and mini-dimmings.
keywords:
Sun: CMEs, mini-dimming, prominence1 Introduction
Corona mass ejections (CMEs) are bursts of clods of magnetic field and plasma from the solar corona into the interplanetary space. In coronagraph images a classical CME has often a three-part structure consists of a bright outward, dark cavity behind and a bright dense core inward [1]. Corona mass ejections are often associated with forms of solar activity that the most important of these are solar flare, eruptive prominence, coronal dimming and EIT wave. Solar flares are sudden, vigorous outbursts and compendium of ionized and hot gas close to sunspots. Protons and electrons accelerate into magnetic loops and release energy equivalent to the millions hydrogen bombs in a short period of time. Solar flares are classified according to their strength and are known in five classes A, B, C, M, X (from weak to strong). About 60% of flares (M and X classes) are associated with CMEs and about 50% of CMEs are accompanied with flares. Solar prominence are dense clouds of material similar to Phoenix suspended above the solar surface. The dense core of a CME structure is an erupting prominence. In coronagraph images, erupting prominence are observed as a bright area. About of 75% of CMEs are associated with prominence [2]. Coronal dimmings are similar to transitory coronal holes and are usually observe as density depletion in both X-rays and Extreme UltraViolet images. The dimmings are formed due to the depletioned plasmas by the eruption of the local magnetic field and in some cases it due to the temperature gradient [3]. Wave-like brightening propagate following of dimming expansion (approximately circular) over the whole of the Sun that are known as EIT wave [4]. This group of waves propagate from the active region and continue to where the magnetic field lines are further [5].
Mini-dimmings were first studied by Innes et al. (2009) by using 171 space-time slices [6]. Alipour, Safari, and Innes (2012), extended a method of automatic detection of mini-dimming using invariant properties of Zernike moments and feature based classifier Support Vector Machine (SVM) [7]. Their method detected the groups of small dimming features and the sizes, time durations, and velocities distributions were studied. The relation between corona mass ejections and mini-dimmings are studied by Alipour & Safari (2012) [8].
Here, in similar studies (Alipour et al. and Alipour & Safari), we used Solar Dynamic Observatory/Atomospheric Imaging Assembly (SDO/AIA) images to investigate some properties of mini-dimming (average velocity and acceleration). The relation between mini-dimmings and prominence eruptions are presented. The paper layout is as follows: the data analysis is discussed in Section 2. The average velocities and accelerations of mini-dimmings are studied in Section 3. Statistical studies on the relation between prominence and mini-dimmings are given in Section 4. The result and conclusion are presented in Section 5.
2 Data Analysis
Both of corona mass ejections and a prominence were occured on 13 June 2010, simultaneously. This prominence was observed at 304 Å (50000 K), and CMEs are taken from SOHO/LASCO coronagraph (http://cdaw.gsfc.nasa.gov/CME list).
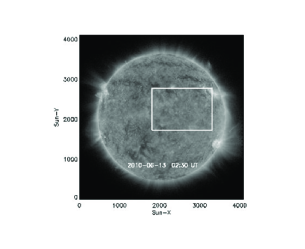
We used 171 (0.6 MK) SDO/AIA images (14001050 pixels) with a time cadence of 2.5 minutes and a pixel size 0.6 arcsec, taken on 13 June 2010 from cut out services. See Figure 1. Following Alipour et al. (2012), an automatic mini-dimming detection procedure applied to systematically scans through space-time slices of the data (see flowchart of their algorithm, Figure 3 therein). The number of 350 space-time slices with the size of 1400 are analyzed.

3 Acceleration and velocity of mini-dimmings
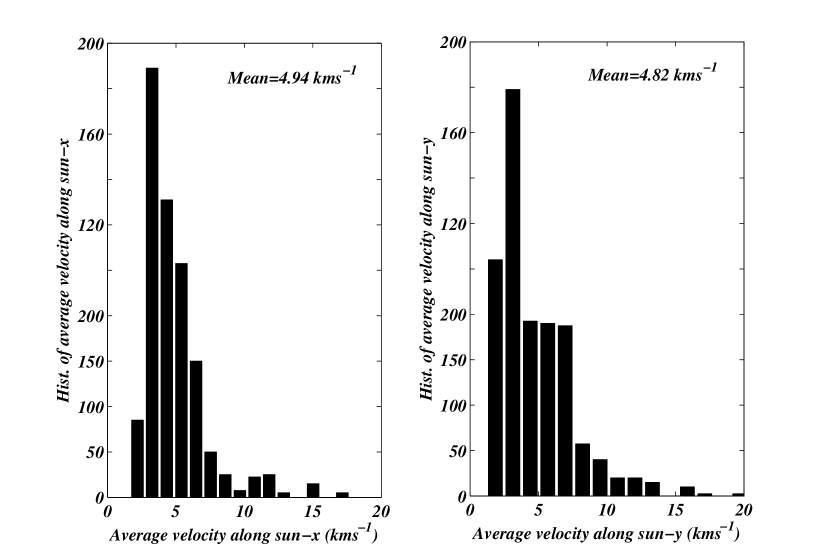
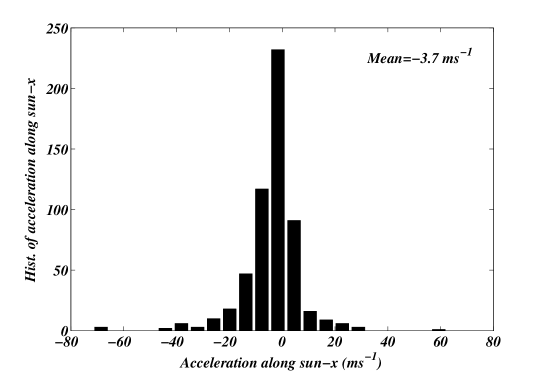
The average velocities and accelerations of detected mini-dimmings are computed. To do this, all events with spatial expansions ( arcsec and arcsec) and temporal expansions ( min) are grouped, Alipour et al. (2012). The center of events (position and time) of detected mini-dimming is determined. The spatial expansion of an event along the Sun-y is shown in Figure 2. The region growing algorithm is applied to compute the dimmings sizes (both and ) and time intervals () from space- time blocks of each group. The velocities along the Sun-x () and Sun-y () directions are calculated. The velocity-time graph of an event along the Sun-x is shown in Figure 4. The histograms of average velocities for 500 mini-dimming are shown in Figure 3. Using velocity-time graphs and fitting the accelerations, , are computed for each of grouped mini-dimmings. As shown in Figure 4, the velocity increases to a maximum values with a positive acceleration and then decreases with a negative acceleration. Mittal & Narian (2009) studied the distribution of speed of corona mass ejections from solar cycle 23 [9]. They shown that the accelerations of corona mass ejections are positive values in the beginning. In Figure 5, the histogram of accelerations along Sun-x is presented. We see that large number of mini-dimming shows positive acceleration.

4 Prominence eruption and mini-dimmings
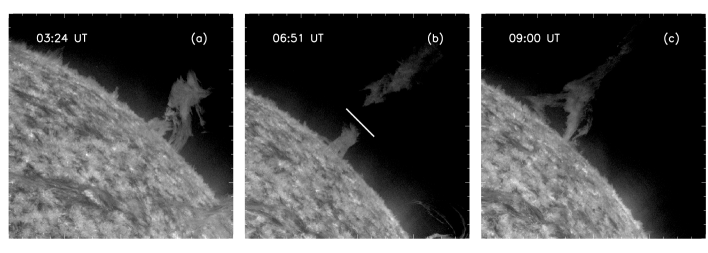
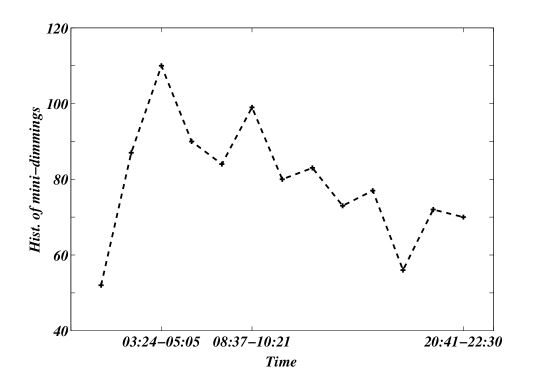
Solar prominences are bright loops of ionized and hot gas from the chromosphere into the corona. A single erupting prominence involves hundreds of millions of tons from the solar particles. A prominence eruption leading to a propagating corona mass ejection consists of three steps are presented in Figure 6. In Figure 7, the histogram of mini-dimmings are plotted versus time (with interval of 100 minute). We see that, on the the start time of eruption (first phase 03:24 UT - 05:08 UT), the number of mini-dimmings is increased to maximum value. On the second phase of prominence eruption (06:51 UT - 08:35 UT), the number of mini-dimmings is decreased. In the time of reconnection and rearrangement of magnetic field (third phase 08:37 UT - 10:21 UT), this number is increased.
5 Results and Conclusion
Prediction of coronal mass ejections and flares are important for solar physicist [11]. Observations of eruptive dimmings and EIT waves could be processed to predict solar CMEs, that is faster than coronagraph observations [12].
The automatic detection method for solar mini-dimmings (Alipour et al. 2012) has been applied to SDO/AIA 171Å data. On 13 June 2010, the average velocities and acceleration of 500 events were analyzed. We see that, approximately the large number of mini-dimmings were occurred with positive average velocities and accelerations at their beginning times. The number of detected mini-dimming increased in the time of first phase of prominence eruption and decrease in second phase of eruption, and again increased in the third phase of reconnection of magnetic field. These are positive correlations between mini-dimmings kinematics and both coronal mass ejections and prominence. These positive relationships might help to predict the occurrence of an associated CME.
References
- [1] Lang, K. R., 2009, ”The Sun from Space”, Springer, Pages 289 290
- [2] Subramanian, P., Dere, K. P., 2001, ApJ 561, 372
- [3] Thompson, B. J., Plunkett, S. P., Gurman, J.B., 1998, Geophys. Res. Lett 25, 2461
- [4] Podladchikova, O., Berghmans, D., 2005, Sol. Phys 228, 265
- [5] Chen, P. F., Fang, C., 2005, ApJ 622, 1202
- [6] Innes, D. E., Genetelli, A., Attie, R., Potts, H.E. 2009, A&A 495, 319
- [7] Alipour, N., Safari, H., Innes, D.E., 2012, ApJ 746, 12
- [8] Alipour, N., Safari, H., 2012, IJPR 12(1), 29
- [9] Mittal, N., Narain, U. 2009, New Astronomy 14, 341
- [10] Regnier, S., Walsh, R. W., Alexander, C. E., 2011, A&A 533, 1
- [11] Tajfirouze, E., Safari, H., 2012, ApJ 744, 113
- [12] Podladchikova, O., Vuets, A., Leontiev, P., Vander Linden, R.A.M., 2012, Sol. Phys 276, 479