Feasibility of top quark measurements at LHCb and constraints on the large- gluon PDF
Abstract
The forward LHCb acceptance opens interesting possibilities of studying precision Standard Model hard processes in a kinematical region beyond the reach of ATLAS and CMS. In this paper we perform a feasibility study for cross-section measurements of top quark pairs with the LHCb detector, with an analysis of signal and background rates for selected final states, and determine the potential precision achievable at 7 and 14 TeV. We then study the dependence of theoretical uncertainties on the pseudorapidity distribution of top quarks produced in pair production at NLO, and observe that a cross-section measurement at high pseudorapidity has enhanced sensitivity to probe the high- gluon PDF as compared to measurements in the central-region. Based on simulated pseudodata, the impact of a 14 TeV cross-section measurement on the gluon PDF and charge asymmetry is quantified.
Keywords:
Top physics, QCD Phenomenology, Forward physics1 Introduction
Top quark measurements at LHCb were initially proposed in Ref. Kagan:2011yx . It was demonstrated that production can be probed at high pseudorapidity by partially reconstructing (-jet) the total system. It was also proposed that this method of partial reconstruction can be used to measure the pair production charge asymmetry (charge asymmetry) by comparing the rate of top (-tagged) to anti-top (-tagged) events as a function of lepton pseudorapidity within the LHCb acceptance. The main motivation being that at a proton-proton collider, the rapidity of the heavy quarks written in terms of the incoming partons at leading order (LO) is,
| (1) | |||
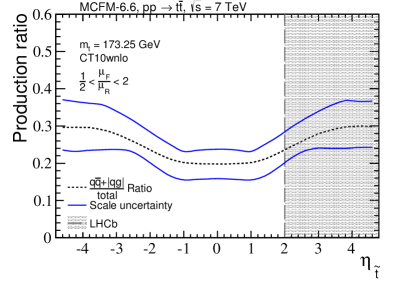
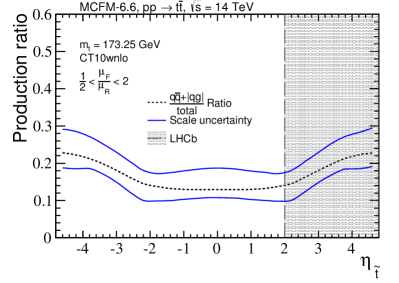
Meaning that, at momentum exchange scales required to produce pairs of top quarks, top quarks produced in the forward region have a high probability of having come from a high- incoming parton where the ratio of quark to gluon parton distribution functions (PDF) is larger - a consequence of the valence content of the proton. This results in less dilution to the charge asymmetry which arises from the colour structure of interfering diagrams, , with quarks in the initial state Kuhn:1998kw . However, this also means that forwardly produced top quarks from -scattering processes are produced from incoming gluons at high-. This is presented in Fig. 1 where the ratio of production mechanisms, ()/total, contributing to production is presented as a function of the arithmetic mean of pseudorapidity distributions of and (pseudotop - ) for 7 (left) and 14 TeV (right) centre of mass energies. Note that the contribution from -scattering is dominant across the entire range of phase space for both centre of mass energies.
 |
 |
There have been large efforts in the QCD community to improve the precision of top quark pair production predictions. In particular, the completion of the full next-to-next-to-leading order (NNLO) calculation Czakon:2013goa ; Baernreuther:2012ws ; Czakon:2012zr ; Czakon:2012pz as well as resummation of soft gluon emissions to next-to-next-to-leading log (NNLL) accuracy Czakon:2009zw ; Beneke:2009rj ; Cacciari:2011hy . The reduced scale uncertainty in these predictions is crucial to gaining information on other sources of theoretical uncertainty such as the high- gluon PDF, and the top mass. A recent study of the impact of these uncertainties on the inclusive cross-section at NNLO+NNLL accuracy can be found in Ref. Czakon:2013tha , where it is observed that such a measurement, with minimal scale uncertainties, has the potential to strongly constrain the gluon PDF. It is clear that a differential result to the same accuracy is highly desirable and will be available in the not-too-distant future. In fact, differential cross-section results and studies using approximate NNLO calculations and resummation techniques have already been obtained in Kidonakis:2010dk ; Ahrens:2011mw ; Kidonakis:2011ca ; Beneke:2012wb ; Guzzi:2013noa . To this end, we demonstrate the increased sensitivity of pair production cross-section measurements at high rapidity to the gluon PDF at NLO accuracy.
2 LHCb analysis at 7, 14 TeV
This section aims to provide an estimate of the potential statistical precision of a cross-section measurement achievable with the current 7 TeV data ( 1fb-1) as well as the projected 14 TeV data sample after 1 year of running ( 5fb-1). As pointed out in Ref. Kagan:2011yx , top quarks can be identified through their decay , where the muon and the are registered by the detector. Indeed, in the full decay it is also possible to reconstruct a , along with decay products, radiated jets (which tend to be forward) or quarks which do not come from the same parent top - as demonstrated in Ref. Gauld:1557385 . In the following analysis we will consider both and final states. Using multiple final states, requiring a different number of -tags, is a crucial cross check of the background modelling, in particular the ()jets processes. Given that top pairs are produced asymmetrically beyond LO, we introduce the ‘pseudotop’ object where;
| (2) |
Thus, the and final states are labelled as , . Introducing this definition removes the small bias introduced from the charge asymmetry. Given that the asymmetry in the backgrounds is driven by the quark valence content, which is well constrained by DIS data, the main uncertainty on backgrounds arises from total normalisation and so is not affected by this definition.
- Signal and background
The signal and backgrounds are simulated using POWHEG Nason:2004rx ; Frixione:2007vw ; Alioli:2010xd ; Frixione:2007nw ; Alioli:2010qp ; Alioli:2009je ; Frederix:2012dh ; Oleari:2011ey with the central CT10wnlo Lai:2010vv PDF set and then matched to Pythia8176 Sjostrand:2007gs , with the exception of jets where the matrix element is produced using MadGraph5 Alwall:2011uj with CTEQ6l1 Pumplin:2002vw . The signal is found by fixing the reference factorisation and renormalisation scales equal to the top mass ( = 173.25 GeV). It is found that the difference between the parton level POWHEGPythia8176 and MCFM Campbell:2010ff pseudotop pseudorapidity distributions is negligible111Provided the switch SpaceShower:phiIntAsym is turned off during the shower. This switch introduces un-desired colour-reconnection effects which are already accounted for correctly in the NLO matrix element.. The main backgrounds are identified as single top, ()jets and ()jets. The QCD background originating from di-jet production where a secondary muon passes isolation and kinematic cuts has previously been shown to be negligible Kagan:2011yx . Given a di-jet background rejection of (10-5), and that the relative increase in the ratio of from 714 TeV is 3, this will also be ignored for the 14 TeV analysis. The -channel single top process is modelled in both 4 and 5 flavour (ST, tch) schemes, the 4-flavour cross-section is normalised to that found in the case of 5 flavours and the average of these distributions is plotted with a systematic error associated to the envelope between the two descriptions222The top decay is not included in the matrix element in the 4-flavour scheme.. There is a small combined (below 10 of signal) contribution from and -channel single top which is not included. The ()jets background arises from leptonic decay of a where only one of the leptons is detected in association with either a correctly identified (in ) or mis-tagged -jet. The ()jets background is separated into jets, where jet is a light flavour (u,d,s,c,g) which is mis-tagged as a -jet, and jets (where ) with a correctly identified -jet.
- Selection and reconstruction
Jet objects are defined to have a jet parameter R333R of 0.5, 15 GeV, and to be built with the anti-kt algorithm using FastJet3 Cacciari:2011ma software. In this analysis, -jets are defined to be jets which are matched to a parton -quark from the hard process (within R). It is also required that charged leptons are isolated ( R (, jet) R) which is necessary to suppress QCD background. It was found that reconstructed jets with an R parameter of 0.7 better match parton energy as well as increasing the -matching efficiency. However, the combination of the lepton isolation requirement and background reduction favours an R parameter of 0.5. Kinematic cuts of 60 GeV on the leading -jet and a cut of 20 GeV on the muon and sub-leading jet are imposed which dramatically reduces background whilst having a comparatively small effect on signal. Jets and muons are also required to be within the pseudorapidity range of . An efficiency of 75 is applied to muons, which is estimated from the combined trigger efficiency of and identification/tracking for high ( 20 GeV) muons from Ref. Aaij:2012vn . A -tagging efficiency of 70 with a corresponding mis-tag rate for light jets of 1 is assumed. It is noted that a more detailed study could separate -jet background processes and apply an appropriate charm mis-tag rate, this is left for the data analysis.
 |
 |
 |
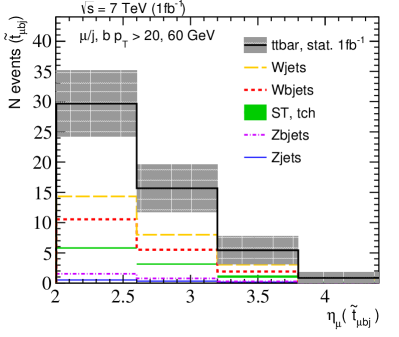 |
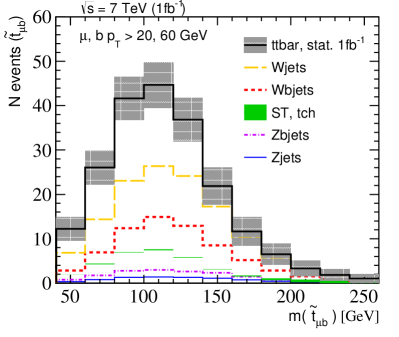
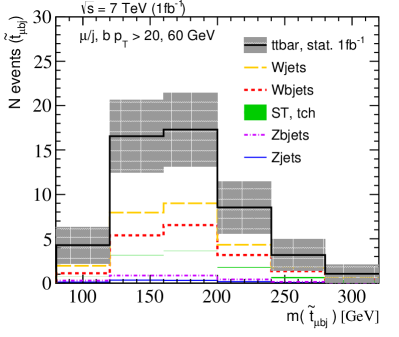
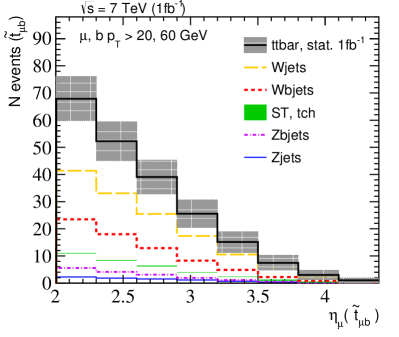
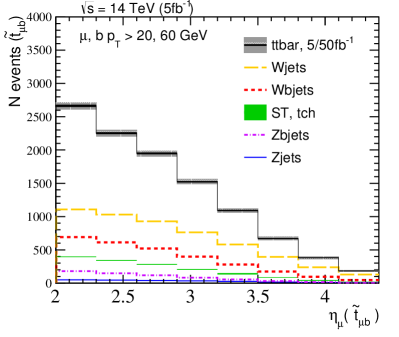
The expected number of pseudotop events in 1 fb-1 as a function of reconstructed invariant mass (upper) and muon pseudorapidity (lower) for both (left) and (right) channels at 7 TeV are plotted in Fig. 2. The background and signal is stacked and the resultant uncertainty band corresponds to the statistical error for the given choice of binning. The single top (ST, tch) distribution is the envelope of the 4 and 5-flavour predictions as previously mentioned. The 4-flavour differential cross-section tends to be slightly larger for high invariant masses due to a larger number of events where the co-linear spectator -quark and lepton are reconstructed together within the acceptance - in particular beyond . The distributions (lower) have overwhelming statistical uncertainties in the pseudorapidity bins beyond 3. This is region of phase space where the asymmetry in the / pseudorapidity distributions in pair production is largest and indicates that more data is required for a statistically meaningful differential charge asymmetry measurement at LHCb.
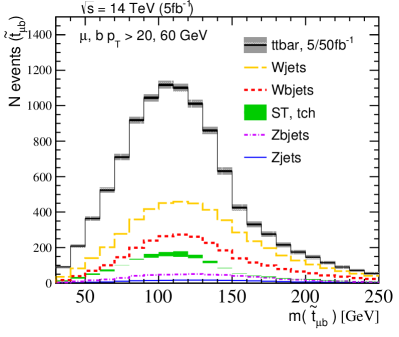
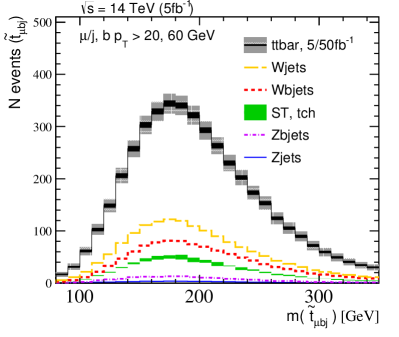
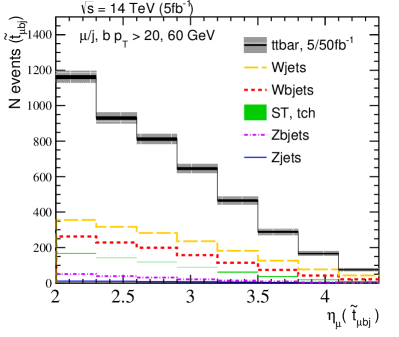
The same analysis of signal and background at 14 TeV is also presented. The expected number of pseudotop events in 5 fb-1 as a function of reconstructed invariant mass (upper) and of muon pseudorapidity (lower) for both (left) and (right) channels at 14 TeV are shown in Fig. 3. The larger data sample size and dramatic increase in cross-section at 14 TeV suggest that high statistical precision will be achievable for several high multiplicity pseudotop final states. The wider grey fill on the signal corresponds to the statistical precision expected with 5 fb-1, while the black band corresponds to 50 fb-1 (achievable after 10 years of running). It is clear that high-statistical precision () can be obtained across the entire acceptance in phase space even for a fine choice of binning (/0.3).
 |
 |
 |
 |
3 Pair production cross-section
Given the promising signal yield and observability at 14 and 7 TeV, we study the theoretical uncertainties on the signal at the parton level within the LHCb acceptance. The parton level NLO results are produced with MCFM and compared to the inclusive NNLO+NNLL (NNLO∗) results presented in Ref. Czakon:2013tha . The LHCb cross-section for pseudotop production is,
| (3) |
In accordance with Ref. Czakon:2013tha , the theoretical uncertainties are obtained in the following way,
- Top mass
The central top quark pole mass is assumed to be 173.25 GeV. The dependence on the cross-section from the uncertainty of the top mass, , is then found by varying the mass within the range GeV and then taking the average. This range is in agreement with the current PDG value of 173.07 0.52 0.72 GeV Beringer:1900zz and latest LHC combination of 173.29 0.23 0.792 GeV ATLAS-CONF-2013-102 from direct measurements.
The following NLO PDF sets are studied; ABM11(5flv)Alekhin:2012ig , CT10wnlo, HERAPDF1.5 CooperSarkar:2011aa , MSTW08nlo68cl Martin:2009iq and NNPDF2.3nlo Ball:2011mu , where the central value of 0.118, 0.118, 0.1176, 0.120 and 0.119 is chosen for each set respectively. Asymmetric/symmetric uncertainties are found in the usual way as;
| (4) | ||||
represents the observable calculated from eigenvector member . The uncertainties obtained for each PDF collaboration are quoted at 1 confidence level (CL), where the CT10 uncertainties provided at 90% CL have been scaled down by a factor of 1.645. The PDFs are accessed through the LHADPF interface Whalley:2005nh .
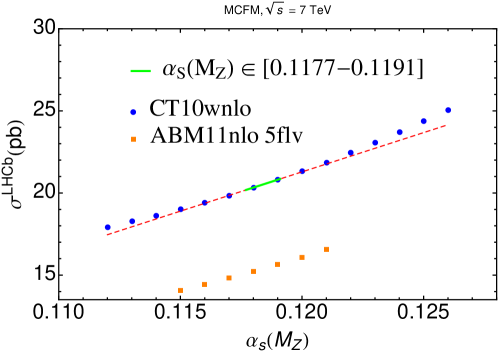
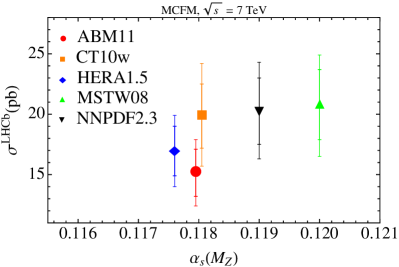
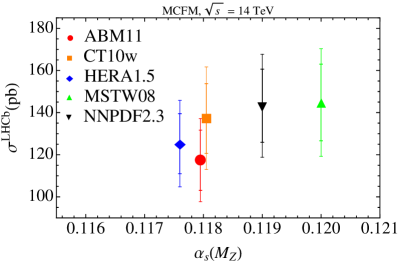
The strong coupling uncertainty, , is found by computing a linear fit for the cross-section for variation of which spans the preferred central value for all PDF sets. The 1 CL range is then extracted by matching this fit to the current PDG average of is 0.1184 0.0007 Beringer:1900zz - see Fig. 4. A linear fit within this range is a good approximation to the leading quadratic behaviour. In the case of ABM PDFs, is included as a parameter in the fit and is therefore already accounted for in the symmetric PDF uncertainty. ABM however do provide a set of PDFs for variation, the results obtained from this variation set is compared to that of CT10 within Fig. 4 for reference.
 |
- Scale
The scale uncertainty, , is found from varying factorisation and renormalisation scales and independently by a factor of two in both directions of the top mass - this is done such that the scale ratio () is always within this range. The central value is chosen as .
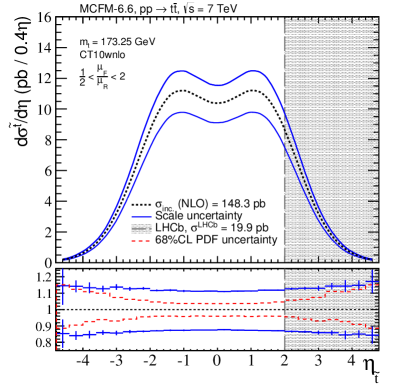
The pseudotop differential cross-section with respect to pseudorapidity is shown in Fig. 5 for 7 and 14 TeV, the blue uncertainty band is due to scale variation as previously described. The relative 1 PDF uncertainty is plotted alongside the relative scale uncertainty, demonstrating the increase in PDF uncertainty with pseudorapidity. The LHCb acceptance is also highlighted to provide some intuition as to the fraction of events where one of the pair produced top quarks is forward.
 |
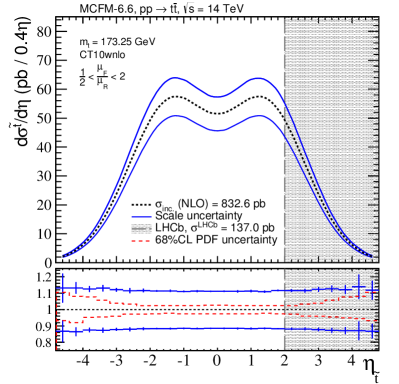 |
The magnitude of increases with pseudorapidity as this corresponds to events produced from partons at both very high and low- where the gluon and anti-quark PDFs are respectively not well known. There is also a rapidity dependence of which arises from uncertainty in the gluon PDF indirectly, where an increase in leads to a smaller gluon PDF at lower values of x while momentum sum rules compensate this by increasing the gluon PDF at large x, resulting in a rapidity dependent uncertainty. There is also a small pseudorapidity dependence on scales due to differences in the physical scale, , for forward events.
The contribution from the individual sources of systematic uncertainties to the LHCb cross-section are now evaluated and compared to the inclusive NLO and NNLO∗ results - from Ref. Czakon:2013tha . The total uncertainty is found by combining the the individual uncertainties following the recommendation of the Higgs Cross Section Working Group Dittmaier:2011ti as,
| (5) |
The 7 and 14 TeV results are summarized in Table 1 and Table 2 respectively. A summary plot including both scale and total uncertainties is also provided both energies in Fig. 6. The NNLO∗ results have been corrected to the chosen top mass range of , where it is found that a 1 GeV uncertainty on translates into a 3.0, 2.7 uncertainty on the cross-section at 7 and 14 TeV.
| Order | (pb) | (pb) | (pb) | (pb) | (pb) | (pb) | |||||||||||
|---|---|---|---|---|---|---|---|---|---|---|---|---|---|---|---|---|---|
| NNLO∗(inc.) | 135.8 | ||||||||||||||||
| NLO(inc.) | ABM | 123.5 | |||||||||||||||
| NLO(LHCb) | 15.2 | ||||||||||||||||
| NNLO∗(inc.) | 172.5 | ||||||||||||||||
| NLO(inc.) | CT10 | 148.3 | |||||||||||||||
| NLO(LHCb) | 19.9 | ||||||||||||||||
| NNLO∗(inc.) | 177.2 | ||||||||||||||||
| NLO(inc.) | HERA | 136.1 | |||||||||||||||
| NLO(LHCb) | 16.9 | ||||||||||||||||
| NNLO∗(inc.) | 172.0 | ||||||||||||||||
| NLO(inc.) | MSTW | 158.4 | |||||||||||||||
| NLO(LHCb) | 20.8 | ||||||||||||||||
| NNLO∗(inc.) | 172.7 | ||||||||||||||||
| NLO(inc.) | NNPDF | 158.7 | |||||||||||||||
| NLO(LHCb) | 20.2 | ||||||||||||||||
| Order | (pb) | (pb) | (pb) | (pb) | (pb) | (pb) | |||||||||||
|---|---|---|---|---|---|---|---|---|---|---|---|---|---|---|---|---|---|
| NNLO∗(inc.) | 832.0 | ||||||||||||||||
| NLO(inc.) | ABM | 771.9 | |||||||||||||||
| NLO(LHCb) | 117.2 | ||||||||||||||||
| NNLO∗(inc.) | 952.8 | ||||||||||||||||
| NLO(inc.) | CT10 | 832.6 | |||||||||||||||
| NLO(LHCb) | 137.0 | ||||||||||||||||
| NNLO∗(inc.) | 970.5 | ||||||||||||||||
| NLO(inc.) | HERA | 804.2 | |||||||||||||||
| NLO(LHCb) | 124.7 | ||||||||||||||||
| NNLO∗(inc.) | 953.6 | ||||||||||||||||
| NLO(inc.) | MSTW | 885.6 | |||||||||||||||
| NLO(LHCb) | 144.4 | ||||||||||||||||
| NNLO∗(inc.) | 977.5 | ||||||||||||||||
| NLO(inc.) | NNPDF | 894.5 | |||||||||||||||
| NLO(LHCb) | 142.5 | ||||||||||||||||
 |
 |
The enhanced sensitivity of measurements at high pseudorapidity can be seen by comparing the relative uncertainties for the inclusive and differential LHCb cross-sections. This comparison is done by taking the ratio of their relative uncertainties,
| (6) |
which highlights the sensitivity of measurements at LHCb to PDF uncertainties, in particular to those sets provided by NNPDF and CT10. The results are summarised in Tables 3 and 4 for 7 and 14 TeV respectively.
| ABM | |||||
|---|---|---|---|---|---|
| CT10 | |||||
| HERA | |||||
| MSTW | |||||
| NNPDF |
| ABM | |||||
|---|---|---|---|---|---|
| CT10 | |||||
| HERA | |||||
| MSTW | |||||
| NNPDF |
It is noted that the central value prediction from ABM is substantially lower than the other predictions for differential and inclusive NLO, and NNLO results. At NNLO this can be understood from both a lower value for and a softer gluon PDF at large- Ball:2012wy ; Czakon:2013tha . At NLO, even for identical best fit value , the prediction from ABM is substantially lower than CT10 as shown in Fig. 4. In fact, the discrepancy between the central value of ABM and the other predictions is enhanced at high rapidity as a result of the soft large- gluon PDF. The predictions from different eigenvectors were found to be very stable, with the exception of members 10 and 13, resulting in small PDF uncertainty. Although the PDF uncertainty is small, including LHCb data in a PDF fit will impact the central value of the gluon PDF in the large- region.
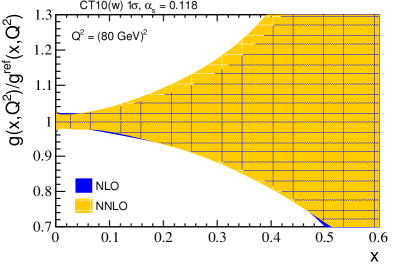
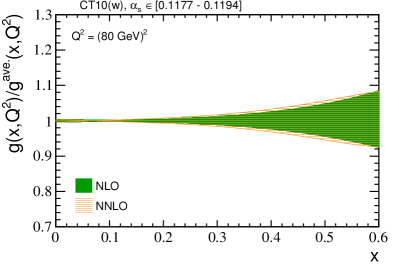
At NLO the contribution from the scale variation to the total uncertainty is dominant. However, given the recent theoretical advances in pair production predictions, it is clear that a cross-section measurement in the forward region can be used to constrain the gluon PDF description at high-. It is expected that the observed large ratio of the relative PDF uncertainties between inclusive and LHCb measurements is still present at NNLO. This can be seen by comparing the relative uncertainty on the gluon PDF as function of for both CT10 NLO and NNLO sets for (left) and (right) as shown in Fig. 7. The uncertainties at NLO and NNLO are of comparable size.
 |
 |
4 Constraining the gluon PDF
Due to the high statistical precision expected within 1 year of running (5 fb-1) at 14 TeV, a differential measurement in bins of pseudorapidity across the entire LHCb acceptance is viable. To demonstrate the potential power of such a measurement on constraining the gluon PDF, we apply a reweighting to the CT10 and NNPDF sets based on a hypothetical measurement of . This is done following the prescriptions of Ref. Ball:2010gb ; DeLorenzi:2010zt ; Ball:2011gg ; Watt:2012tq where a Bayesian method based on statistical inference is used. The procedure is easily performed for the NNPDF Monte Carlo sets, while for CT10 (the Hessian set) it is necessary to first generate a set of random PDFs from the eigenvector set. This is done working in the basis of observables, , spanning the eigenvectors. Hypothetical and random observables are generated as:
| (7) |
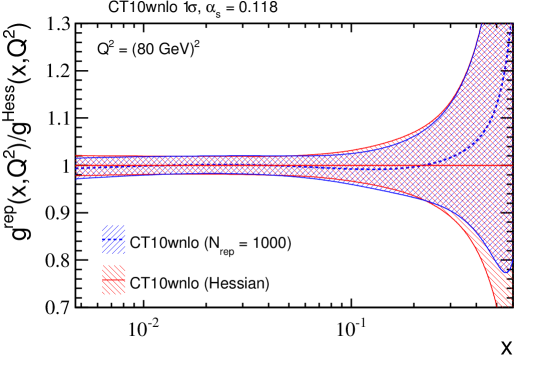
where is a random gaussian-distributed number with zero mean and variance of one. The choice of negative or positive displacements or depends on the sign of . For the generated CT10 and NNPDF sets studied, the number of replicas are 1000 and 100 respectively. This procedure is applied to the evolved gluon PDF for CT10 and then compared to the Hessian result in Fig. 8, where the relative uncertainty for the replica and Hessian set is plotted with respect to the Hessian central value. The difference between the two sets occurs for large where the PDF uncertainties are most asymmetric (see also Fig. 7). It is re-assuring that the two parameterisations are in very good agreement.
 |
By storing the set of random numbers generated in producing the replica set, it is possible to then generate an equivalent set of observables at the level of . From these sets of random observables a reweighting can be performed by computing the with respect to , assuming an experimental uncertainty in the range 4-8%. The relevant formulas are:
| (8) |
where the weights are computed as
| (9) |
and the dominator fixing the normalisation is,
| (10) |
After applying this reweighting technique, the number of effective remaining replicas can be found after calculating the Shannon entropy as,
| (11) |
The effective number of replicas after having applied this reweighting technique to the random NNPDF ( 100) and CT10 ( 1000) sets for different experimental uncertainties are provided in Table 5.
| (pb) | Exp. uncertainty | |||
|---|---|---|---|---|
| 4% | 1000 | 942 | ||
| CT10 | 137.3 | 6% | 1000 | 983 |
| 8% | 1000 | 994 | ||
| 4% | 100 | 97 | ||
| NNPDF | 145.1 | 6% | 100 | 99 |
| 8% | 100 | 100 |
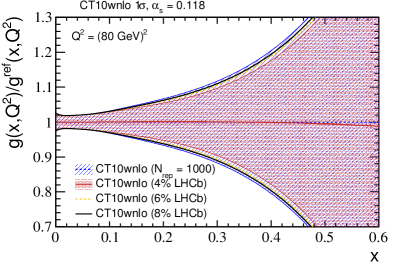
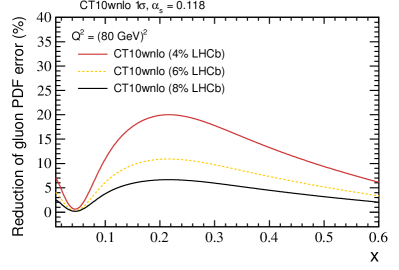
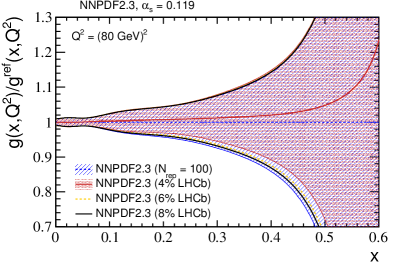
The effect of this reweighting on the evolved gluon PDF is presented in Fig. 9 for CT10 (upper) and NNPDF (lower) replica sets. The reduction of the relative uncertainty of the gluon PDF with respect to the average of the unweighted PDF, ), is plotted (Fig. 9, left) assuming experimental uncertainties of 4, 6, and 8% of the pseudoata . The reduction of the gluon PDF uncertainty for the same range of experimental uncertainties are also plotted (right).
 |
 |
 |
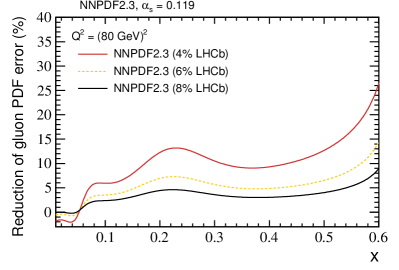 |
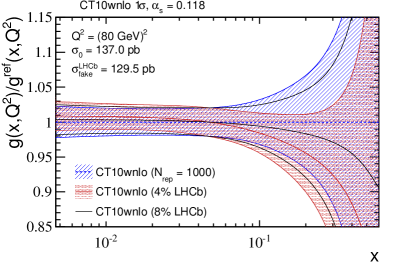
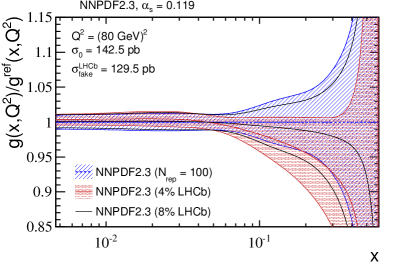
The largest sensitivity lies within the range of for 14 TeV pseudodata. The experimental precision achievable at LHCb will therefore have a large impact on future PDF fits within this range. The choice of generating pseudodata from an observable generated from the central value PDF set is useful for demonstrating the reduction in uncertainty, however the impact on the central value is clearly small by construction. To demonstrate the impact of a measurement at LHCb on the central value, pseudodata is generated from the HERA central value, 129.5 pb, and then used to reweight the CT10 and NNPDF replica sets. The results are plotted in Fig. 10 and the effective number of replicas are also computed and included in Table 6.
 |
 |
| (pb) | Exp. uncertainty | |||
|---|---|---|---|---|
| 4% | 1000 | 720 | ||
| CT10 | 129.5 | 6% | 1000 | 895 |
| 8% | 1000 | 956 | ||
| 4% | 100 | 53 | ||
| NNPDF | 129.5 | 6% | 100 | 85 |
| 8% | 100 | 95 |
For convenience of the PDF collaborations, we list the eigenvectors (and their directions) for all studied asymmetric Hessian sets which have a substanial impact on replicas with large values. Given that the pseudodata values are centred on the observable calculated from the central Hessian member (), this can be quantified as
| (12) |
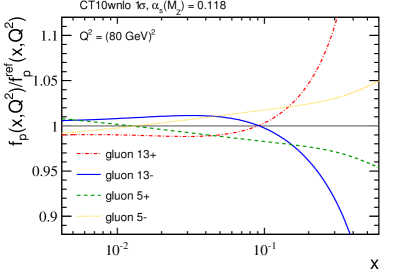
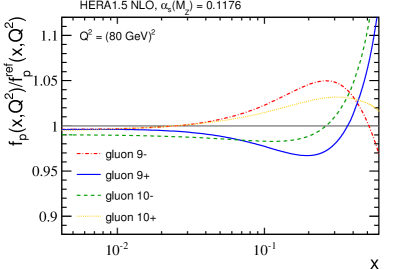
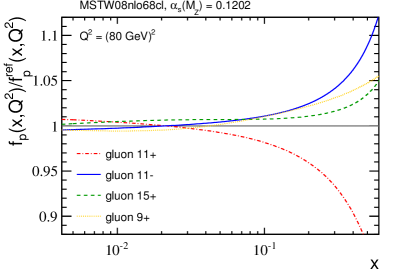
These members and their deviations with respect to the central value are presented in Table 7. The ratio of the evolved gluon and up quark PDFs with respect to the central value for these members are also presented in Fig. 11. The deviations at high- are found to be largest for the gluon PDF, with the exception of the valence content for a few eigenvectors, demonstrating the dominance of the gluon PDF uncertainties on the observable .
| CT10 | HERA | MSTW | |||
|---|---|---|---|---|---|
| (%) | (%) | (%) | |||
| 13 | 2.47 | 9 | 1.92 | 11 | 2.13 |
| 13 | 1.71 | 9 | 1.84 | 11 | 1.41 |
| 5 | 1.55 | 10 | 1.39 | 15 | 1.17 |
| 5 | 1.53 | 10 | 1.26 | 9 | 0.97 |
| 26 | 1.39 | 4 | 0.55 | 12 | 0.85 |
| 24 | 1.23 | 4 | 0.52 | 9 | 0.82 |
 |
 |
 |
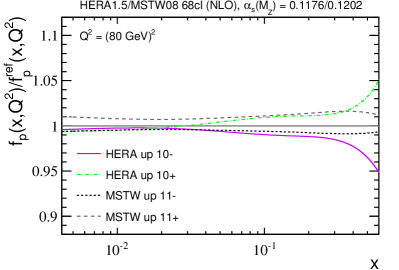 |
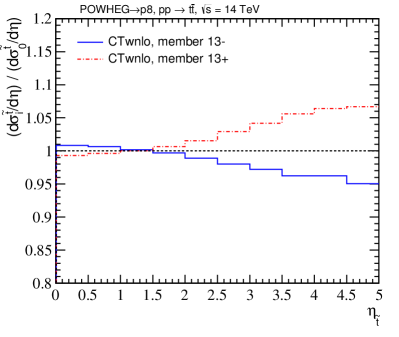
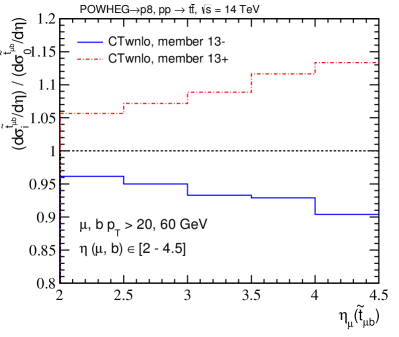
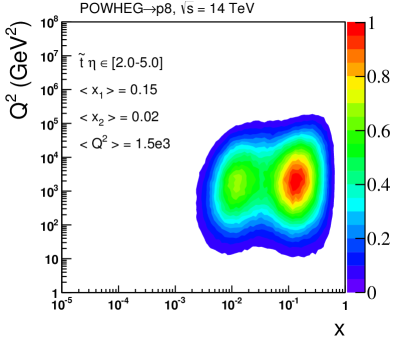
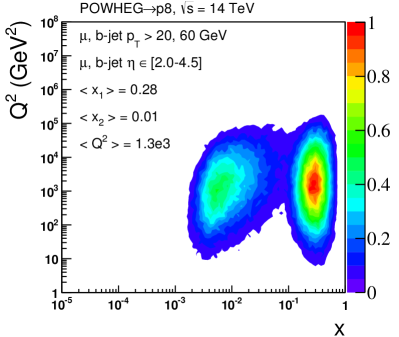
These particular eigenvectors are only similar to the list obtained from calculating the inclusive cross-section. This is due to partial cancellation across the entire pseudorapidity region for the cross-section prediction from some eigenvectors, as shown in Fig. 12 where the ratio of pseudotop (left) differential cross-sections for CT10 eigenvectors 13 and 13 are plotted with respect to the central value. This cancellation is a consequence of the evolved gluon PDF for eigenvectors 13 and 13 passing a crossing point with respect to the central value at = 0.1, which dominates central production at 14 TeV - see Fig. 11. Also plotted in Fig. 12 (right) is the ratio of differential cross-sections for the final state passing all analysis cuts discussed in the previous section, again for eigenvectors 13 and 13 where the deviation from the central value is larger. This demonstrates that the analysis of the impact of a measurement on the gluon PDF is an underestimate as more information is contained in a binned differential cross-section. In fact, the kinematic cuts applied in the analysis, which are required to improve the signal/background ratio, for the -jet and muon of 60, 20 GeV select harder events which are produced from higher incoming partons improving the constraints at yet higher . This is demonstrated in Fig. 13 where the incoming parton momentum fraction is plotted against the event momentum scale squared (). The left plot corresponds to events where a parton level top is within the LHCb acceptance, and the right plot to events passing the full analysis cuts. As a larger fraction of events are at high- ( 0.28) after applying analysis cuts, this increases the sensitivity within this region which can be seen by comparing the bin-by-bin deviation in Fig. 12. Fully quantifying the sensitivity after applying analysis cuts will require a full study of NLO+PS for all eigenvector members as well as knowledge of cuts which will be eventually used in the analysis.
 |
 |
 |
 |
5 Application to the charge asymmetry
Improvements to the gluon PDF description at high- are useful for reducing uncertainties in Standard Model (SM), such as Higgs production, as well as Beyond-SM (BSM) physics processes which are often swamped by backgrounds. Another interesting application of an improved high- gluon PDF is to the prediction of the charge asymmetry, diluted by symmetric -scattering.
There is tension between NLO predictions and the observed charge asymmetry from foward-backward measurements with the full TeVatron data sets, Ref. Aaltonen:2012it ; Aaltonen:2013vaf ; Abazov:2013wxa ; d0:preliminary , where the measured asymmetries are larger than expected. Although the same behaviour is not seen in the current LHC forward-central measurements, Ref. ATLAS-CONF-2013-078 ; Chatrchyan:2012cxa ; CMS-PAS-TOP-12-033 , it is difficult for any conclusion to be made as the combined uncertainties on the LHC measurements are of comparable size to the theoretical predictions. The small asymmetry prediction at the LHC, in comparison to the TeVatron, is a result of the large -dilution present in multi-TeV collisions as well as the redefinition of asymmetry variables required as the initial state is symmetric.
The proposal of Ref. Kuhn:1998kw , and specifically to LHCb in Ref.Kagan:2011yx , was to measure the production rate of / from pair production in the high pseudorapidity bins at the LHC as,
| (13) |
Due to the reduction in the dilution from -scattering, the asymmetry grows substantially with increasing pseudorapidity. With LHCb data sets of 5, 50 fb-1 at 14 TeV, the number of events passing the analysis cuts of Section 2 beyond are respectively. Therefore, an asymmetry measurement with these data sets will also be systematically dominated. We have already demonstrated the sensitivity of cross-section measurements at LHCb to the high- gluon uncertainties, meaning that the associated PDF systematic for the asymmetry is also large in comparison to central measurements.
To demonstrate how a cross-section measurement at LHCb impacts the PDF uncertainty of , we perform a reweighting of the observables generated from CT10 and NNPDF replica sets based on the assumption of a cross-section measurement . Note that in this case, the reweighting of both CT10 and NNPDF sets is done assuming the same cross-section, where as in the previous section this was not the case. The predictions from the replica sets are combined in the following way,
| (14) | ||||
correspond to the observable calculated from CT10 and NNPDF replica sets. A reweighting is performed for both CT10 and NNPDF sets assuming 145.1 pb and then also for 129.5 pb, with an associated experimental uncertainty of 4%. The predictions for the asymmetry before and after these reweightings are shown in Fig. 14.
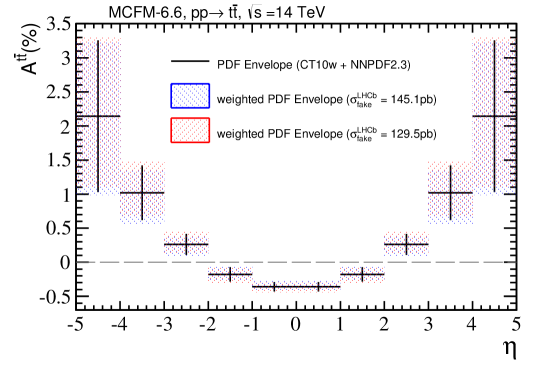 |
The assumed cross-section of 145.1 pb results in a decrease in magnitude of the asymmetry, while for the smaller cross-section 129.5 pb the opposite behaviour is observed, accounting respectively for and increase and decrease in the gluon PDF at high- required to account for the assumed cross-section. The asymmetry expectation and associated uncertainty is provided in Table 8 where the relative shifts in the asymmetry after reweighting are also included. The change to the overall relative uncertainty on the asymmetry is found to be negligible for the given choices of pseudodata cross-sections. The largest shift to the central value is in the region 2.0 3.0, which is the region where the contribution to is largest - see Fig. 5.
| 0.0 1.0 | 1.0 2.0 | 2.0 3.0 | 3.0 4.0 | 4.0 5.0 | |
|---|---|---|---|---|---|
| (%) | 0.360.07 | 0.180.11 | 0.260.16 | 1.020.40 | 2.141.11 |
| shift ( 145.1 pb) | 3.07% | 7.34% | 10.82% | 7.24% | 1.89% |
| shift ( 129.5 pb) | 2.92% | 7.40% | 10.75% | 6.55% | 2.70% |
6 Discussion
The chosen experimental uncertainty range of 4-8% is an estimate of the systematic reach of future measurements at LHCb, it is expected that the largest uncertainties arise from; background/signal modelling, -tagging mis-tag/efficiency and luminosity. Current cross-section results from ATLAS ATLAS-CONF-2013-097 have already achieved a total relative uncertainty below 5%, it is therefore not unreasonable to expect similar precision from measurements with the upgraded LHCb detector. Especially given that the same simulation technology is available to LHCb (currently NLOparton shower) and that the luminosity uncertainty at LHCb Aaij:2011er is of similar size to the result ATLAS-CONF-2013-097 . It is therefore expected that future cross-section measurements at LHCb have the potential to reduce uncertainties on the high- gluon PDF by up to 20%. A direct application of such an improvement is to better predict the charge asymmetry within the LHCb acceptance. Given that the prediction of the charge asymmetry is dependent on the high- gluon PDF, comparisons between BSM scenarios and perturbative QCD will rely on such improvements.
The analysis strategy presented for top reconstruction relies on isolating the charged lepton in the decay as well as any additional jets in the event, the main motivation for this is to reduce the QCD background. However, this also removes highly boosted top quark decays in which the top decays products are very close together. There are many BSM scenarios which contain top partners as a solution to the hierarchy problem, for example Cheng:2005as ; Agashe:2006hk . If these new particles are kinematically accessible at the LHC, and they decay via top quarks - which is often the case - then boosted top quarks are an interesting signal for BSM Matsumoto:2006ws ; Belyaev:2006jh ; Freitas:2006vy ; Meade:2006dw ; Thaler:2008ju ; Nojiri:2008ir . In the case of boosted top quarks at LHCb, an investigation into the separation power of very energetic fat jets and top decays should be undertaken. Semi-leptonic decays may be promising due to the excellent impact parameter resolution for charged leptons.
We conclude that a cross-section measurement with the current 7 TeV data set is statistically limited. However, given the larger data set available at 8 TeV (2 fb-1) and an increase in , statistical precision of 6% is achievable in the highly populated bins (see. Fig 2). It is also worth investigating the precision achievable in the electron channel, which could further improve statistics. At 14 TeV the impact of a cross-section measurement on the gluon PDF ultimately depends on the experimental precision. Measurements of the background cross-sections such as ()-jets will be a necessary ingredient to achieving high precision.
7 Acknowledgements
We are grateful to Amanda Cooper-Sarkar, Ulrich Haisch and Victor Coco for many useful suggestions and in particular Juan Rojo for advice which helped improve the study. The research of R.G. is supported by an STFC Postgraduate Studentship.
References
- (1) A. L. Kagan, J. F. Kamenik, G. Perez, and S. Stone, Top LHCb Physics, Phys. Rev. Lett. 107 (2011) 082003, arXiv:1103.3747
- (2) J. H. Kuhn and G. Rodrigo, Charge asymmetry of heavy quarks at hadron colliders, Phys. Rev. D59 (1999) 054017, arXiv:hep-ph/9807420
- (3) M. Czakon, P. Fiedler, and A. Mitov, The total top quark pair production cross-section at hadron colliders through O(alpha_S4̂), Phys. Rev. Lett. 110 (2013) 252004, arXiv:1303.6254
- (4) P. Baernreuther, M. Czakon, and A. Mitov, Percent Level Precision Physics at the Tevatron: First Genuine NNLO QCD Corrections to , Phys. Rev. Lett. 109 (2012) 132001, arXiv:1204.5201
- (5) M. Czakon and A. Mitov, NNLO corrections to top-pair production at hadron colliders: the all-fermionic scattering channels, JHEP 1212 (2012) 054, arXiv:1207.0236
- (6) M. Czakon and A. Mitov, NNLO corrections to top pair production at hadron colliders: the quark-gluon reaction, JHEP 1301 (2013) 080, arXiv:1210.6832
- (7) M. Czakon, A. Mitov, and G. F. Sterman, Threshold Resummation for Top-Pair Hadroproduction to Next-to-Next-to-Leading Log, Phys. Rev. D80 (2009) 074017, arXiv:0907.1790
- (8) M. Beneke, P. Falgari, and C. Schwinn, Soft radiation in heavy-particle pair production: All-order colour structure and two-loop anomalous dimension, Nucl. Phys. B828 (2010) 69, arXiv:0907.1443
- (9) M. Cacciari et al., Top-pair production at hadron colliders with next-to-next-to-leading logarithmic soft-gluon resummation, Phys. Lett. B710 (2012) 612, arXiv:1111.5869
- (10) M. Czakon, M. L. Mangano, A. Mitov, and J. Rojo, Constraints on the gluon PDF from top quark pair production at hadron colliders, JHEP 1307 (2013) 167, arXiv:1303.7215
- (11) N. Kidonakis, Next-to-next-to-leading soft-gluon corrections for the top quark cross section and transverse momentum distribution, Phys. Rev. D82 (2010) 114030, arXiv:1009.4935
- (12) V. Ahrens et al., RG-improved single-particle inclusive cross sections and forward-backward asymmetry in production at hadron colliders, JHEP 1109 (2011) 070, arXiv:1103.0550
- (13) N. Kidonakis and B. D. Pecjak, Top-quark production and QCD, Eur. Phys. J. C72 (2012) 2084, arXiv:1108.6063
- (14) M. Beneke et al., Inclusive Top-Pair Production Phenomenology with TOPIXS, JHEP 1207 (2012) 194, arXiv:1206.2454
- (15) M. Guzzi, K. Lipka, and S.-O. Moch, Top-quark production at the LHC: differential cross section and phenomenological applications, arXiv:1308.1635
- (16) R. Gauld, Measuring top quark production asymmetries at LHCb, Tech. Rep. LHCb-PUB-2013-009. CERN-LHCb-PUB-2013-009, CERN, Geneva, Jun, 2013
- (17) P. Nason, A New method for combining NLO QCD with shower Monte Carlo algorithms, JHEP 0411 (2004) 040, arXiv:hep-ph/0409146
- (18) S. Frixione, P. Nason, and C. Oleari, Matching NLO QCD computations with Parton Shower simulations: the POWHEG method, JHEP 0711 (2007) 070, arXiv:0709.2092
- (19) S. Alioli, P. Nason, C. Oleari, and E. Re, A general framework for implementing NLO calculations in shower Monte Carlo programs: the POWHEG BOX, JHEP 1006 (2010) 043, arXiv:1002.2581
- (20) S. Frixione, P. Nason, and G. Ridolfi, A Positive-weight next-to-leading-order Monte Carlo for heavy flavour hadroproduction, JHEP 0709 (2007) 126, arXiv:0707.3088
- (21) S. Alioli, P. Nason, C. Oleari, and E. Re, Vector boson plus one jet production in POWHEG, JHEP 1101 (2011) 095, arXiv:1009.5594
- (22) S. Alioli, P. Nason, C. Oleari, and E. Re, NLO single-top production matched with shower in POWHEG: s- and t-channel contributions, JHEP 0909 (2009) 111, arXiv:0907.4076
- (23) R. Frederix, E. Re, and P. Torrielli, Single-top t-channel hadroproduction in the four-flavour scheme with POWHEG and aMC@NLO, JHEP 1209 (2012) 130, arXiv:1207.5391
- (24) C. Oleari and L. Reina, W +- b production in POWHEG, JHEP 1108 (2011) 061, arXiv:1105.4488
- (25) H.-L. Lai et al., New parton distributions for collider physics, Phys. Rev. D82 (2010) 074024, arXiv:1007.2241
- (26) T. Sjostrand, S. Mrenna, and P. Z. Skands, A Brief Introduction to PYTHIA 8.1, Comput. Phys. Commun. 178 (2008) 852, arXiv:0710.3820
- (27) J. Alwall et al., MadGraph 5 : Going Beyond, JHEP 1106 (2011) 128, arXiv:1106.0522
- (28) J. Pumplin et al., New generation of parton distributions with uncertainties from global QCD analysis, JHEP 0207 (2002) 012, arXiv:hep-ph/0201195
- (29) J. M. Campbell and R. Ellis, MCFM for the Tevatron and the LHC, Nucl. Phys. Proc. Suppl. 205-206 (2010) 10, arXiv:1007.3492
- (30) M. Cacciari, G. P. Salam, and G. Soyez, FastJet User Manual, Eur. Phys. J. C72 (2012) 1896, arXiv:1111.6097
- (31) LHCb Collaboration, R. Aaij et al., Inclusive and production in the forward region at TeV, JHEP 1206 (2012) 058, arXiv:1204.1620
- (32) Particle Data Group, J. Beringer et al., Review of Particle Physics (RPP), Phys. Rev. D86 (2012) 010001
- (33) Combination of ATLAS and CMS results on the mass of the top-quark using up to 4.9 fb-1 of TeV LHC data, Tech. Rep. ATLAS-CONF-2013-102, CERN, Geneva, Sep, 2013
- (34) S. Alekhin, J. Blumlein, and S. Moch, Parton Distribution Functions and Benchmark Cross Sections at NNLO, Phys. Rev. D86 (2012) 054009, arXiv:1202.2281
- (35) ZEUS Collaboration, H1 Collaboration, A. Cooper-Sarkar, PDF Fits at HERA, PoS EPS-HEP2011 (2011) 320, arXiv:1112.2107
- (36) A. Martin, W. Stirling, R. Thorne, and G. Watt, Parton distributions for the LHC, Eur. Phys. J. C63 (2009) 189, arXiv:0901.0002
- (37) R. D. Ball et al., Impact of Heavy Quark Masses on Parton Distributions and LHC Phenomenology, Nucl. Phys. B849 (2011) 296, arXiv:1101.1300
- (38) M. Whalley, D. Bourilkov, and R. Group, The Les Houches accord PDFs (LHAPDF) and LHAGLUE, arXiv:hep-ph/0508110
- (39) LHC Higgs Cross Section Working Group, S. Dittmaier et al., Handbook of LHC Higgs Cross Sections: 1. Inclusive Observables, arXiv:1101.0593
- (40) R. D. Ball et al., Parton Distribution Benchmarking with LHC Data, JHEP 1304 (2013) 125, arXiv:1211.5142
- (41) NNPDF Collaboration, R. D. Ball et al., Reweighting NNPDFs: the W lepton asymmetry, Nucl. Phys. B849 (2011) 112, arXiv:1012.0836
- (42) F. De Lorenzi, Parton Distribution Function sensitivity studies using electroweak processes at LHCb, arXiv:1011.4260
- (43) R. D. Ball et al., Reweighting and Unweighting of Parton Distributions and the LHC W lepton asymmetry data, Nucl. Phys. B855 (2012) 608, arXiv:1108.1758
- (44) G. Watt and R. Thorne, Study of Monte Carlo approach to experimental uncertainty propagation with MSTW 2008 PDFs, JHEP 1208 (2012) 052, arXiv:1205.4024
- (45) CDF Collaboration, T. Aaltonen et al., Measurement of the top quark forward-backward production asymmetry and its dependence on event kinematic properties, Phys. Rev. D87 (2013) 092002, arXiv:1211.1003
- (46) CDF Collaboration, T. A. Aaltonen et al., Measurement of the leptonic asymmetry in ttbar events produced in ppbar collisions at sqrt(s)=1.96 TeV, Phys. Rev. D 88, 072003 (2013) , arXiv:1308.1120
- (47) D0 Collaboration, V. M. Abazov et al., Measurement of the asymmetry in angular distributions of leptons produced in dilepton ttbar final states in collisions at TeV, arXiv:1308.6690
- (48) D0 Collaboration, V. M. Abazov et al., Forward-backward asymmetry in the distribution of leptons in events, http://www-d0.fnal.gov/Run2Physics/WWW/results/prelim/TOP/T98/T98.pdf, 2013
- (49) Measurement of the top quark pair production charge asymmetry in proton-proton collisions at TeV using the ATLAS detector, Tech. Rep. ATLAS-CONF-2013-078, CERN, Geneva, Jul, 2013
- (50) CMS Collaboration, S. Chatrchyan et al., Inclusive and differential measurements of the charge asymmetry in proton-proton collisions at 7 TeV, Phys. Lett. B717 (2012) 129, arXiv:1207.0065
- (51) CMS Collaboration, Measurement of the ttbar charge asymmetry with lepton+jets events at 8 TeV, Tech. Rep. CMS-PAS-TOP-12-033, CERN, Geneva, 2013
- (52) Measurement of the production cross-section in collisions at TeV using events with -tagged jets, Tech. Rep. ATLAS-CONF-2013-097, CERN, Geneva, Sep, 2013
- (53) LHCb Collaboration, R. Aaij et al., Absolute luminosity measurements with the LHCb detector at the LHC, JINST 7 (2012) P01010, arXiv:1110.2866
- (54) H.-C. Cheng, I. Low, and L.-T. Wang, Top partners in little Higgs theories with T-parity, Phys. Rev. D74 (2006) 055001, arXiv:hep-ph/0510225
- (55) K. Agashe et al., LHC Signals from Warped Extra Dimensions, Phys. Rev. D77 (2008) 015003, arXiv:hep-ph/0612015
- (56) S. Matsumoto, M. M. Nojiri, and D. Nomura, Hunting for the Top Partner in the Littlest Higgs Model with T-parity at the CERN LHC, Phys. Rev. D75 (2007) 055006, arXiv:hep-ph/0612249
- (57) A. Belyaev, C.-R. Chen, K. Tobe, and C.-P. Yuan, Phenomenology of littlest Higgs model with parity: including effects of odd fermions, Phys. Rev. D74 (2006) 115020, arXiv:hep-ph/0609179
- (58) A. Freitas and D. Wyler, Phenomenology of mirror fermions in the littlest Higgs model with T-parity, JHEP 0611 (2006) 061, arXiv:hep-ph/0609103
- (59) P. Meade and M. Reece, Top partners at the LHC: Spin and mass measurement, Phys. Rev. D74 (2006) 015010, arXiv:hep-ph/0601124
- (60) J. Thaler and L.-T. Wang, Strategies to Identify Boosted Tops, JHEP 0807 (2008) 092, arXiv:0806.0023
- (61) M. M. Nojiri and M. Takeuchi, Study of the top reconstruction in top-partner events at the LHC, JHEP 0810 (2008) 025, arXiv:0802.4142