Computer simulations reveal complex distribution of haemodynamic forces in a mouse retina model of angiogenesis
Abstract
angiogenesis, mouse, retina, blood flow, simulation, shear stress, image-based, lattice-Boltzmann There is currently limited understanding of the role played by haemodynamic forces on the processes governing vascular development. One of many obstacles to be overcome is being able to measure those forces, at the required resolution level, on vessels only a few micrometres thick. In the current paper, we present an in silico method for the computation of the haemodynamic forces experienced by murine retinal vasculature (a widely used vascular development animal model) beyond what is measurable experimentally. Our results show that it is possible to reconstruct high-resolution three-dimensional geometrical models directly from samples of retinal vasculature and that the lattice-Boltzmann algorithm can be used to obtain accurate estimates of the haemodynamics in these domains. We generate flow models from samples obtained at postnatal days (P) 5 and 6. Our simulations show important differences between the flow patterns recovered in both cases, including observations of regression occurring in areas where wall shear stress gradients exist. We propose two possible mechanisms to account for the observed increase in velocity and wall shear stress between P5 and P6: i) the measured reduction in typical vessel diameter between both time points, ii) the reduction in network density triggered by the pruning process. The methodology developed herein is applicable to other biomedical domains where microvasculature can be imaged but experimental flow measurements are unavailable or difficult to obtain.
1 Introduction
Despite recent advances in vascular biology, the mechanisms underpinning vascular development remain poorly understood. It is therefore crucial to gain further insight into the mechanisms governing the formation of complex vascular networks and their response to external stimuli. The translation of these results holds the key to the improvement of therapies modulating vascular patterning and sprouting for the treatment of stroke, ischaemia, retinopathies or cancer, the leading cause of death worldwide.
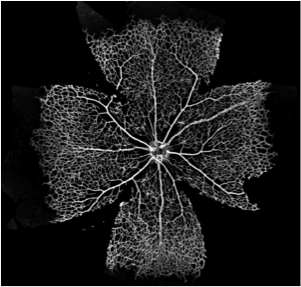
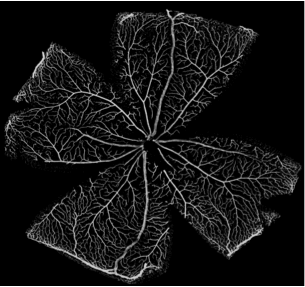
One of the pressing questions in the field is establishing how primitive vessel networks remodel into a hierarchically branched and functionally perfused network of arteries, arterioles, capillaries, and venules (Figure 1). In recent years, the main molecular mechanisms regulating endothelial cell behaviour during vessel formation have been elucidated using experimental techniques (Jones et al.,, 2006; Potente et al.,, 2011). However, important challenges remain: i) understanding how cell-level mechanisms integrate to give rise to systems-level behaviour and, ii) understanding the impact in vascular patterning of the interplay between cellular molecular regulation and haemodynamic forces (i.e. vascular mechanotransduction). These problems are hard to address due to the multiscale and multiphysics nature of the processes involved. Systems-level behaviour arises from highly non-linear, tightly coupled interactions between subprocesses at different spatial and temporal scales. Furthermore, it has been recently proposed (Bentley et al.,, 2013) that a tighter integration between experimental and computational work is required in order to tackle these questions. Working in a feedback loop, computational models should be capable of generating new hypotheses, rather than merely reproducing experimental data. In turn, experiments should provide new biological insights based on these hypotheses and help to further refine computational models.
 |
 |
Multiple animal models have been proposed for the study of vascular development. Examples include the mouse retinal and embryonic vasculature (Geudens and Gerhardt,, 2011), zebrafish vasculature (Lawson and Weinstein,, 2002; Siekmann and Lawson,, 2007), and hyaloid vasculature (Lobov et al.,, 2005). In recent years, there has been increasing interest in the development of in silico models for the close inspection of certain vascular developmental aspects. To date, most work concerning simulation of retinal haemodynamics for the study of vascular mechanotransduction (see Section 22.3 for a review) has suffered from a number of limitations including: i) limited availability of spatial information due to the use of low resolution imaging modalities, ii) oversimplification of the haemodynamics by considering the retinal plexus to be a network of one-dimensional vessel segments, and iii) unavailability of the computer code developed. We believe that the model simplifications cited, although appropriate in some applications, may fail to capture complex flow patterns important for understanding the interplay between molecular regulation and haemodynamics during development. Hence, in the current work we introduce a computational workflow — and make the source code available — aimed at generating in silico estimates of the haemodynamic forces acting on samples of mouse retinal vasculature imaged during development, typically within the first postnatal week. The workflow involves the following steps. First, high-resolution scanning confocal microscope images are obtained and segmented in order to generate a binary mask of the vessel lumen. Second, luminal centrelines and radii are computed in a process known as skeletonisation. Next, three-dimensional (3D) models of the luminal surface are reconstructed based on the computed skeleton. Finally blood flow simulations are run in order to obtain estimates of blood velocity and wall shear stress with an open source highly-parallel computational fluid dynamics (CFD) solver, known as HemeLB (Mazzeo and Coveney,, 2008).
The purpose of this paper is therefore three-fold. First, to describe the computational methods developed and to survey the literature for data not accessible in our experiments but necessary for model set-up. Second, to validate our methods in simplified scenarios where analytical solutions are known. Third, to present and to analyse simulations in order to gain insight into the dynamics of retinal blood flow during development. The paper is structured as follows. In Section 2, we survey the literature for previously proposed models of retinal flow and for the experimental data necessary to set up our simulations. Next, in Section 3 we present the methods used for image processing and 3D model reconstruction as well as the validation methodology adopted. Section 4 presents the main results on model reconstruction, validation, and a set of simulations on the reconstructed 3D models. Finally, Section 5 summarises the main contributions of the work and outlines the areas where we plan to apply the computational pipeline developed.
2 Retinal vascular structure and flow
2.1 Vascular structure and its development
Angiogenesis defines the formation of new blood vessels from pre-existing ones and can be split into two distinct phases: sprouting and remodelling. During sprouting, new vessels form and invade avascular ischaemic areas, where tissues experience hypoxia and nutrient deprivation. This process is modulated by the secretion of various growth factors, including vascular endothelial growth factor (VEGF), through a cascade of signalling events. The end point of this phase is the formation of a highly branched and poorly perfused network of capillary connections. Remodelling is responsible for the creation of a hierarchically branched and efficient vascular tree, containing defined arteries and veins and an optimised vascular capillary network. A vital step during vascular remodelling is the removal of redundant vessel segments: vessel pruning. Importantly, angiogenesis is a very dynamic process occurring not only during development but also in adulthood (e.g. wound healing and tumour formation).
The neonatal mouse retina has become one of the main experimental models for the study of the mechanisms involved in blood vessel development and patterning (Fruttiger,, 2007; Uemura et al.,, 2006; Gariano and Gardner,, 2005). The mouse retina is avascular at birth and develops through a consistent series of events. Astrocytice (a type of glial cell) and neuron derived vascular endothelial growth factor A (VEGFA) stimulates sprouting angiogenesis from pre-existing blood vessels at the optic nerve. Under a gradient of VEGFA, vessels expand radially in the superficial layer of the retina, in a very characteristic pattern (Potente et al.,, 2011). It takes this process around 8 days to cover the entire surface of the mouse retina. Vascularisation of the superficial layer is followed by a second phase of sprouting, where endothelial cells from the superficial venous plexus sprout and penetrate the deeper layers of retina to form, firstly, a deep and, secondly, an intermediate capillary bed (Brown et al.,, 2005). The vascular plexus finally matures about 20 days after birth.
In the mature mouse retina, vessels are found to be predominantly arteriolar in the superficial layer and predominantly venular in the deep capillary bed (Paques,, 2003). The artery feeding the retina arrives at the optic disc and divides into radiating retinal arteries. These arteries, with luminal diameter of up to (Ninomiya and Inomata,, 2006), side branch into smaller arterioles at close to 90 degrees angles from the parent arteries. The arterioles ( in diameter (Ninomiya and Inomata,, 2006)) take a relative long course before abruptly changing direction to run towards the intermediate and subsequently deep capillary beds ( in diameter (Ninomiya and Inomata,, 2006)). Some authors (e.g. Paques, (2003)) have suggested that the superficial layer is mostly capillary-free with only a few direct connections between arteries and veins.
2.2 Haemodynamics
The relationship between haemodynamics and pathogenesis of various eye disorders has prompted researchers to analyse retinal blood flow in both basic and clinical research domains. Early examples are the work of Feke et al., (1989), who measured total retinal blood flow and its regional distribution in humans, and Alm and Bill, (1973) who studied blood flow rates in various tissues of the primate eye. Later advances in imaging techniques (e.g. optical coherence tomography and related modalities, laser Doppler velocimetry) have expanded our understanding of retinal haemodynamics. High resolution in vivo measurements of retinal flow have been obtained in various species: mouse (Brown et al.,, 2005), rat (Zhi et al.,, 2011), and human (White et al.,, 2003; Wang et al.,, 2009). Several authors (White et al.,, 2003; Yazdanfar,, 2003) presented evidence of the pulsatile nature of retinal blood flow despite early claims (Alm and Bill,, 1973) that only retinal arteries — and not veins — exhibit systolic to diastolic flow rate variations. Further developments enabled quantitative analysis of typical arterial and venous flow in both healthy (Wang et al.,, 2007) and diseased (Wang et al.,, 2009) human retinas as well as during development in mice (Brown et al.,, 2005). Table 1 compiles some of the measurements of murine and human retinal vessel diameter, velocity, and flow rate available in the literature.
| Authors | Species | Measurement | Value |
| Wright et al., (2012) | 30-week-old C57BL/6J male mice | Arterial diameter | |
| Venous diameter | |||
| Mean arterial velocity | |||
| Mean venous velocity | |||
| Arterial flow rate | |||
| Venous flow rate | |||
| Zhi et al., (2012) | 22-week-old BTBR female mice | Arterial flow rate | |
| Venous flow rate | |||
| Wright et al., (2009) | 11–12-week-old C57BL/6 male mice | Arterial diameter | |
| Venous diameter | |||
| Mean arterial velocity | |||
| Mean venous velocity | |||
| Ninomiya and Inomata, (2006) | Four-month-old mice (ex vivo) | Arterial diameter | up to |
| Capillary diameter | |||
| Wang et al., (2007) | Adult human | Arterial diameter | |
| Arterial peak velocity | |||
| Arterial flow rate | |||
| Venous diameter | |||
| Venous peak velocity | |||
| Venous flow rate |
Of relevance to our study is the work by Brown et al., (2005), who obtained in vivo measurements of blood flow in various parts of the murine eye including the retina from birth to postnatal day (P) 16. Table 2 presents some of their findings. A clear trend of increase in retinal blood flow after P3 is observed. The authors attribute the large variability of the results (note standard deviation in Table 2) to the natural variation in the time course of the remodelling processes involved.
| Age | Velocity () | () | N |
|---|---|---|---|
| P0 | 0.32 | 0.09 | 5 |
| P1 | 0.71 | 0.29 | 7 |
| P2 | 1.22 | 0.29 | 6 |
| P3 | 0.58 | 0.07 | 6 |
| P4 | 4.62 | 1.09 | 5 |
| P5 | 2.70 | 0.94 | 5 |
| P6 | 5.26 | 1.79 | 5 |
| P7 | 4.30 | 0.07 | 6 |
| P8 | 3.53 | 1.73 | 7 |
| P10 | 2.79 | 0.14 | 5 |
| P12 | 4.35 | 0.52 | 5 |
Several authors have also studied the typical pressure difference driving flow in the retina, the so-called ocular perfusion pressure (OPP). The pressure at the central retinal artery is often approximated with mean arterial pressure (MAP) measurements at eye level (e.g. carotid arterial pressure (Wright and Harris,, 2008), subclavian artery (Hardy et al.,, 1994)). The effective venous pressure is considered equivalent to the intraocular pressure (IOP) (Kiel,, 2010). Table 3 summarises the values of MAP and IOP reported by several authors. OPP values of are consistently reported across species. Finally, retinal blood flow is known to be autoregulated by the modulation of retinal vessel compliance in response to MAP and IOP variations (Paques,, 2003; Hardy et al.,, 1994).
| Authors | Species | MAP () | IOP () |
|---|---|---|---|
| Wright and Harris, (2008) | 16-week-old mice | 68.2 2.0 | 11.6 0.4 |
| Hardy et al., (1994) | 1–3-day-old piglets | 70 6 | 13 2 |
From a rheological point of view, blood is a shear-thinning fluid (i.e. its viscosity is a decreasing function of shear rate (Chien,, 1970)). When flowing at sufficiently large shear rates (typically greater than ) blood can be modelled as a Newtonian fluid (i.e. constant viscosity) with no significant effect on the simulated haemodynamics (see Bernabeu et al., (2013) and references therein). However, at lower shear rates, viscosity quickly increases due to e.g. red blood cell (RBC) aggregation. Our work concerns simulation of blood flood in small arterioles, venules, and capillaries where shear rate is expected to be lower than the aforementioned threshold. In fact, Nagaoka and Yoshida, (2006) measured shear rates as low as in the venules of the human retina. Therefore, we will take the shear-thinning properties of blood into account in order to improve the fidelity of the shear stress computed in our model. Table 4 compiles some of the values of murine blood viscosity as a function of shear rate available in the literature. Other rheological properties derived from the presence of RBCs, such as the Fåhræus-Lindqvist effect (see e.g. (Pries et al.,, 1996)), will not be considered.
| Authors | Animals | Shear rate () | Viscosity () |
| Vogel et al., (2003) | 4–7-month-old C57Bl/6 mice | 2 | 18.94 (average, ) |
| 5 | 13.33 | ||
| 11 | 10.52 | ||
| 23 | 8.07 | ||
| 45 | 6.31 | ||
| 90 | 5.96 | ||
| 225 | 4.91 | ||
| 450 | 3.85 | ||
| Windberger et al., (2003) | 4–8-month-old BALB/c mice | 0.7 | 13.36 (median, ) |
| 2.4 | 10.56 | ||
| 94 | 4.87 |
Finally, we note that experimental data on haemorheology changes during development is limited. Windberger et al., (2005) observed a steady increase in blood viscosity in rabbits and cats from fetal stages to adulthood. The changes were more pronounced within lower shear rates regimes: from to at and from to at during the first 30 days of life in rabbits. Due to the scarcity of available data, we will not include this effect in our model.
The experimental data on pressure distributions and haemorheological properties surveyed in this section will be used to set up our flow simulations. This is done due to the impossibility of obtaining such information directly from our experimental model. The data summarised in Table 1 will be used to validate our experimental measurements of vessel diameter and in silico estimates of blood velocity and flow rate. We now turn our attention to previously proposed models of retinal blood flow.
2.3 Previous modelling and simulation studies
In one of the earliest works on retinal haemodynamics modelling and simulation, Ganesan et al., (2010) state that “although a relatively good understanding of the retinal anatomy and vascular network has been developed through extensive studies […] there is a complete lack of numerical modeling of retinal circulation in the literature”. In the same study, an image-based network model of the retinal vasculature was developed. The location and length of non-capillary vessel segments was extracted from confocal microscopy images of flat-mounted mouse retinas and a rule-based network model used to approximate the structure of the capillary bed. The haemodynamics were greatly simplified by considering vessel segments to be straight with piece-wise constant radius and flow to be laminar (i.e. a 1D network model), therefore neglecting complex fluid patterns that may appear in curved vessels even at low Reynolds numbers (Siggers and Waters,, 2005). Their results show that wall shear stress in the capillaries stays mainly in the range with values as high as . These magnitudes are substantially higher and with a much greater spread than those reported in the main retinal arteries and veins. Prior to this work, Liu et al., (2009) also developed an image-based retinal flow model for the study of oxygen transportation in the retina. In this case, only a subset of the retinal vasculature (i.e. an artery and a number of branching arterioles) was reconstructed from a healthy human fundus camera image. The two-dimensional steady-state Navier-Stokes equations were solved in the domain. The model was used to predict pressure drops and oxygen saturation distribution.
More recently, Chen et al., (2012) developed a mathematical model of blood flow in the zebrafish larvae midbrain vasculature (another typical model for the study of vascular development). The morphology of the vessel network was recovered from in vivo images at different developmental stages. Haemodynamics were also modelled using a laminar flow in straight circular pipe simplification. Both steady and pulsatile flow were compared with little difference in overall dynamics. The flow model was in turn coupled to a phenomenological model of changes in vessel diameter as a function of shear stress (without any explicit mechanism of endothelial cell migration). The resulting coupled model was used to predict vessel pruning in several zebrafish larvae midbrain vasculature samples with a reported 75% accuracy. These results support the hypothesis that wall shear stress is a major factor in vessel pruning during angiogenesis.
Finally, Watson et al., (2012) developed a comprehensive model of murine retinal angiogenesis including cell migration during sprouting, blood flow, oxygen distribution, and the main chemotactic gradients involved in vessel development and pruning. In their work, vascular pruning was mainly driven by the downregulation of growth factors but no explicit mechanobiological mechanisms were considered. Blood flow simulation was also performed based on the 1D network simplification described above.
The articles cited in this section demonstrate increasing interest in the modelling and simulation of retinal haemodynamics. Computational models have been developed for human, mouse, and zebrafish retinal vasculature. A common application is the study of vascular development dynamics (angiogenesis in particular). In our opinion, the previous works, although seminal, share one or more of the following limitations: i) the choice of imaging modality only allows the recovery of a subset of the retinal vasculature, ii) flow dynamics are greatly simplified by the use of 1D or 2D approximations, and iii) the computer code developed is, to the best of our knowledge, not freely available. In the current work, we aim at developing an open source computational workflow for the generation of high resolution estimates of the haemodynamic forces experienced by murine retinal vasculature based on confocal microscope images. The following section describes the methodology employed.
3 Methods
3.1 Image processing and 3D model reconstruction
The preparation of retinal vascular plexus samples for imaging and analysis has been previously described in Franco et al., (2008). Briefly, plexus samples were collected from five and six-day-old wildtype mouse pups and fixed with 2% paraformaldehyde in phosphate buffered saline (PBS) for 5 hours at C, thereafter retinas were dissected in PBS. Blocking/permeabilisation was performed using Claudio’s blocking buffer (CBB), consisting of 1% FBS (Gibco), 3% BSA (Sigma), 0.5% triton X100 (Sigma), 0.01% Na deoxycholate (Sigma), 0,02% Na Azide (Sigma) in PBS pH=7.4 for 2-4 hours at C on a rocking platform. Samples were stained with endothelial luminal marker (ICAM2) and incubated at the desired concentration in 1:1 CBB:PBS at C overnight in a rocking platform. Finally, retinas were mounted on slides using Vectashield mounting medium (Vector Labs, H-1000) and imaged with a Carl Zeiss LSM780 scanning confocal microscope (Zeiss). Manual preprocessing of the plexus image was performed with Photoshop CS5 (Adobe) in order to remove major imaging artefacts, allowing a simple thresholding method to be used to produce a binary image of the entire retinal plexus segment. The binary image was skeletonised using a MATLAB (The MathWorks, Inc.) interface111http://www.mathworks.co.uk/matlabcentral/fileexchange/27543-skeletonization-using-voronoi to the Voronoi tessellation algorithm implemented in the QHull library (Barber et al.,, 1996). The radius at each Voronoi vertex was calculated from the maximum inscribed circle in two-dimensions.
Based on the image skeleton and computed radii, a three-dimensional triangulation of the plexus luminal surface was generated by assuming vessel circular cross section with the VTK (Schroeder et al.,, 2003) and VMTK (Antiga et al.,, 2008) libraries. This simplification is made based on our own histological analysis and on the observations of Feke et al., (1989), who cite histological evidence of retinal arteries being circular in cross-section while retinal veins exhibit a higher tendency towards flattening. The volume contained within the surface was discretised as a regular grid in order to generate the computational domain necessary for simulation (see next section for details). All the scripts developed are freely available at https://github.com/UCL/BernabeuInterface2014.
3.2 Simulation setup
Let be a three-dimensional domain with boundary . The CFD package HemeLB (Mazzeo and Coveney,, 2008) was used to solve numerically the Navier Stokes equations for generalised Newtonian incompressible fluids. For and time :
| (1) | ||||
| (2) |
where is the density, is the velocity vector, is the pressure, is the deviatoric part of the stress tensor
| (3) | ||||
| (4) |
and is the dynamic viscosity which may depend on the shear rate , i.e. ,
| (5) |
where and summation over repeated indices is assumed. Note that in the case of Newtonian fluids, .
Let be the wall, inlet, and outlet portions of the domain boundary, respectively, such that . Equations (1)–(2) are closed with the following initial condition
| (6) |
and boundary conditions
| (7) | ||||||
| (8) | ||||||
| (9) |
(i.e. a pressure drop problem as formulated in Heywood et al., (1996); Formaggia et al., (2009)) where , , is the boundary normal vector and are the pressures at the inlet and outlet, respectively. HemeLB uses the lattice-Boltzmann (LB) algorithm (see Acknowledgements for a brief introduction) and runs efficiently on large scale high performance computing resources (Groen et al.,, 2013). HemeLB’s source code is available under LGPL licence and can be downloaded from http://ccs.chem.ucl.ac.uk/hemelb. Simulations were run either locally (Section 44.1) or on up to 5040 cores of ARCHER, UK National Supercomputing Service (Section 44.3, Acknowledgements, and 11)
Experimental measurements were used to derive a functional form for based on the Carreau-Yasuda (CY) mathematical model (see e.g. (Boyd et al.,, 2007)):
| (10) |
where , , and are empirically determined to fit a curve between regions of constant and . This model defines three rheological regimes: a Newtonian region of viscosity for low shear rate, followed by a shear-thinning region where decreases with ; finally, a second Newtonian region of viscosity is defined for high shear rates. Equation (10) was fitted to the data in Table 4 with the least squares algorithm implemented in the gnuplot graphing utility222Gnuplot 4.6.3, http://www.gnuplot.info giving the following results: , , , , . Figure 2 plots the data fit.
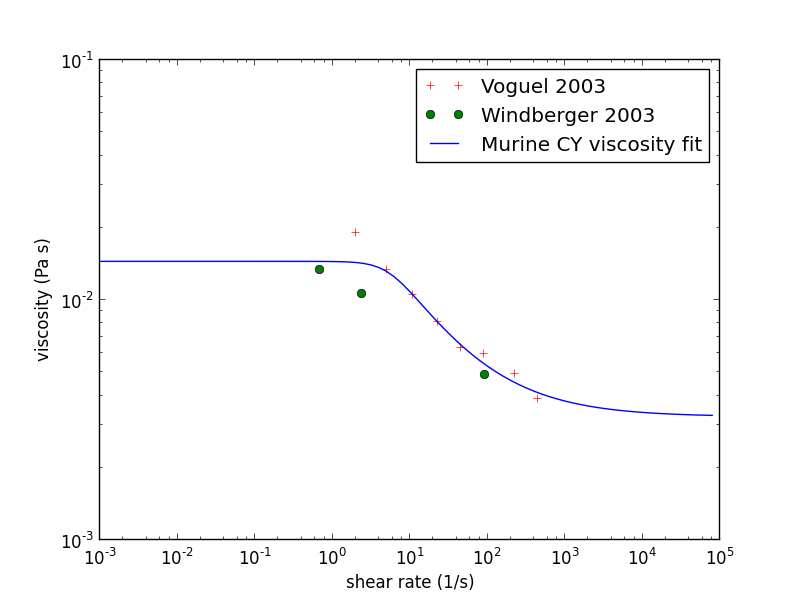
One of the many challenges when simulating blood flow in open domains — such as the subset of retinal vasculature that we present in Figure 5 — is the impact of the choice of inlet/outlet boundary conditions on the simulated haemodynamics. Ideally, one would use experimental measurements of flow rate and/or pressure in order to close the system. We could not obtain these data experimentally and relied on the data surveyed in Section 22.2. Pressures at the inlet and outlet were set to the values measured by Wright and Harris, (2008) and presented in Table 3: and , corresponding to the mean arterial pressure of the central retinal artery and vein, respectively.
The LB algorithm admits a number of different implementations of the no-slip boundary condition at the walls (see e.g. Lätt and Chopard, (2008); Nash et al., (2014) for surveys). We choose the method proposed by Bouzidi et al., (2001) based on previous validation work (Nash et al.,, 2014). In the current work, we perform further validation as described in the following section. Finally, we initialise the domain to a uniform density fluid at rest. The implications of this choice are discussed in Section 44.2.
3.3 Code verification methodology
In this study, we are interested in using HemeLB to simulate blood flow in a network of vessels of variable diameter, with differences of up to one order of magnitude (see Table 1). This is a challenging scenario since we must ensure that the spatial discretisation is fine enough to capture all the features in the capillaries and resolve flow accurately, while keeping the problem computationally tractable due to the large number of fluid sites arising from the discretisation of larger vessels. Furthermore, we are particularly interested in generating accurate estimates of wall shear stress in vessels that are typically not aligned with the Cartesian grid, which can be challenging for regular grid based methods. For example, Stahl et al., (2010) measured shear stress errors of up to 35% in the vicinity of the wall for non-lattice aligned channel flow with the LB algorithm and the so-called bounce-back implementation of the no-slip boundary condition (Ziegler,, 1993).
In the current section parameters are denoted with a tilde when given in lattice units and without when given in physical units. The LB timestep is used as a conversion factor for time and the voxel size for space such that e.g. diameter . We also introduce the LB relaxation parameter (which controls the viscosity in the lattice, for more details refer to Chen and Doolen, (1998))
| (11) |
where is the kinematic viscosity in lattice units
| (12) |
and in the version of LB employed.
In the absence of experimental flow measurements to compare against our computer simulations, we propose setting up a set of benchmark simulations that capture the main flow and domain characteristics and compare the results against known analytical solutions. We will restrict ourselves to the simulation of steady, Newtonian, and laminar flow in non-lattice aligned cylinders of diameter and length . The orientation of the cylinder is chosen pseudorandomly from the unit sphere, subject to the constraint that , . The value is
| (13) |
The laminar flow assumption is based on the Reynolds numbers reported in the literature for microcirculation (e.g. for arterioles, venules, and capillaries, respectively (Popel and Johnson,, 2005)). We choose in our validation. The steady and Newtonian flow assumptions are made to simplify the analytical solution of the benchmarks considered. Their implications are discussed in Section 44.1. Finally, a parabolic velocity profile with maximum velocity
| (14) |
is imposed at the inlet (Ladd,, 1994).
The purpose of our validation study is two-fold. First, to characterise the accuracy of the recovered haemodynamics as a function of the number of fluid sites across a given vessel. Second, to evaluate the accuracy of the computed wall shear stress given our choice of implementation of the no-slip boundary condition (Bouzidi et al.,, 2001), which has — to the best of our knowledge — not been done before.
In our first experiment, we compare the volumetric flow rate
| (15) |
integrated over a lattice aligned cross-sectional plane (defined by point and plane normal ) with the analytical solution of Hagen-Poiseuille flow in an infinite cylinder
| (16) |
for a range of values of diameter and relaxation time .
In the second experiment, we compare T with the — appropriately rotated — analytical solution of the Hagen-Poiseuille shear stress tensor in a cylinder of axis and radius assuming flow in the positive direction of the cylinder axis. For a given point in the domain such that , , it can be shown that
| (17) |
The tensor rotation is defined by the matrix ,
| (18) | ||||
| (19) | ||||
| (20) |
where is the magnitude of a vector, such that
| (21) |
4 Results and discussion
4.1 Code verification
Figure 3 plots the relative error in the simulated flow rate
| (22) |
as a function of the cylinder diameter.

We observe how the choice of greatly affects the accuracy of the simulated haemodynamics. In agreement with similar analyses in the literature (see e.g. Krüger et al., (2009)), the error is larger for values close to the stability threshold of and for values greater than 1. A region of excellent accuracy is located around . In that case, the relative error stays below 3% for all the values of studied. The ability to simulate correct flow dynamics in channels with only a few lattice sites across has gained the LB algorithm wide acceptance for the simulation of flow in complex domains and porous media (Aidun and Clausen,, 2010).
Figure 4 plots, for a range of values of , the computed and analytical solutions of the shear stress tensor (T and ) as well as the associated relative error
| (23) |
where is the Frobenius norm of an matrix
| (24) |
The choice of error norm in (23) ensures that error contributions given by individual components cannot compensate, hence being sensitive to rotation errors. We are mainly interested in the accuracy of the shear stress calculation in the vicinity of the vessel wall. Therefore, the results are presented for the subdomain defined by all the lattice sites with .


It can be observed how the recovered shear stress follows the expected pattern of monotonic increase from zero at the cylinder axis (results not shown here) to its maximum value at the wall. However, a certain deviation exists compared to the analytical solution. For values of , we observe a clear pattern of shear stress being overestimated in the region while being underestimated in . Panels 4(b), 4(d), and 4(f) quantify this error. We observe how the largest error in the domain always occurs at the cylinder wall and that it decreases as increases: from around 17% for to around 7% for . These results, with the Bouzidi et al., (2001) implementation of the no-slip boundary condition, represent a substantial improvement over the 35% error reported by Stahl et al., (2010) with the bounce-back method and , confirming the superiority of the former algorithm. More importantly, the wall shear stress is consistently underestimated and the error decreases for . Therefore, one could implement an a posteriori correction of the computed shear stress tensor based on this knowledge. Such a development is beyond the scope of the current paper and will be developed as part of a future study.
It is interesting to note that the errors in flow rate and shear stress are, to a large extent, decoupled. This is due to the characteristics of the LB algorithm as detailed in Acknowledgements. In our work we will define two rules for the accurate simulation of blood flow in our network of vessels of variable diameter. First, a minimum diameter of will be enforced throughout the domain. This will ensure that, for , the general flow patterns produced are accurate. Second, values of shear stress in regions of interest will only be considered valid if . The error estimates reported in Figure 3 will be taken into account in the presentation of our results.
Finally, we turn our attention to the implications of the use of a generalised Newtonian rheology model in our retinal flow simulations. In the current section we observed that minimises the error in the flow rate recovered. In the case of Newtonian fluids, regardless of the value of viscosity being simulated, one can choose such that Equation (11) yields the desired value of (this will obviously have an impact on computational cost). For generalised Newtonian fluids, becomes a function of and will take values in the range . In the rheology model presented in Section 33.2, , which would lead to impractical values of unless is chosen small enough. We will therefore choose the coefficient such that and . Based on the results in Figure 3, this choice will yield an error of less than 4% in the flow rate recovered for .
4.2 Model reconstruction
The vascular plexus of wildtype retinas was stained with the luminal membrane marker ICAM2 and images were acquired using a confocal microscope as described in Section 33.1. Figure 5 shows a region of interest in one of the imaged retinas. It contains, on either side, two arterial segments coming from the optic disc and connecting with a segment of a retinal vein (centre of the image) through a dense capillary network. It can be appreciated how the network is more mature (e.g. vessel identity, branching patterns) closer to the optic disc (bottom of the image) while its structure is much more primitive and less remodelled in the periphery closer to the sprouting front (top of the image). Figure 5 presents the results of the image segmentation process. The algorithm described in Section 33.1 is used to first create a binary mask separating the luminal area and background tissue and second extract the network skeleton and radii. The latter are used to reconstruct the 3D luminal surface under the assumption of vessel circular cross-section (see Section 33.1 for a discussion). Figure 5 shows the reconstructed surface. We refer to this model as P6A.
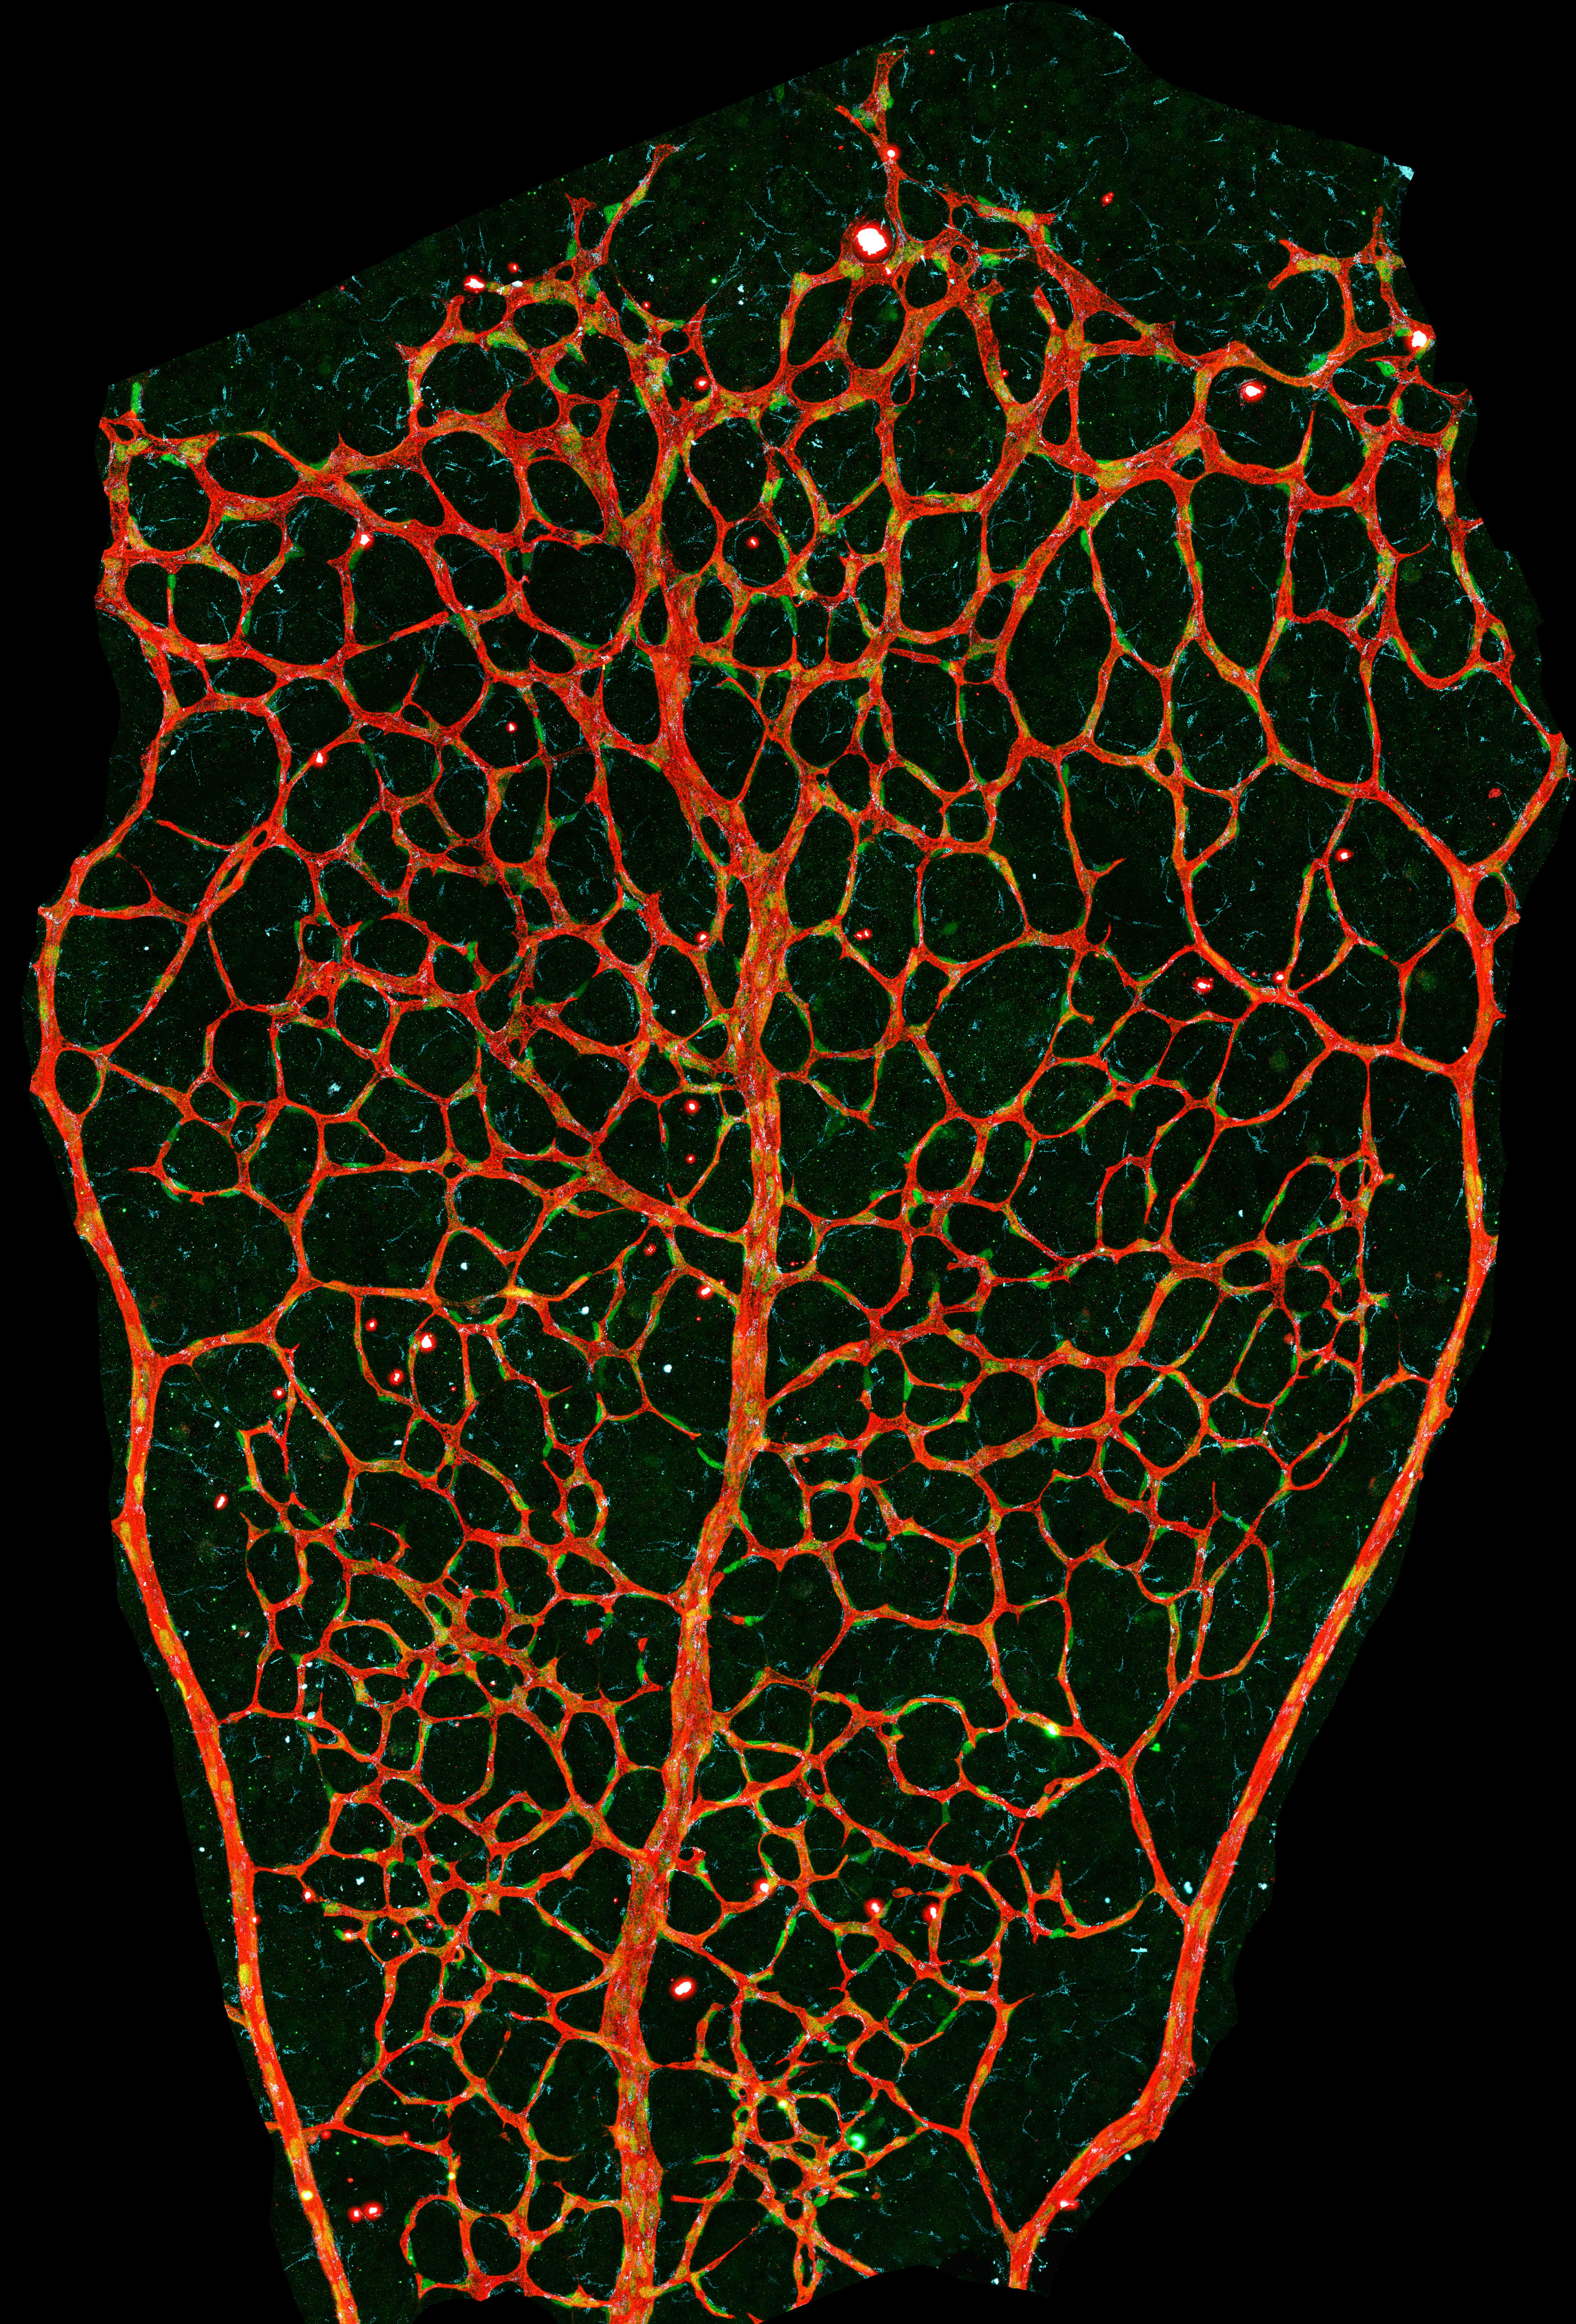
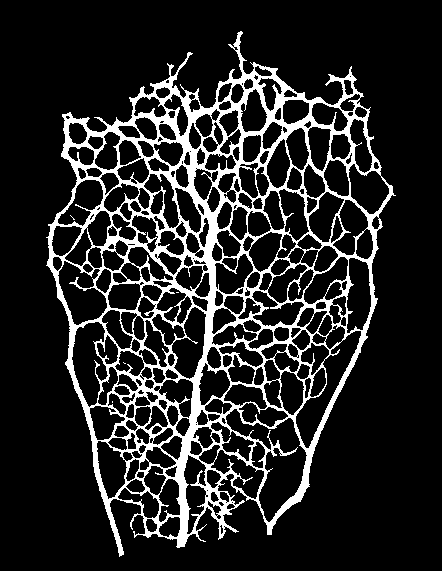
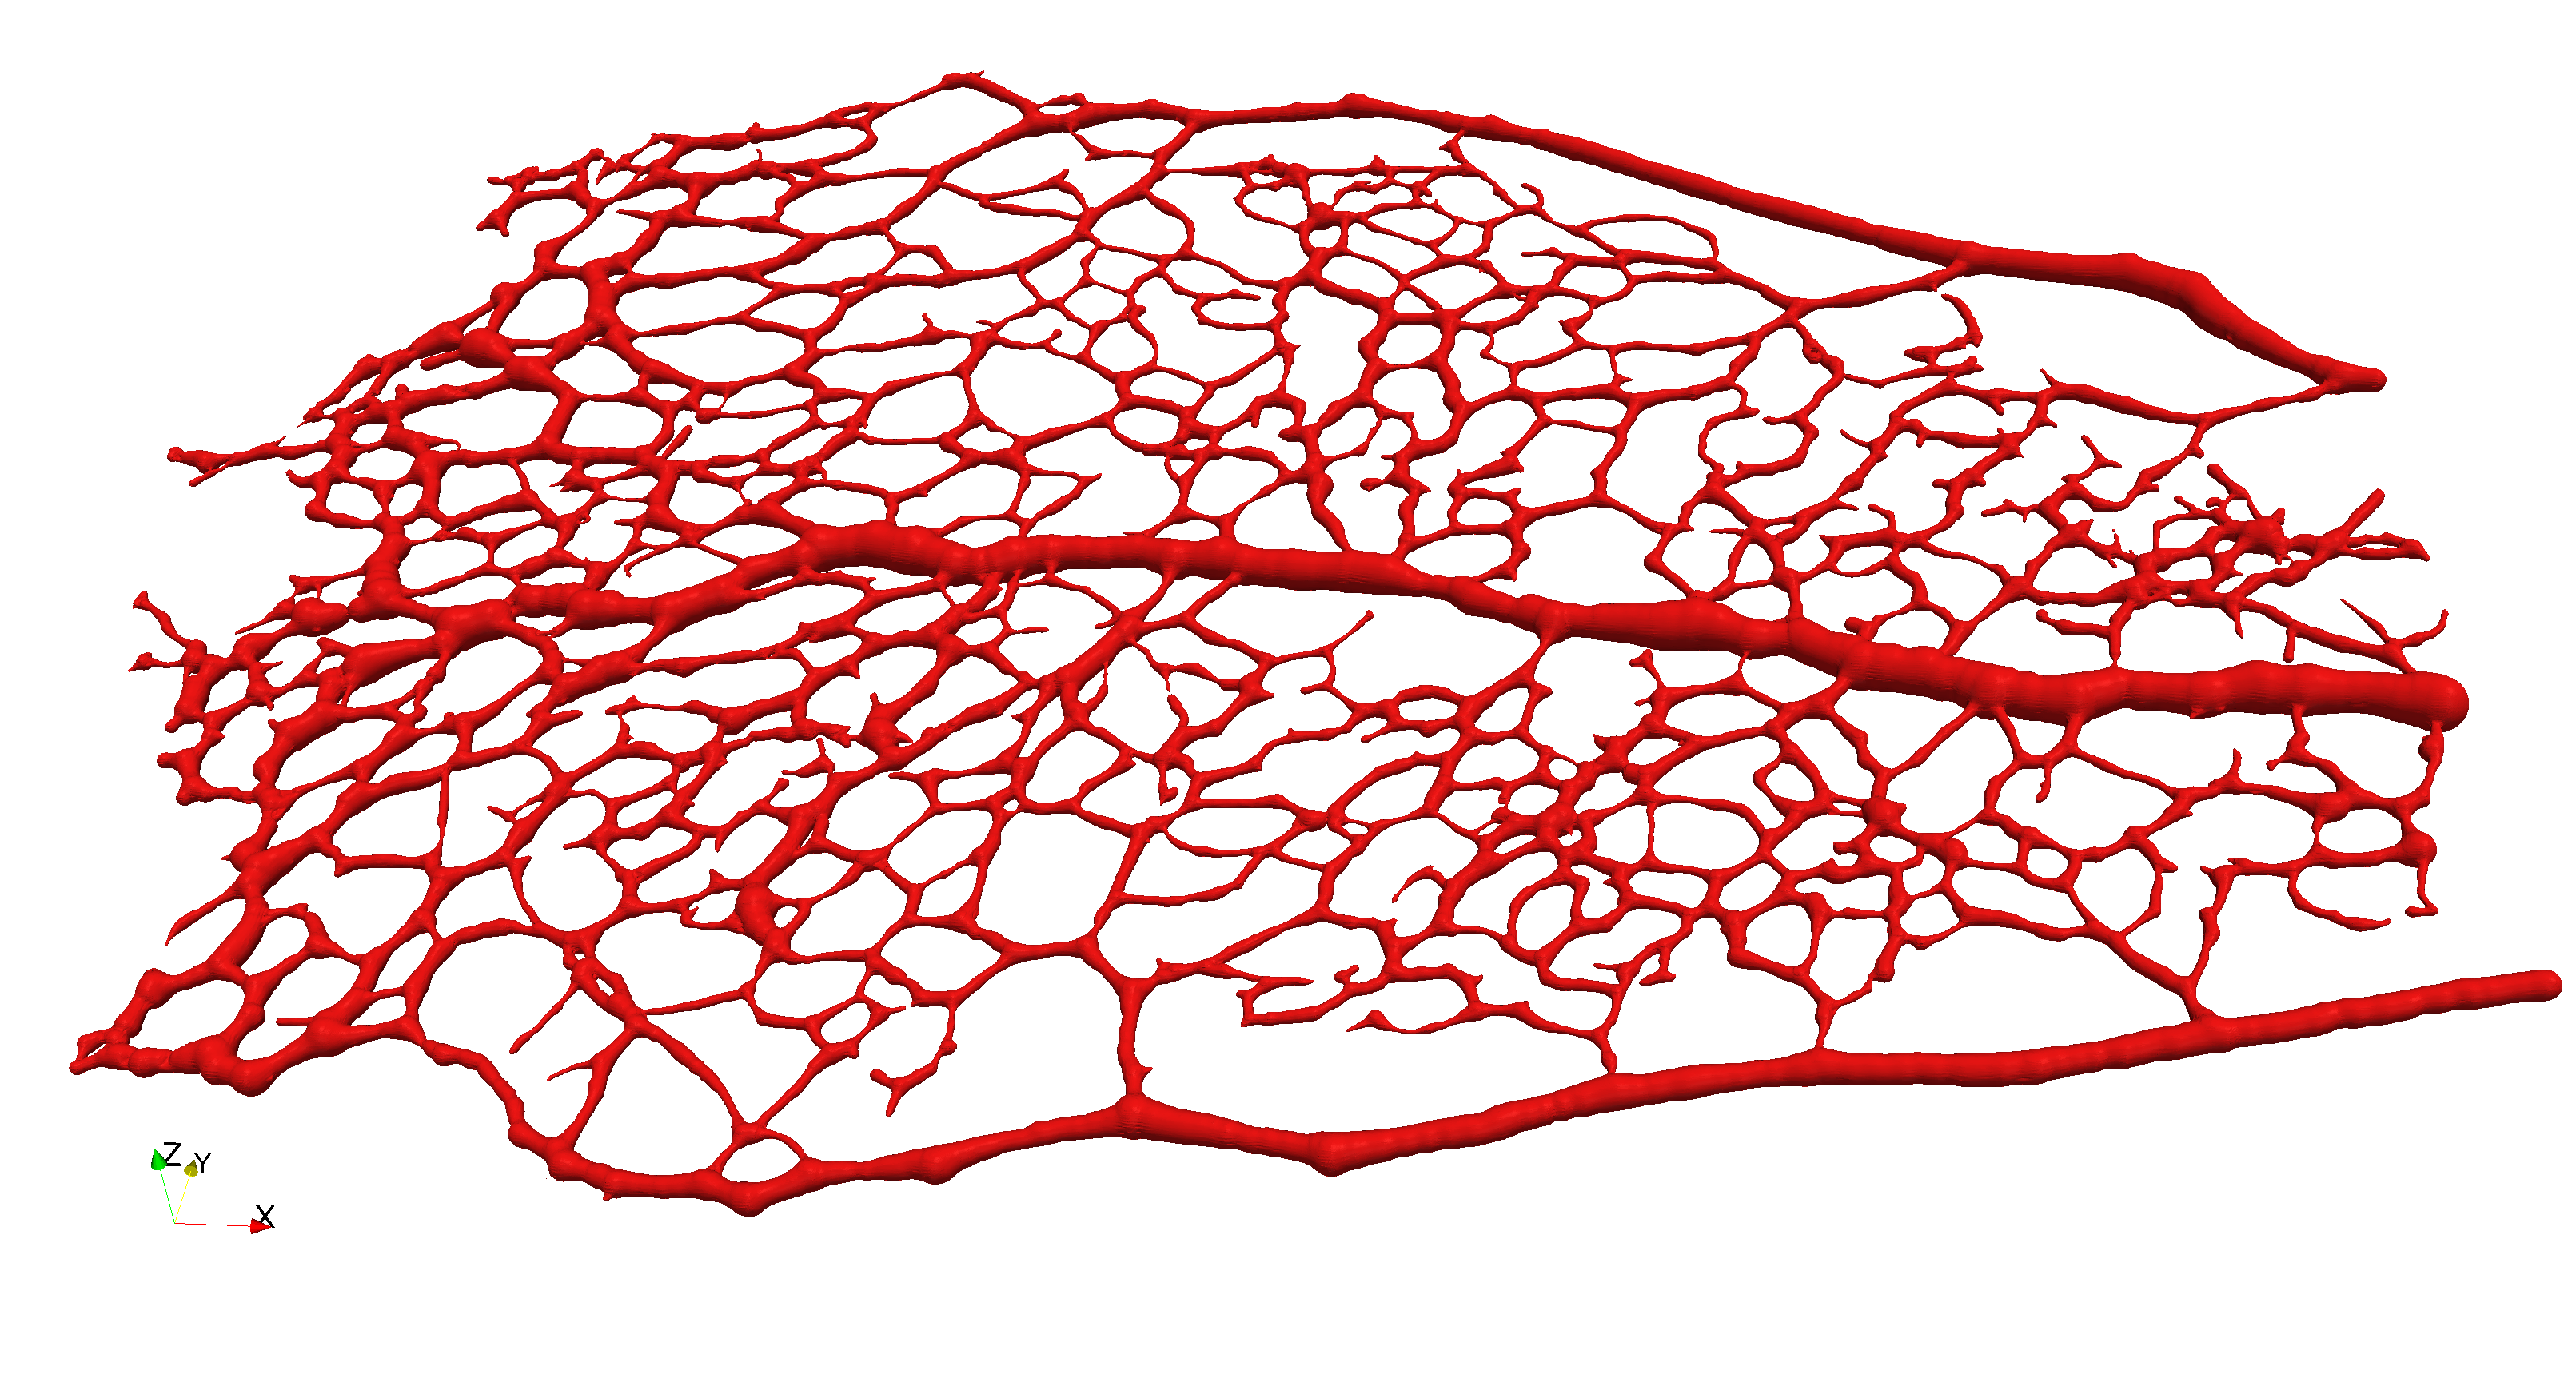
Figure 6 presents luminal surface binary masks for three additional P5 and P6 retinal plexuses. The same reconstruction algorithm is applied and the resulting models are referred to as P5A, P5B, and P6B, respectively.
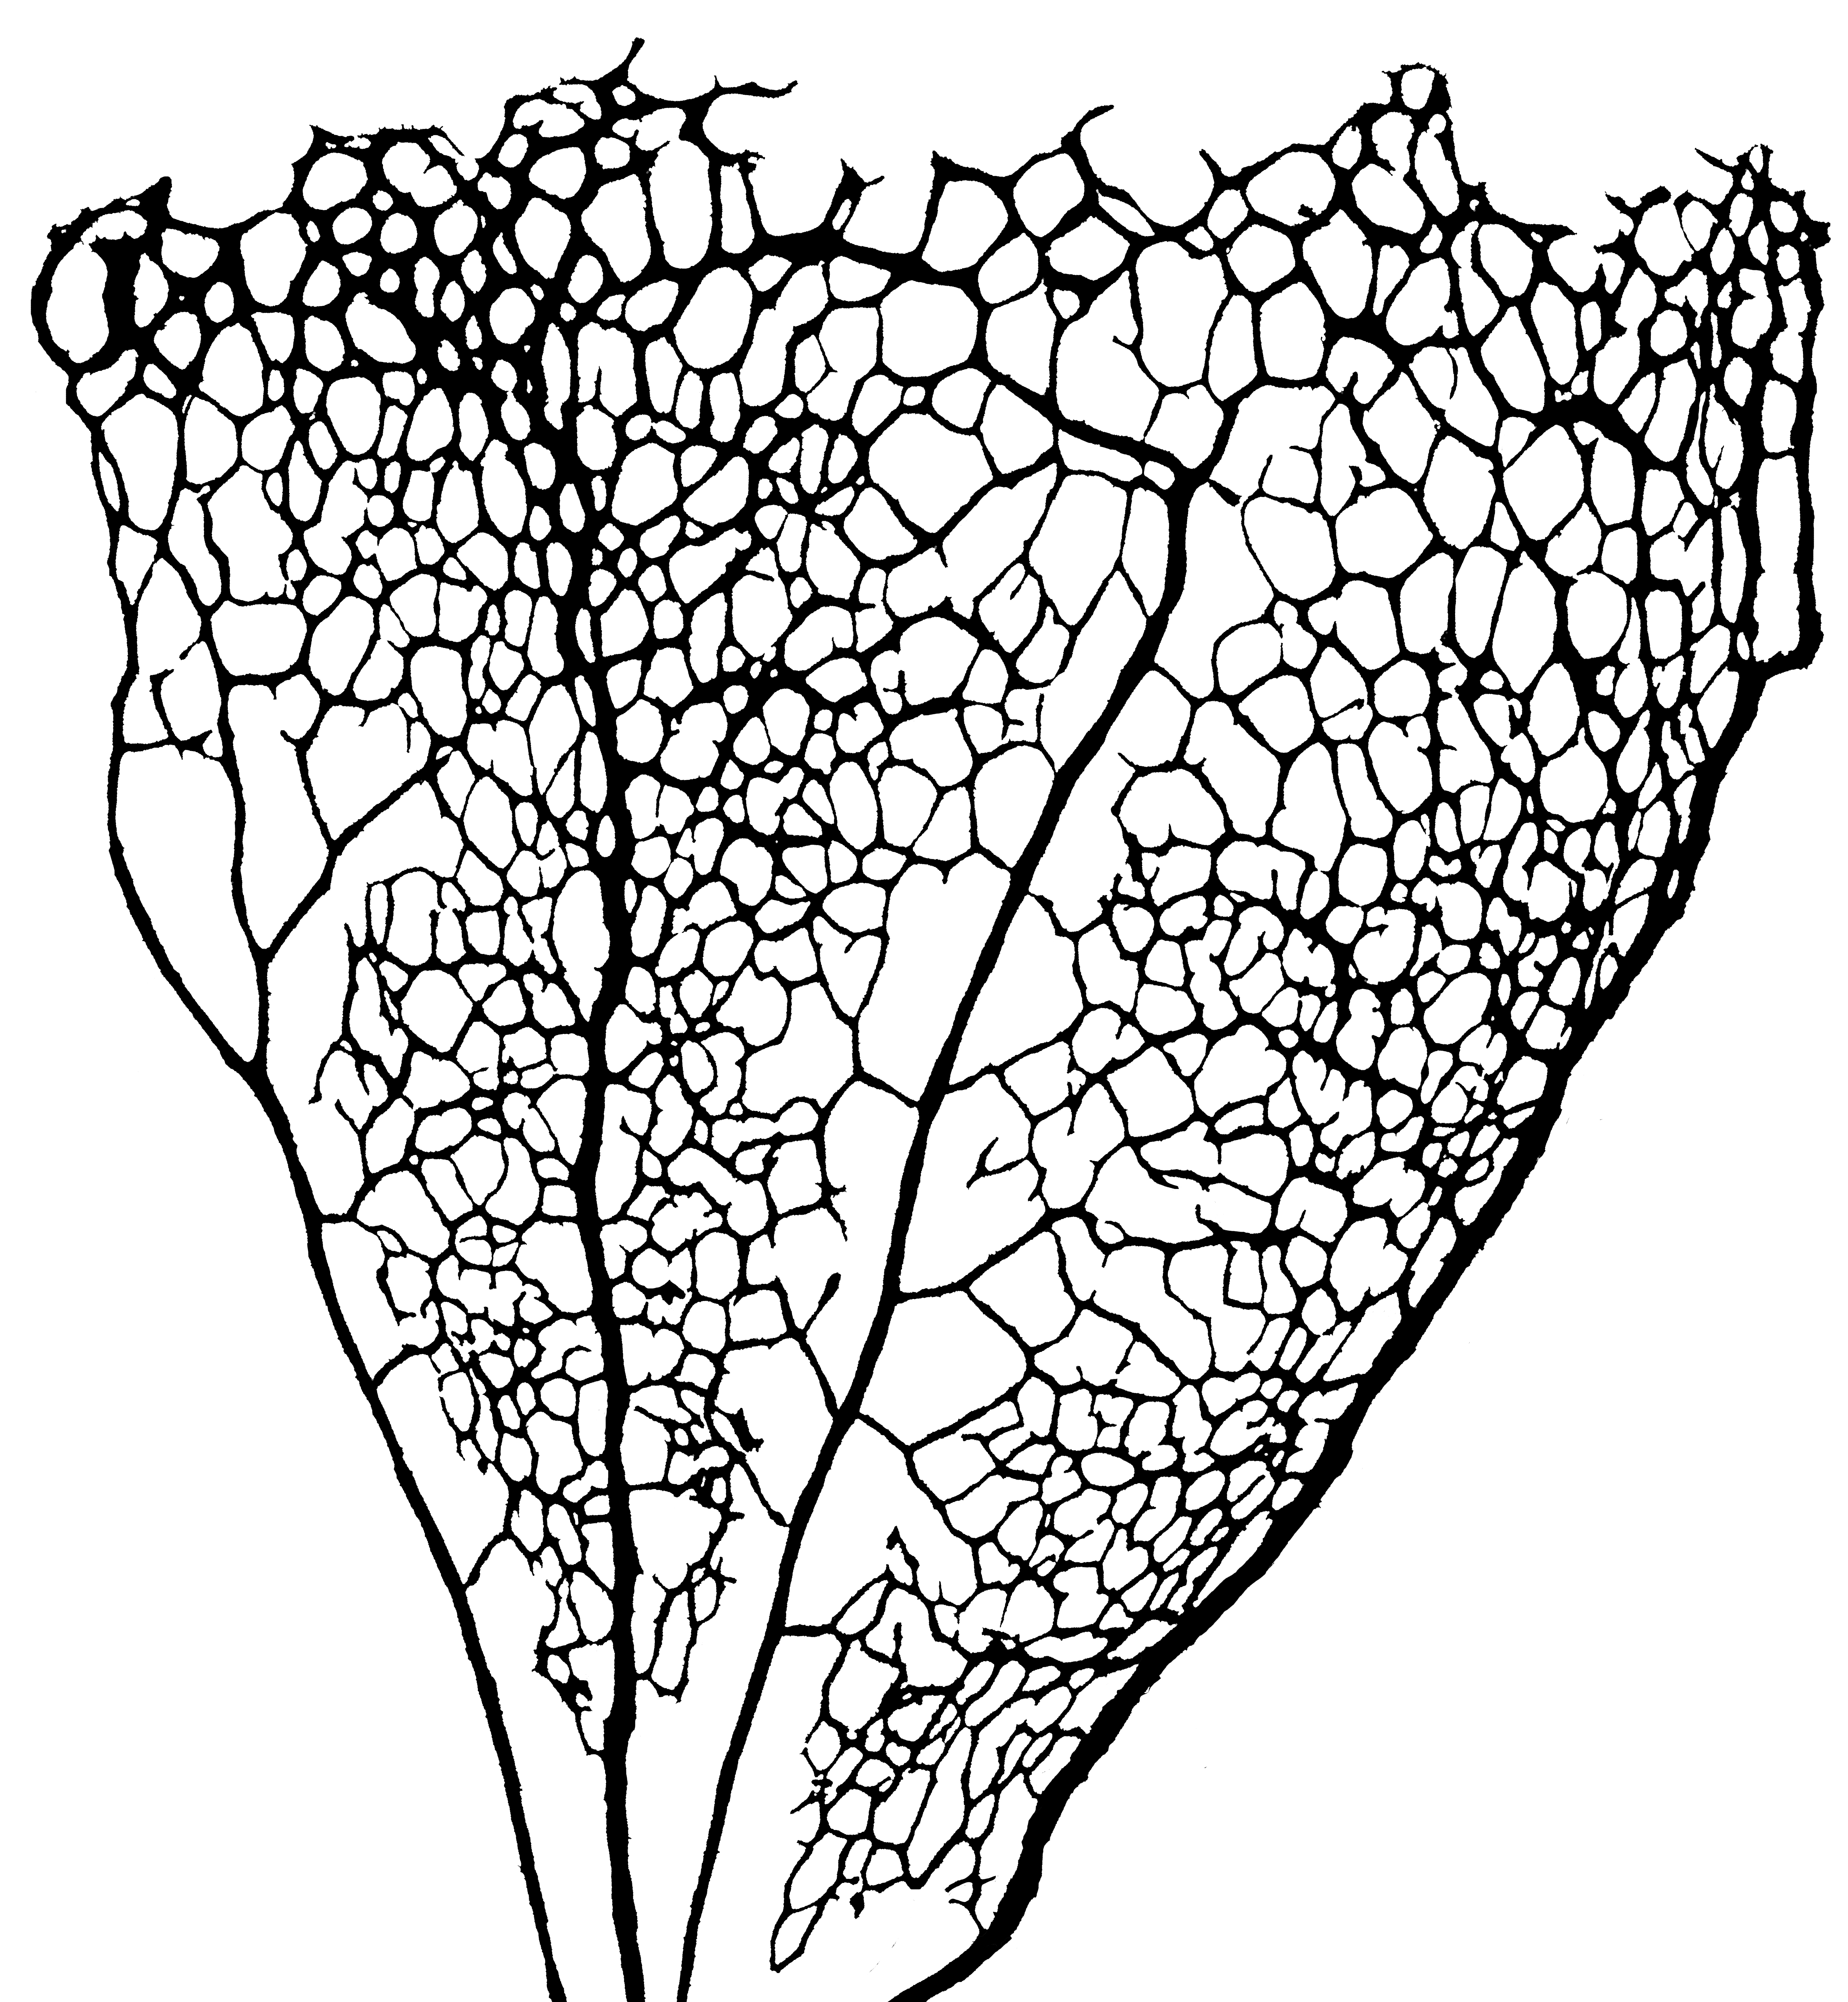
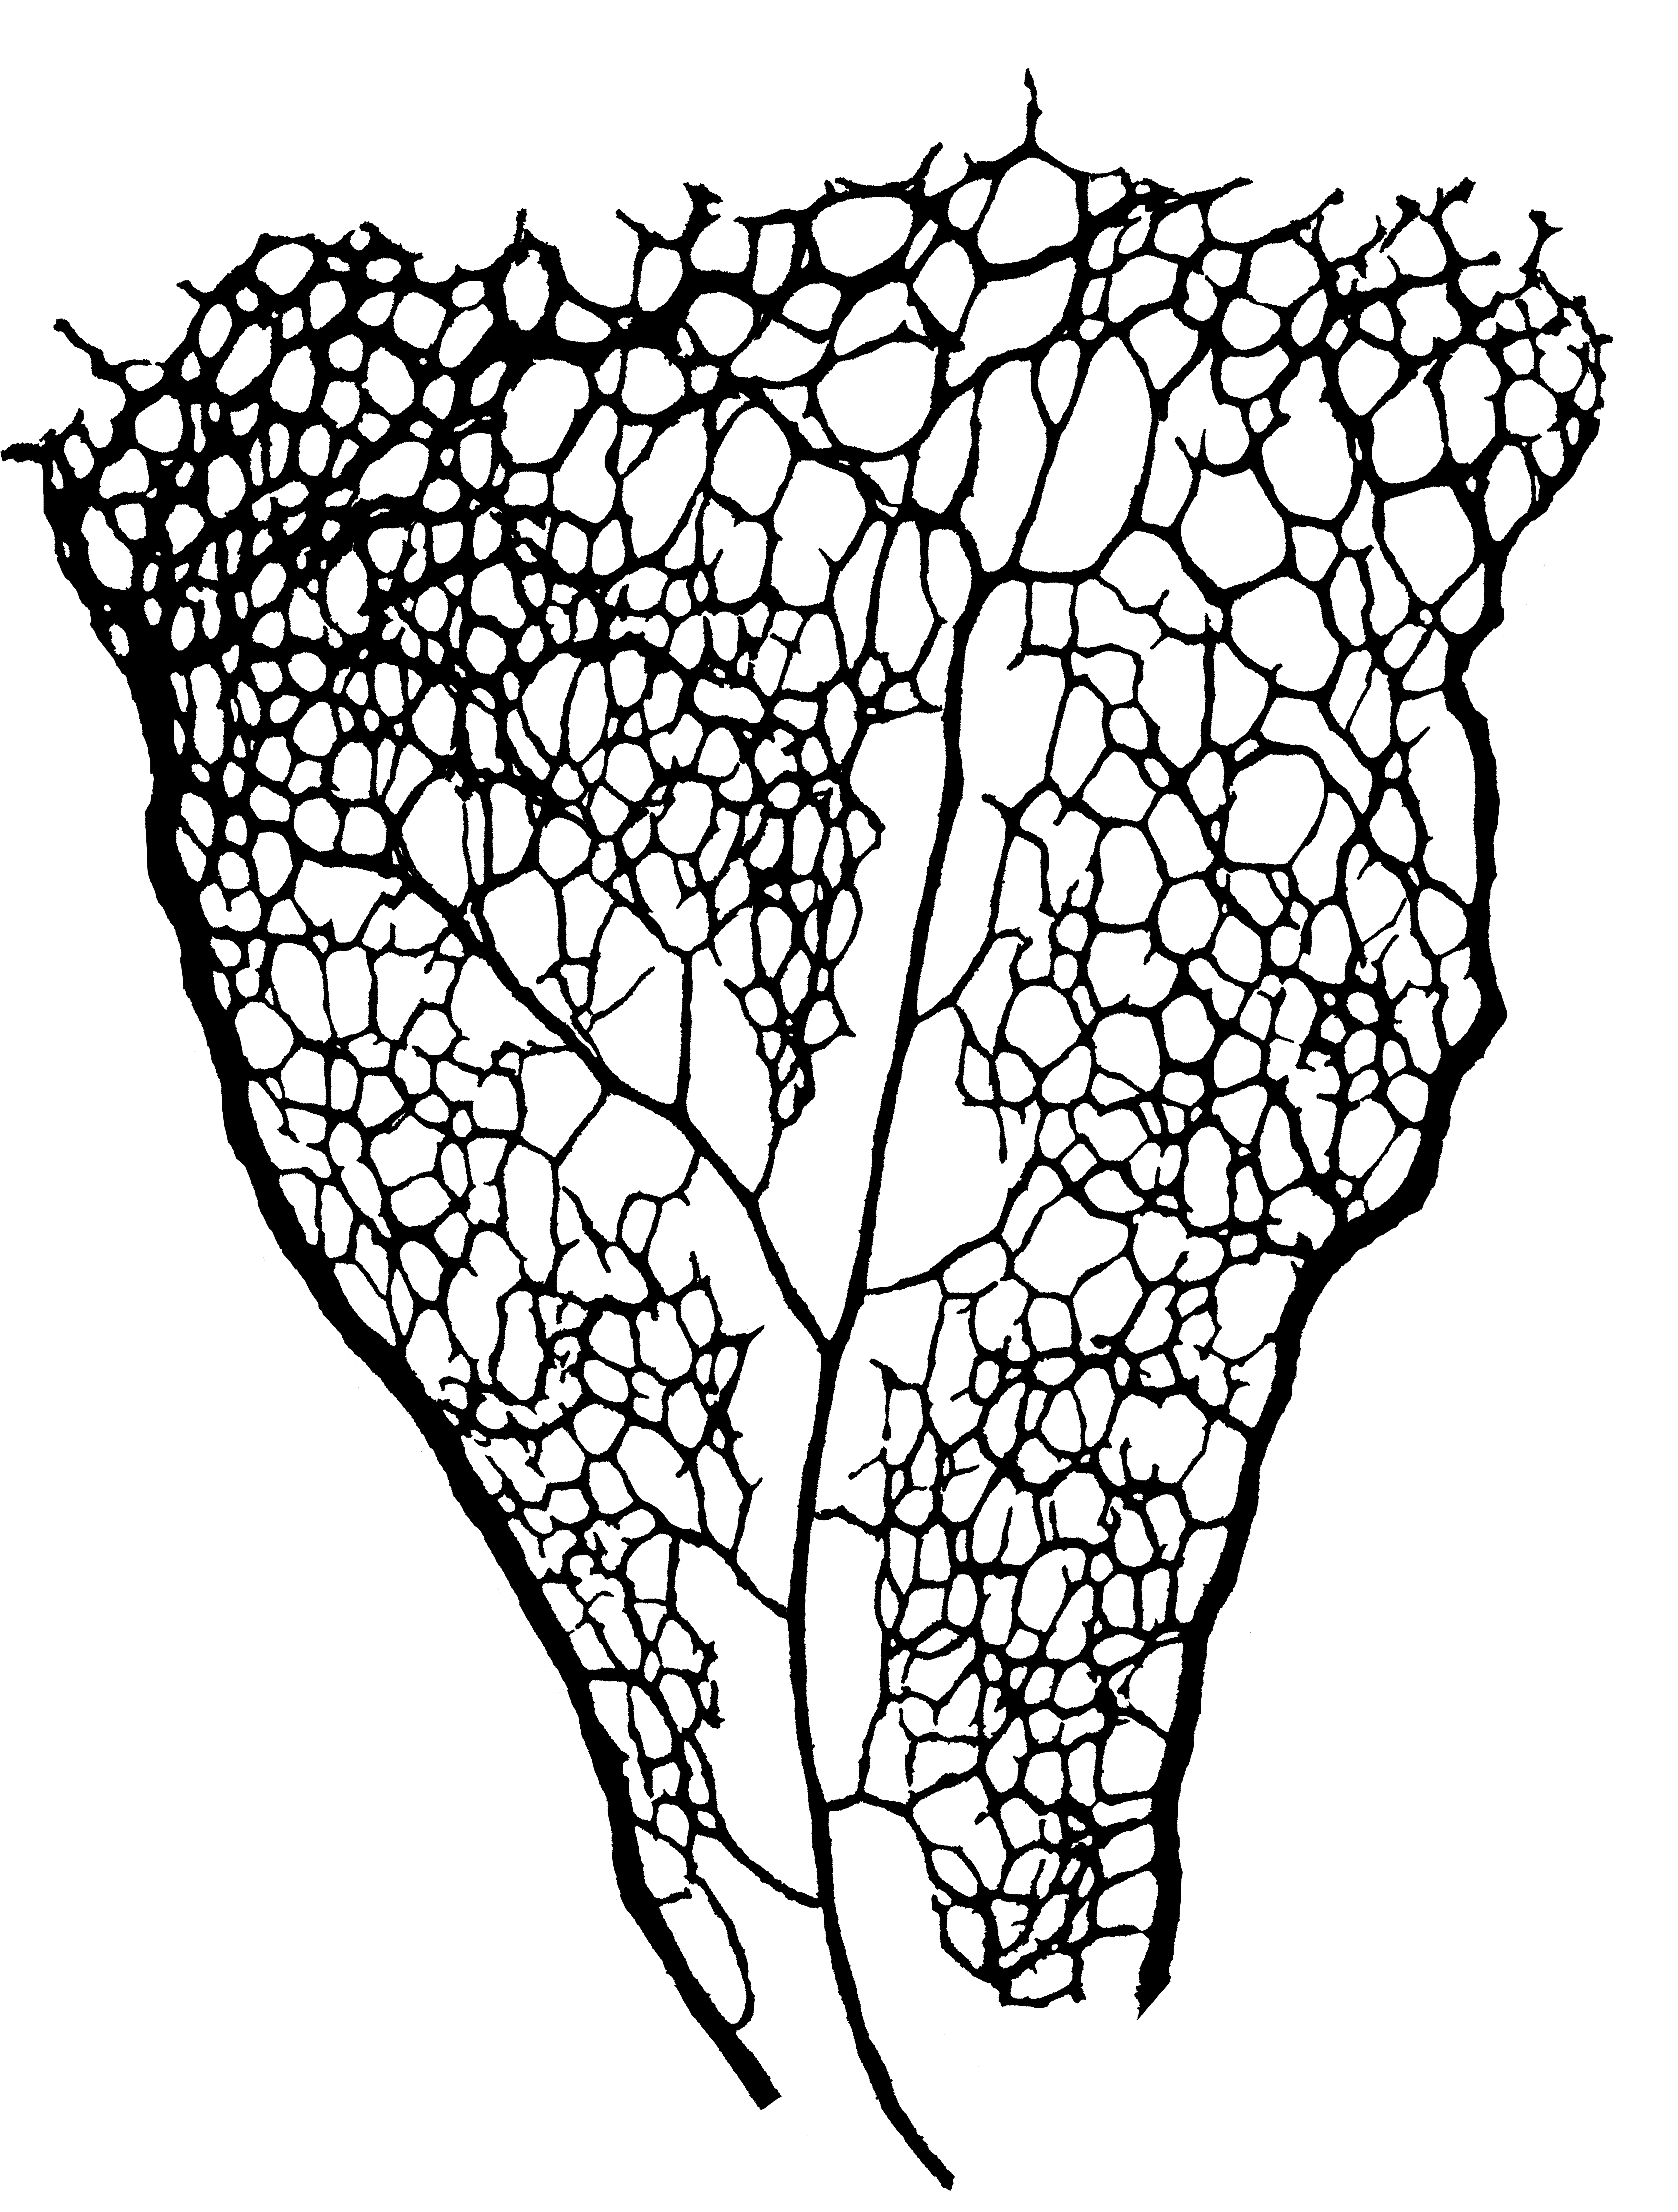
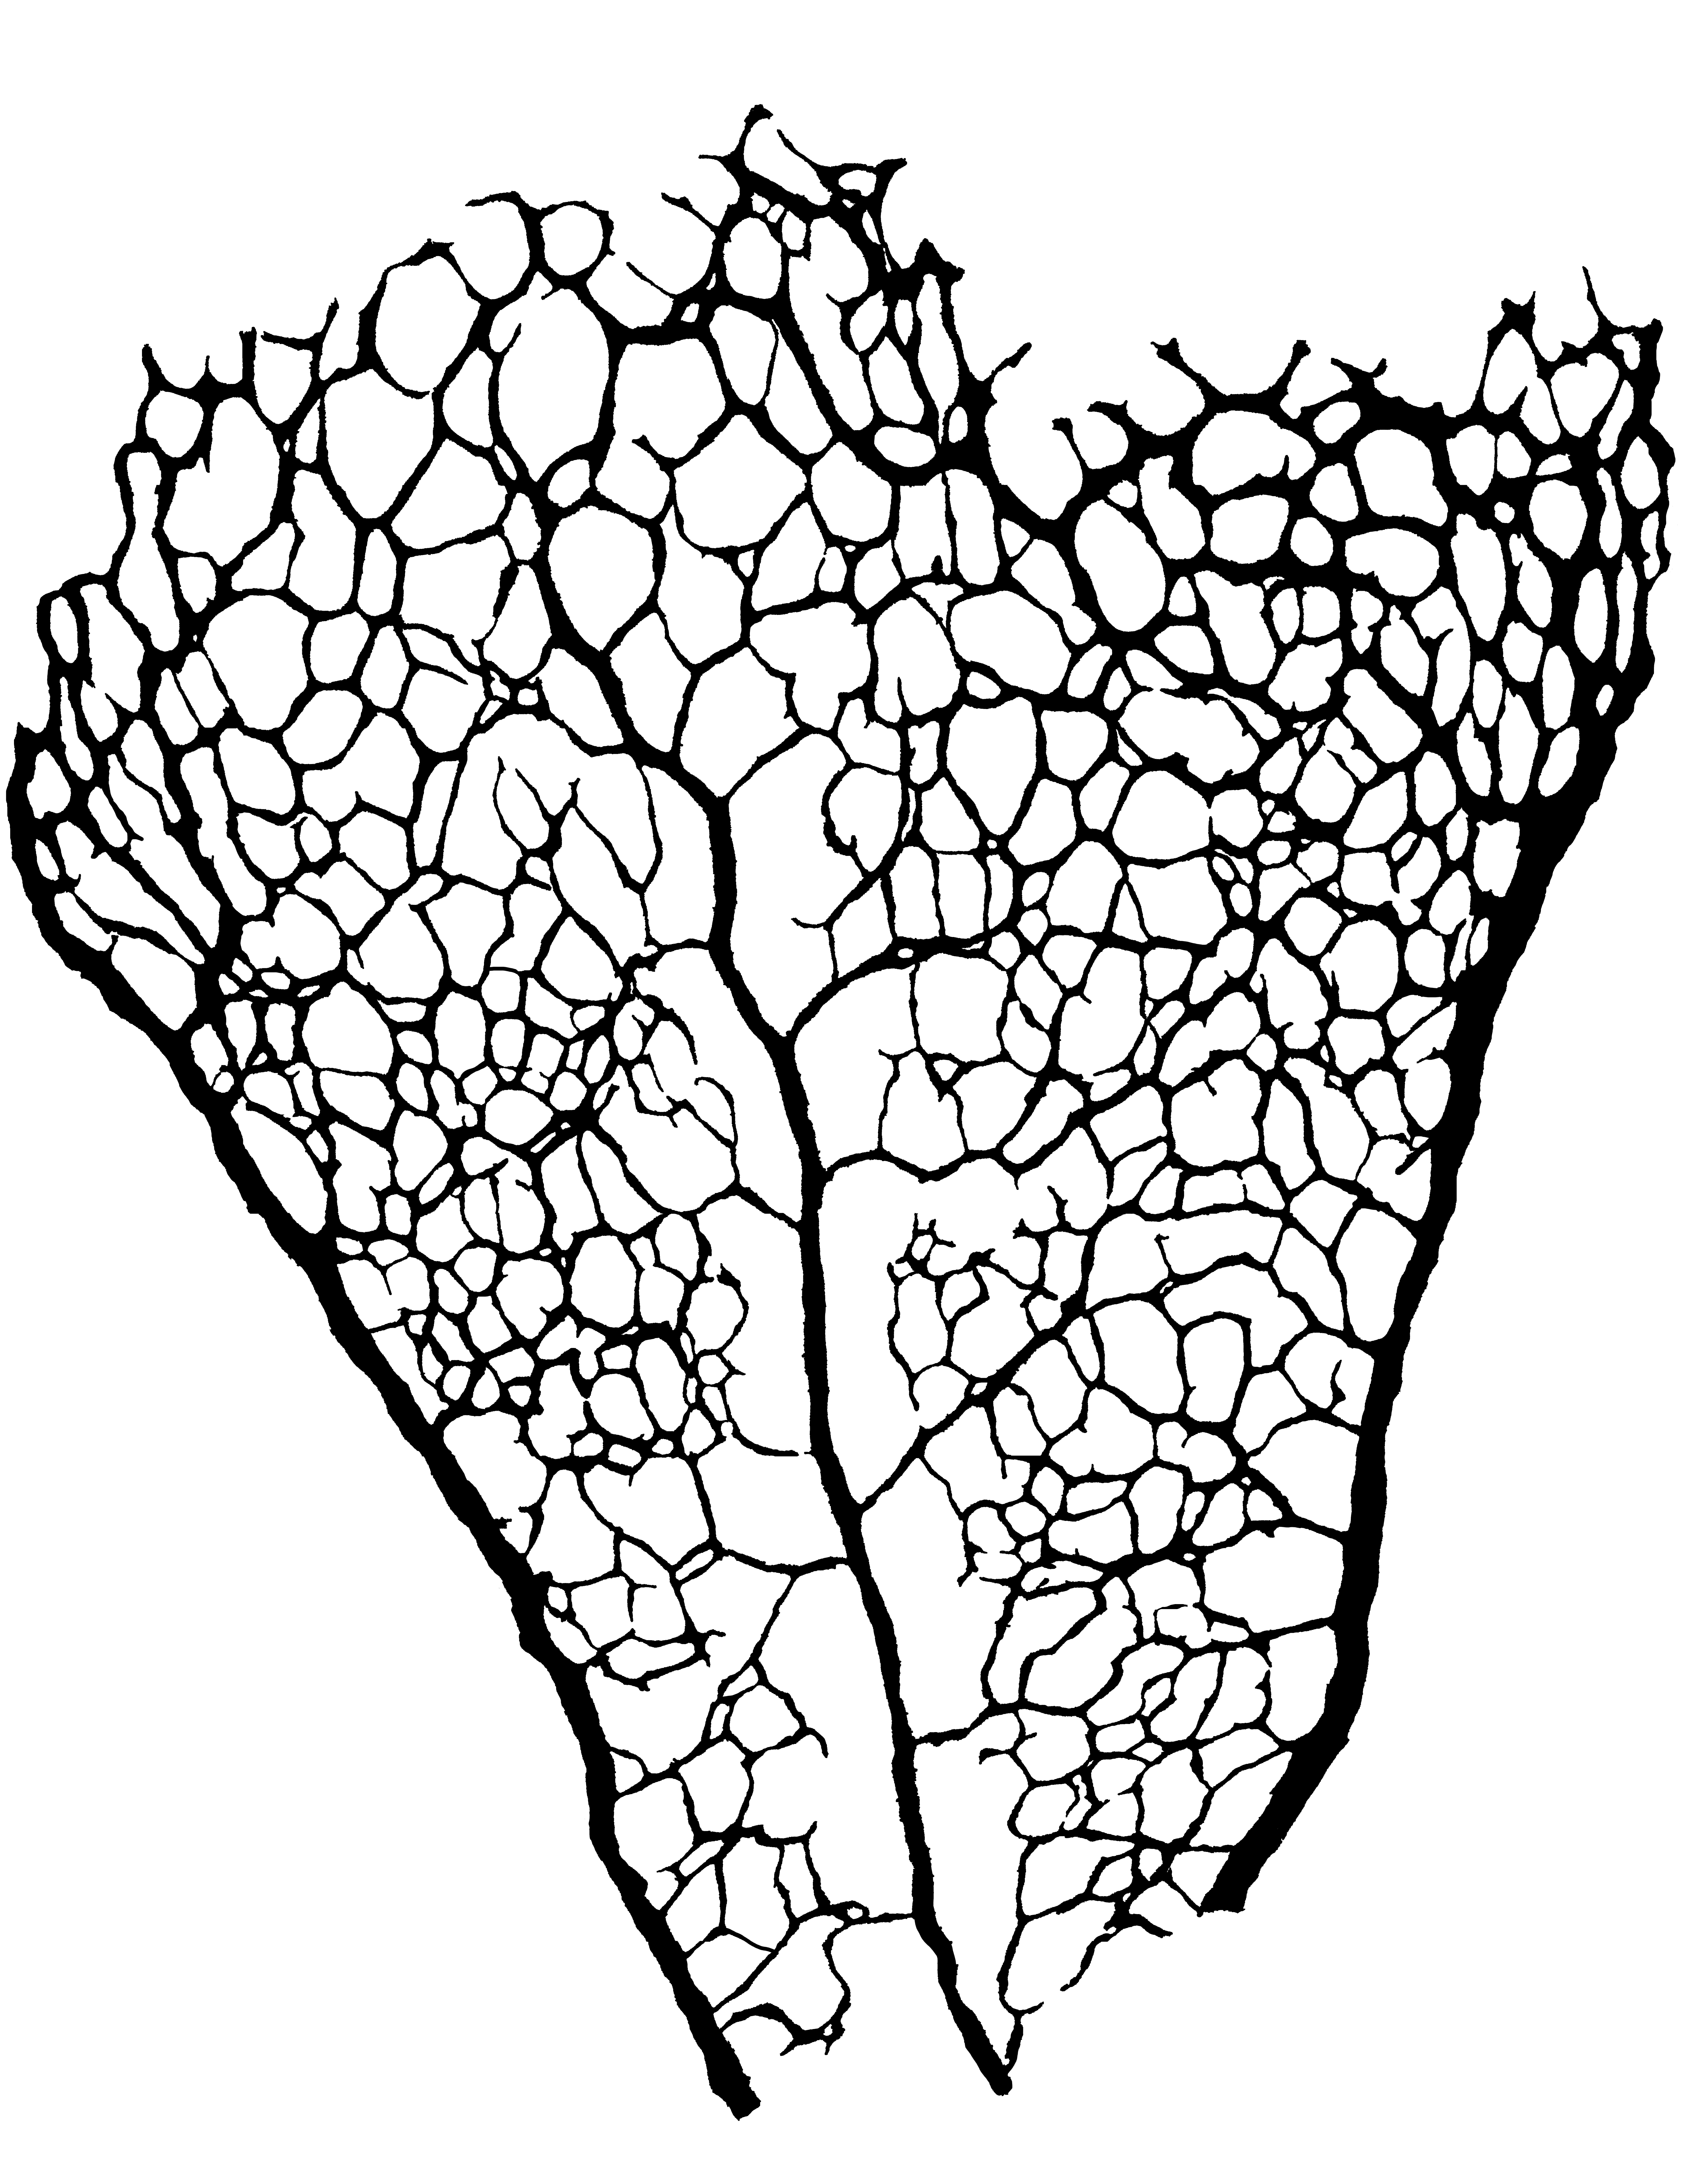
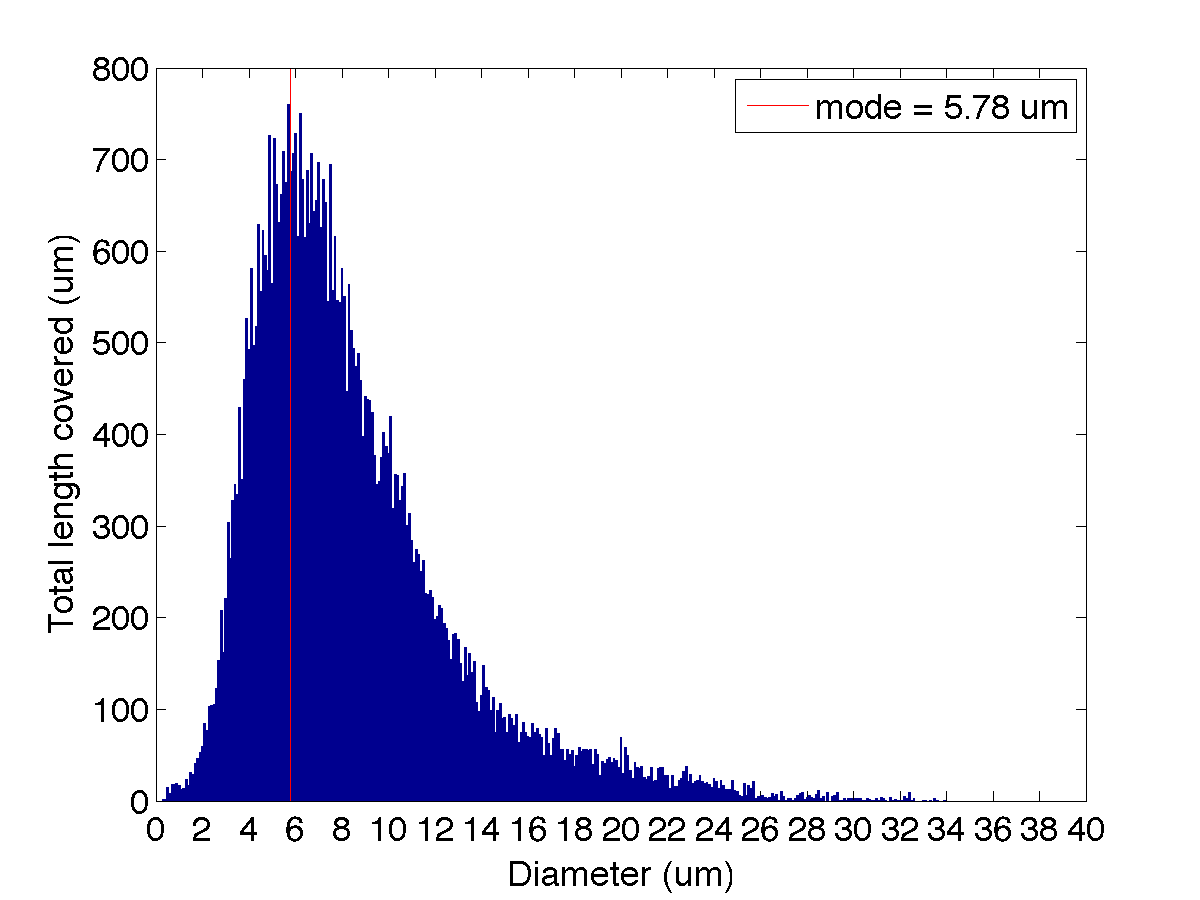
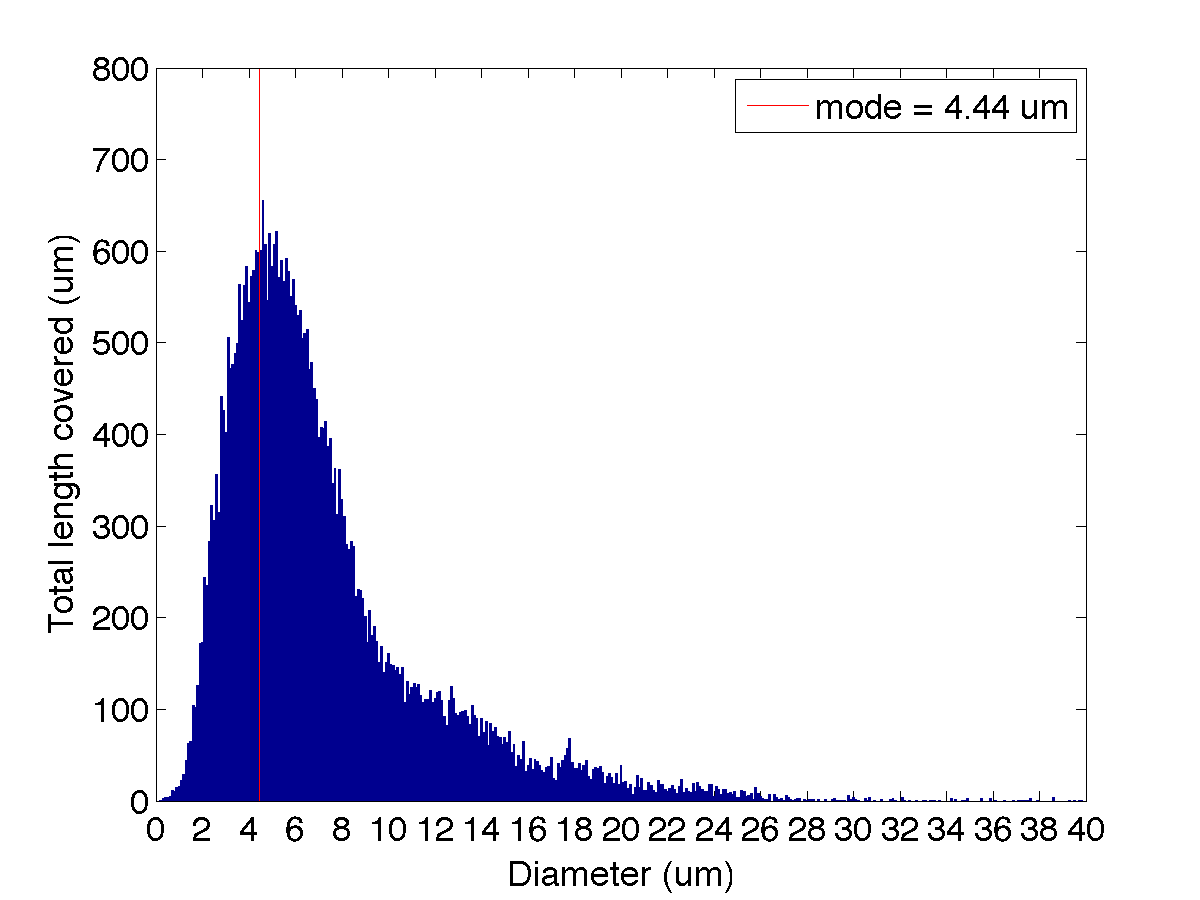
Figure 7 plots a network diameter histogram (in terms of total distance covered by vessel segments of a given diameter) for models P5B and P6B. The largest diameter in the network are and , respectively, which occur along the retinal vein. The artery segments have diameters of up to , with larger diameters closer to the optic disc. The bulk of the capillary bed has diameters approximately in the range , with a reduced amount of vessels with smaller diameter. These results are substantially lower than the in vivo measurements presented in Table 1. In addition, a small number of capillaries have diameters approaching . To some extent, these discrepancies are expected as we are measuring the diameter of the internal luminal surface with extreme precision (unlike some of the works cited where only a generic measure of vessel calibre is given), including in our measurements vessel segments that appear to be undergoing regression (hence in the process of closing up). The diameter measured for the main arteries are, however, in better agreement with the ex vivo measurements obtained from corrosion casts by Ninomiya and Inomata, (2006). Therefore, we cannot exclude that sample preparation and fixation protocols contribute to vessel shrinkage. Finally, we fit a lognormal probability distribution function to each histogram and use the distribution mode as an estimate of the typical capillary diameter (under the assumption that capillaries are the most common vessel type in the network). We observe a reduction in the typical capillary diameter between day five () and six (). More experiments are required in order to assess the statistical relevance of these results but the implications of a systematic decrease in vessel diameter over time are important given that, for a constant flow rate, wall shear stress is inversely proportional to the third power of the vessel radius. We plan to explore the relationship between changes in geometry and haemodynamics as part of a future study.
In order to ensure that 95% of the reconstructed network has , we choose the voxel sizes in Table 5 for the discretisation of each model. Acknowledgements presents a grid refinement study aimed at confirming that the choice of voxel size leads to spatially converged solutions.
| Model | P5A | P5B | P6A | P6B |
|---|---|---|---|---|
4.3 Simulations
Due to its kinetic nature, the LB algorithm applied to steady flow problems in an initially quiescent domain requires the system to be advanced in time in order to overcome an initial transient. In order to monitor convergence, we evaluate the following convergence criterion at the end of each timestep :
| (25) |
where and is a velocity reference value chosen based on the data summarised in Table 1, i.e. . Only when this condition holds do we consider the simulation to have reached steady state. More efficient methods for LB initialisation have been proposed (see e.g. Mei et al., (2006); Caiazzo, (2005)) but we will not consider them in the current work since our approach remains computationally tractable.
Figure 8 presents results of a simulation with the P5B flow model and the inlet/outlet boundary conditions and rheological properties surveyed in Section 22.2. Velocity magnitude is plotted at the intersection of the model and the plane (Figure 8). Our results show how velocities are larger in the central artery (see label A), in particular close to the optic disk. We also note that, as the artery progresses towards the sprouting front, the velocity magnitude decreases rapidly. Furthermore, it stops being a preferential flow path at the point where it meets areas of less well established vessel identity close to the sprouting front (see e.g. B regions). Areas with undefined vessel identity are correlated with homogeneous velocity distributions (see e.g. C). There exists evidence of a considerable number of vessels having recently regressed along the path of the artery (see e.g. D branches) and the more developed first order branches (see e.g. E). The two veins (top and bottom of the images) present fewer regressing profiles.
For a plane with normal , we define the traction vector
| (26) |
i.e. the force per unit area acting on that plane. Figure 8 plots traction magnitude on the model surface (often referred to as wall shear stress magnitude, WSS). We observe that areas of preferential flow correlate well with the areas experiencing larger WSS. In contrast, vessels in the sprouting front are under lower magnitudes of WSS. The model predicts values of WSS larger than , which can be deemed unphysiological based on the microvasculature WSS measurements reported in the literature: (Popel and Johnson,, 2005), (Ganesan et al.,, 2010)) or computed from the values reported by Wright et al., (2012) (under the assumption of Poiseuille flow). We believe that the WSS overestimation (mainly occurring at the central artery and some first order branches) is due to the vessel shrinkage discussed earlier or other modelling errors.
Figure 9 presents results of a simulation with the P6A flow model and the inlet/outlet boundary conditions and rheological properties surveyed in Section 22.2.
Figure 9 plots velocity magnitude on the intersection of the model and the plane. First of all, it can be appreciated how velocities are larger on arteries, veins, and first-order vessels branching out from them. Highest peak velocities are around (corresponding to mean velocities of under Poiseuille flow assumption) and are in good agreement with the measurements by Wright and colleagues presented in Table 1. Velocity distribution along a given vessel diameter displays the expected parabolic profile with zero velocity at the walls. Areas in more advanced state of pruning (typically closer to the optic disc, see region B) tend to present larger velocity magnitudes due to a reduction in vessel density. An exception to this trend is region C. In this case, we observe a region of very low flow (similar to the regions found in the less mature vascular plexus towards the periphery) in an area where pruning should be in a fairly advanced stage. Two explanations are possible: i) that a recent vessel regression event has drastically reduced the total flow arriving to the area which in turn will trigger further vessel regression (similar to what can be observed in region A) or ii) that a vessel segment connecting the area with the nearby artery was accidentally removed when preparing the sample. In contrast to the optic disc region, areas in the vicinity of the sprouting front experience lower velocity magnitudes (see region E). Nevertheless, even in this region, we can already appreciate segments of predominant flow (see e.g. F regions) rather than a totally homogeneous flow distribution. Taken together with observations from Chen et al., (2012), we predict that these high-flow vessel segments are likely to survive the pruning process.
Figure 9 plots WSS on the model surface. We observe that areas of preferential flow correlate well with the areas experiencing larger WSS. However, in this case we do not see a decrease in WSS with increasing vessel order. WSS peaks are distributed throughout the domain in agreement with the observations by Ganesan et al., (2010). We also observe a complex distribution of WSS along individual vessel segments, with changes following local variation in vessel diameter.
Figure 10 plots on the surface of a subset of the domain (marked with a circle in Figure 9). Given the redundancy of a loop-like structure of this type and the distribution of diameters present, it can be assumed that the upper half of the loop is undergoing regression. This fact is in good agreement with the distribution of WSS, of much larger magnitude on the bottom section of the loop and vessel segments upstream and downstream from it.
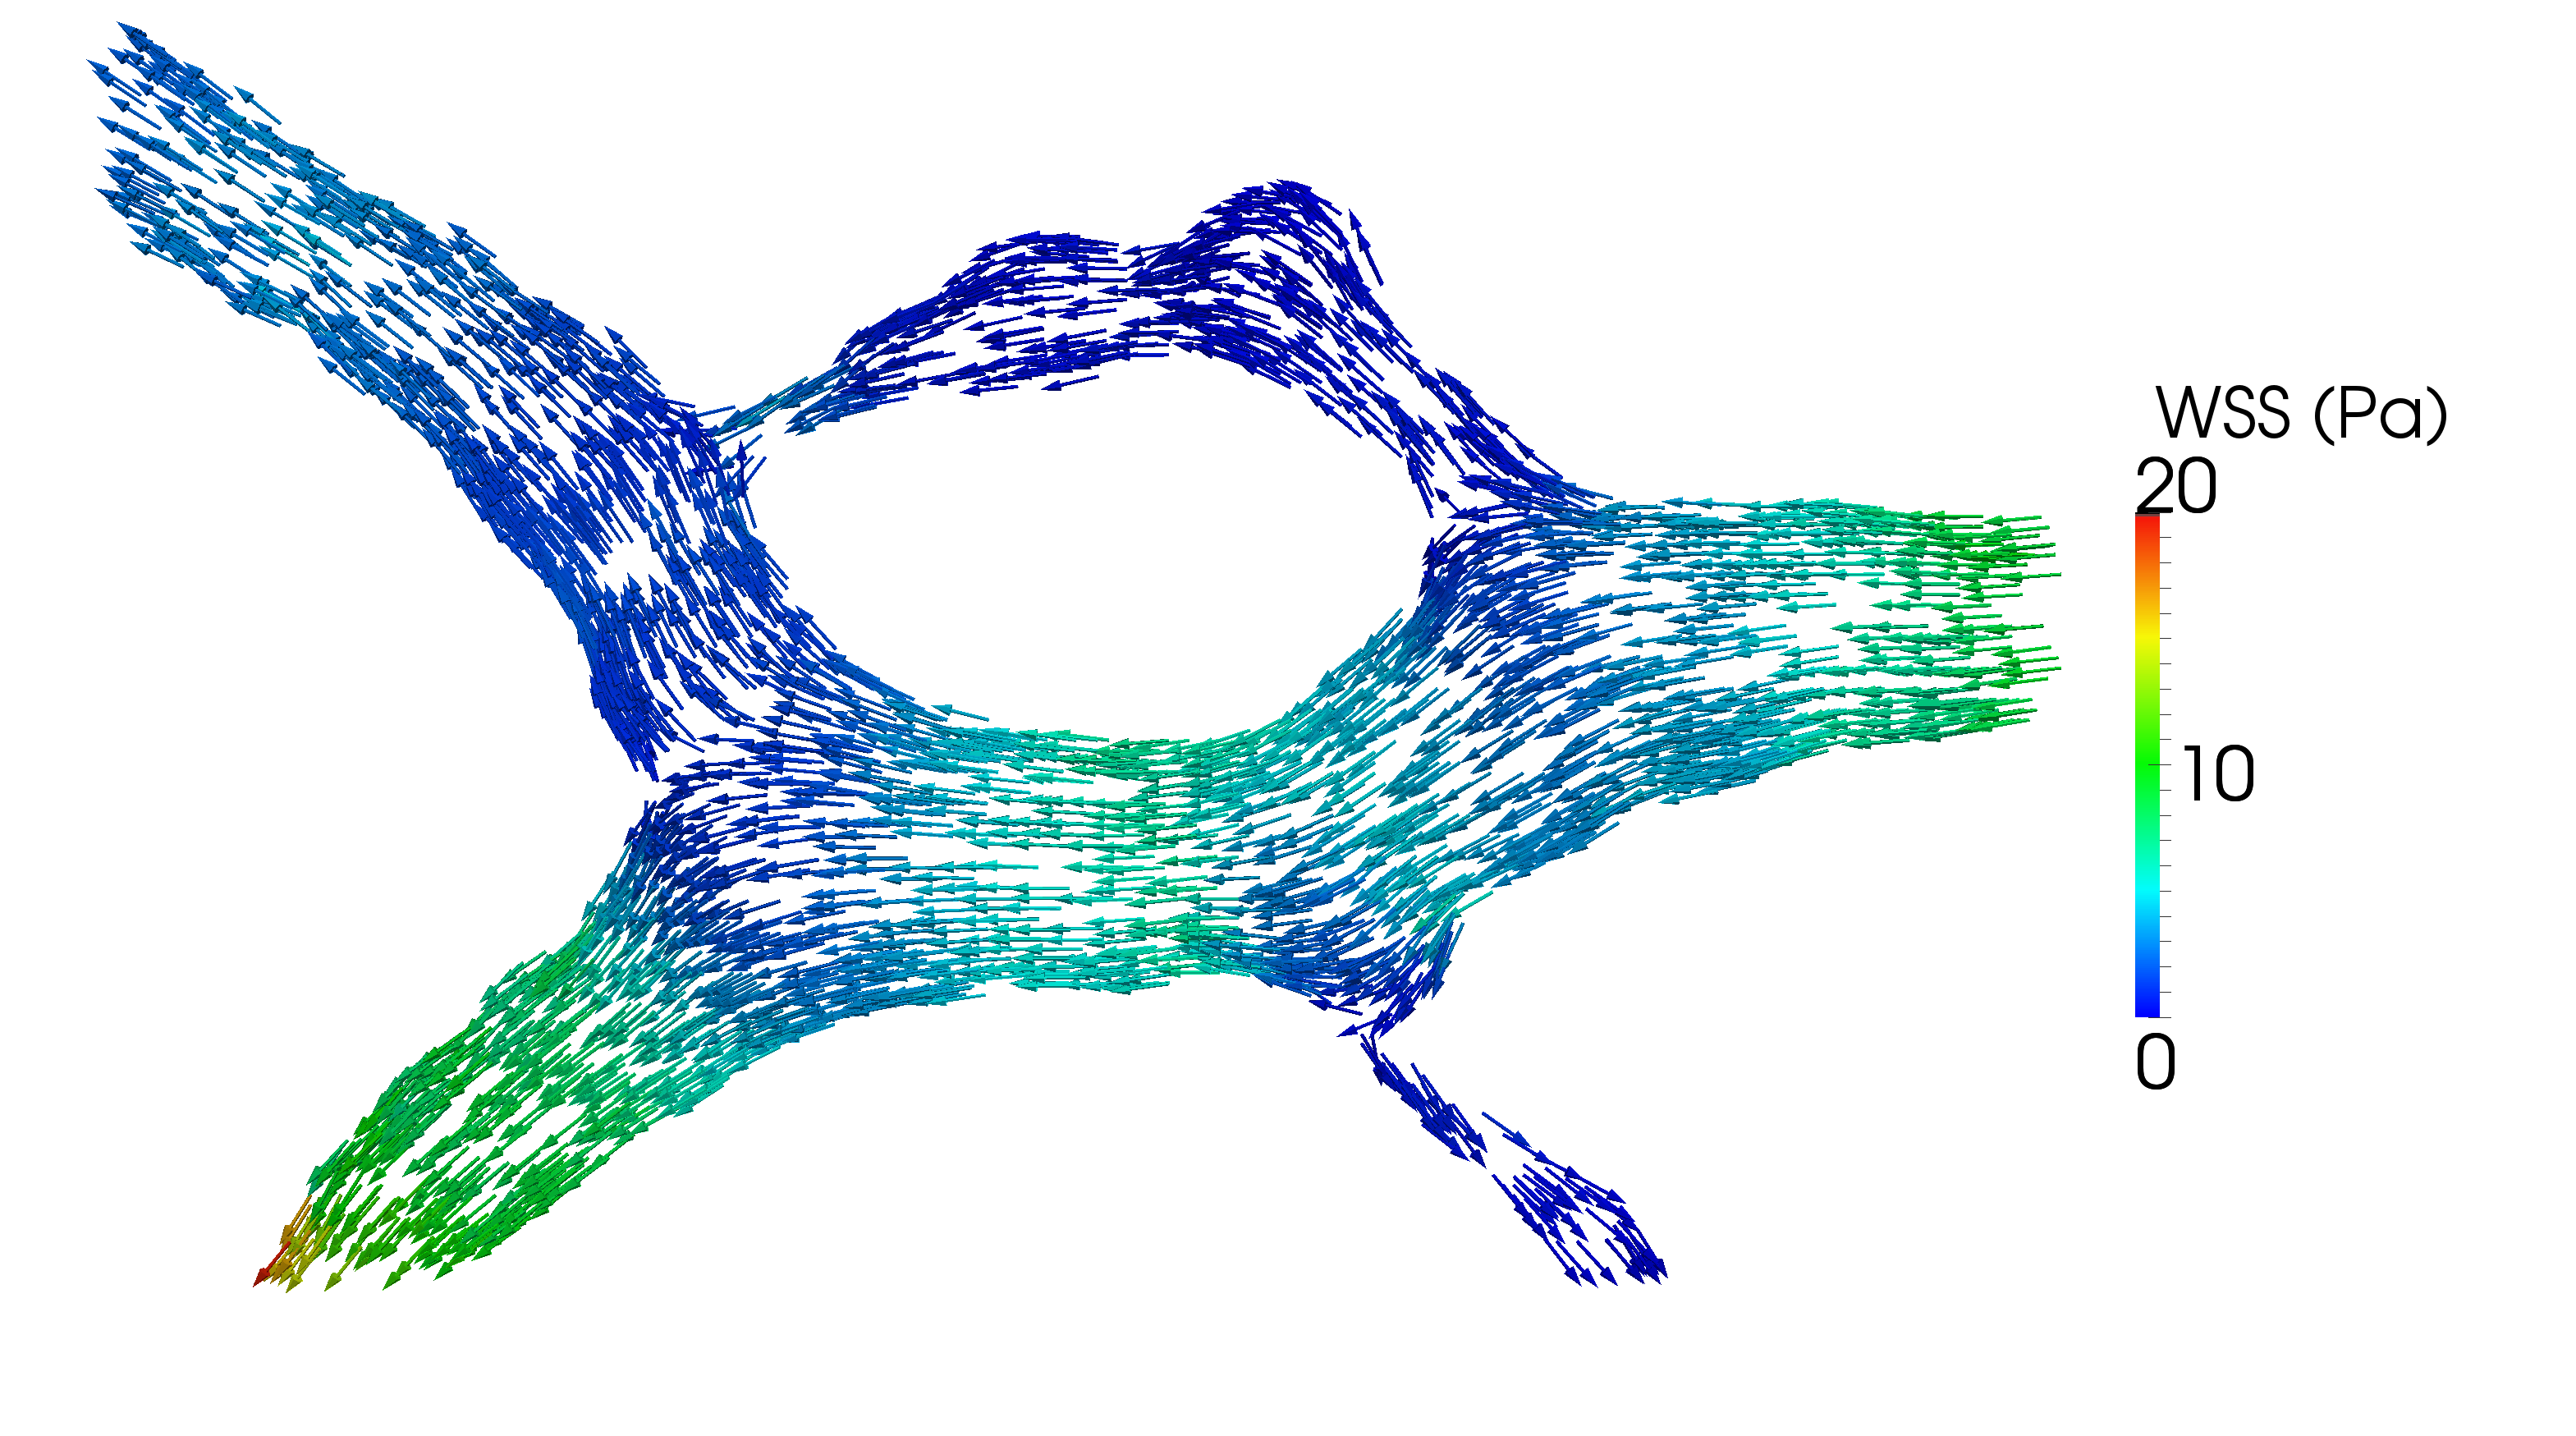
In summary, the results presented in this section support the idea that vessel segments undergoing pruning tend to occur in regions of low flow (and hence low shear stress). We hypothesise that this process gradually reduces network density and as a consequence flow increases in the surviving vessel segments. This in turn prevents further pruning and contributes to vessel maturation.
4.4 Limitations of the study
The main limitations of the study are as follows. First, blood was modelled as a homogeneous fluid rather than a particle suspension. This is likely to have an impact on the wall shear stress computed in small calibre capillaries. Xiong and Zhang, (2010) studied the changes in haemodynamics induced by the presence of red blood cells flowing in a simplified model of a microvessel and found up to a 20% increase in the shear stress experienced by the luminal wall. Second, although blood was modelled as a shear-thinning fluid, other rheological properties such as the Fåhræus-Lindqvist effect (see Section 22.2) were not accounted for. Third, vessel cross-section was assumed to be circular throughout the domain due to the lack of spatial information in the z axis. As previously mentioned, there exists experimental evidence supporting this assumption in retinal arteries but not in veins (Feke et al.,, 1989). This will have an impact on the haemodynamics recovered. Also, despite all our efforts when processing retina samples, we cannot be fully certain that no distortions in the vascular plexus were introduced. Next, due to the difficulty of measuring pressure or flow profiles at the model inlets/outlets in vivo and the absence of suitable data in the literature, only steady state simulations were performed. We expect flow to be nearly in phase with pressure given the typical values of Womersley number (defined as the ratio between oscillatory inertial forces and viscous forces) encountered in retinal circulation ( according to Liu et al., (2009)). This makes us confident that flow has time to fully develop in each cardiac cycle and hence will be well approximated by an instantaneous pressure gradient. Nevertheless, there will still be substantial variations in wall shear stress within any given cardiac cycle. Furthermore, the values of mean arterial pressure (MAP) and intraocular pressure (IOP) used as inlet and outlet boundary conditions were obtained from adult animals. In the supplementary material of this paper (11), we perform a sensitivity analysis of these parameters. Finally, another source of variation in the predicted haemodynamics are the active and passive mechanical properties of retinal vessels. At the analysed stage, retinal arteries are already covered with a smooth muscle layer, which might contract/relax to control local flow (i.e. autoregulation) and therefore have an impact in flow patterns in downstream vessels.
5 Conclusions
In the current work, we have presented a software pipeline for the creation of computational blood flow models based on confocal microscope images of the microvasculature. The pipeline has been applied to the development of flow models of the neonatal mouse retinal vasculature (a common animal model for the study of vascular development). The different software components used are released under open source licences.
Using simplified benchmark problems, we have demonstrated the suitability of the lattice-Boltzmann (LB) algorithm for the simulation of blood flow in sparse and highly complex vascular networks. Our results indicate that a careful choice of the LB configuration parameters leads to accurate flow estimates in channels as narrow as three lattice sites across. Furthermore, we also showed that the implementation of the no-slip boundary condition proposed by Bouzidi et al., (2001) produces acceptable estimates of wall shear stress. We measured errors of and in channels 7 and 15 lattice sites wide, respectively. Being able to recover correct haemodynamics even at moderately coarse discretisations is fundamental to keep the problems under study computationally tractable.
In the study reported here, we investigated changes in haemodynamics during vascular remodelling. Blood flow models were generated from samples of retinal plexuses obtained at postnatal day (P) 5 and 6. Our simulations show that, in both cases, velocity and wall shear stress (WSS) are higher in arteries, veins, and first-order capillaries closer to the optic disk. However, important differences in the distribution of velocity and WSS across the domain are observed when comparing both days (see e.g. Figures 8 and 9). On the one hand, P5 simulations show a very homogeneous distribution of velocity and WSS across the capillary network with moderately high values only in the vicinity of the optic disk. On the other hand, simulations with the P6 flow model show a consistently higher and much more spatially complex distribution of velocity and WSS. Higher values are primarily located in regions in a more advanced state of remodelling (note e.g. the number of disconnected vessels undergoing regression). In the P6 case, branches of predominant flow can be also identified in the sprouting front.
We also analysed WSS in segments undergoing regression (see e.g. Figure 10) and observed vessel pruning occurring in regions of low shear stress. This process gradually reduces network density (through the removal of redundant segments) and is likely to lead to an increase in flow in the surviving vessel segments. We hypothesise that this will contribute to vessel maturation. Our results support the previously proposed modulation effect that haemodynamic forces have on developmental vascular remodelling (Chen et al.,, 2012).
The geometrical analysis of the vascular plexuses leads to two possible explanations for the increase in velocity and WSS observed between the P5 and P6 models. First, the increase may be a direct consequence of the observed decrease in typical capillary diameter (given the inverse relationship between WSS and the third power of the vessel radius and assuming that the total flow rate in the retina remains constant). Second, the progressive reduction in capillary bed density due to vessel regression may lead to an increase in flow (and hence WSS) in neighbouring vessels. We believe that both effects may play complementary roles in order to create the WSS gradients hypothesised to be behind vessel regression (Chen et al.,, 2012). Further experiments are required in order to determine the relative importance of each of these effects and fully understand how they interact.
We are currently working on extending the modelling framework to include tissue mechanics and agent-based cellular modelling. Our goal is to develop an integrated computational framework for vascular mechanobiology research. In particular, we are interested in modelling the interplay between cellular molecular regulation and haemodynamic forces during vascular remodelling. Finally, the developed methodology should be applicable to other research domains where small vascular networks can be imaged but where experimental flow measurements are difficult to obtain.
Acknowledgements
This work was supported by: Cancer Research UK; the Lister Institute of Preventive Medicine; the Leducq Transatlantic Network ARTEMIS; the UK-Israel Initiative BIRAX; EPSRC grants “2020 Science” (http://www.2020science.net/, EP/I017909/1), “Large Scale Lattice Boltzmann for Biocolloidal Systems” (EP/I034602/1), and “UK Consortium on Mesoscale Engineering Sciences (UKCOMES)” (EP/L00030X/1); and the EC-FP7 projects CRESTA (http://www.cresta-project.eu/, grant no. 287703) and MAPPER (http://www.mapper-project.eu/, grant no. 261507). CAF is supported by a Marie Curie Post-doctoral Fellowship of the European Commission FP7 People framework. This work made use of the HECToR and ARCHER UK National Supercomputing Services (http://www.archer.ac.uk) (under EPSRC grants EP/I017909/1 and EP/L00030X/1). The authors acknowledge the support of the UCL Research Software Development Service (RSD@UCL) in the completion of this work.
An introduction to the lattice-Boltzmann algorithm
In the current section we present a brief introduction to the lattice-Boltzmann (LB) algorithm. The interested reader can refer to well-cited references such as Chen and Doolen, (1998); Aidun and Clausen, (2010) for a more in-depth presentation and analysis. LB operates at a mesoscopic level, simulating the evolution of a discrete-velocity approximation to the one-particle velocity distribution functions of the Boltzmann equation of kinetic theory, . Computations are performed on a regular lattice discretisation of , with grid spacing . The set of velocities is chosen such that the distances travelled in one timestep (), , are lattice vectors. When one only wishes to reproduce Navier-Stokes dynamics, the set is typically a subset of the Moore neighbourhood, including the rest vector. For 3D simulations, the most commonly used sets have 15, 19 and 27 members. In the current work, we employ the three-dimensional 15 velocity LB lattice (D3Q15).
Evolving the distribution functions in time involves two main steps. The first is known as the collision step, which relaxes the distributions towards a local equilibrium (the post-collisional distributions is often denoted as ):
| (27) |
where is a the collision operator. The second is known as the streaming step, where are propagated along the lattice vectors to new locations in the lattice, defining the distribution functions at the next timestep:
| (28) |
In the current work, we employ the lattice Bhatnagar-Gross-Krook (LBGK) collision operator, which approximates the collision step as a relaxation process towards a local equilibrium,
| (29) |
where is the relaxation time. This can be shown, through a Chapman-Enskog expansion (see, e.g., Ladd and Verberg, (2001); Chen and Doolen, (1998)), to reproduce the Navier-Stokes equations in the quasi-incompressible limit with errors proportional to the lattice Mach number squared. The kinematic viscosity is given by
| (30) |
where
| (31) |
is the speed of sound in the D3Q15 lattice. Equation (29) can be extended to simulate generalised Newtonian flows by locally varying according to (30) and an empirical characterisation of the fluid viscosity (e.g. Equation (10)).
For the equilibrium distribution, we use a second-order (in velocity space) approximation to a Maxwellian distribution
| (32) |
where the weights and speed of sound depend on the choice of velocity set. Other choices of exist. Finally, the interested reader can refer to previous work by the authors (Nash et al., (2014) and references therein) on the implementation of wall and open boundary conditions.
The macroscopic density and velocity at a fluid site can be calculated from the distribution functions by
| (33) | ||||
| (34) |
The macroscopic pressure is related to the density by the ideal gas law
| (35) |
A notable characteristic of the LB algorithm is that the shear rate tensor S can be computed at any lattice site from local information only. Let be the non-equilibrium part of the distribution function. It can be shown that (see e.g. Krüger et al., (2009)):
| (36) |
The main advantage of this approach is that S (and therefore , T, and ) can be evaluated locally without the need of accessing simulation results generated at neighbouring lattice sites in order to approximate spatial derivatives of the velocity field. This makes parallel performance independent of the choice of rheology model or the need of computing wall shear stress (a variable of primary importance in our work).
Voxel size convergence analysis
In this section we perform a grid refinement study of the simulations presented in Section 44.3. We want to assess whether the characterisation of the discretisation error done in Section 44.1 with a simplified domain and rheology model remains valid with more complex vessel networks and rheology models.
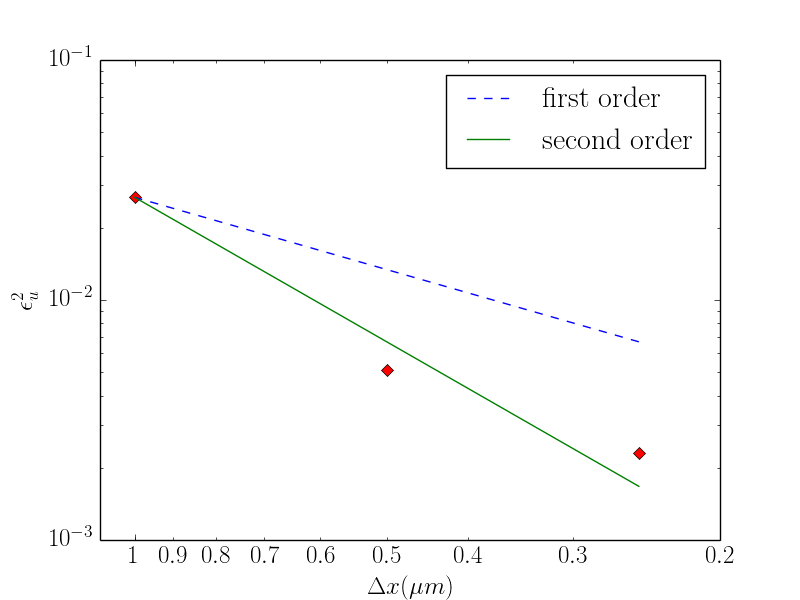
In order to confirm that the choice of in Table 5 leads to spatially converged solutions, we generated a set of increasingly finer discretisations of the P6A flow model. The finest discretisation that remained computationally tractable for us had . We used the results of this simulation as a reference solution and compared it against the results obtained with . Note that had to be modified according to (11)–(12) in order to keep constant across all simulations (see Section 44.1 for more details). We define the error in the velocity field for a given discretisation as
| (37) |
where corresponds, in each of the simulations, to the time where steady flow convergence has been achieved according to the stop criteria in Equation 25 and is the lattice site in the reference discretisation closest to . Finally, we use the root mean square of the error scaled by the predicted velocity range as our measure of error
| (38) |
where is the number of lattice sites in the discretisation or a subset of it.
Figure 11 plots the values of computed on the subset of the P6A flow model presented in Figure 9 (i.e. lattice sites on the plane) for the choice of discussed above. The results show the LB configuration employed (i.e. lattice, collision operator, and boundary condition implementation) displays second-order convergence behaviour. WSS (results not presented here) shows similar convergence trends. These findings are in agreement with results previously published by the authors (Nash et al.,, 2014). Finally, our grid refinement study shows how the choice of voxel sizes in Table 5 leads to sufficiently spatially converged solutions. In the case of the P6A flow model, the results generated with have a relative error of only when compared with the results obtained with finest discretisation of the model that remained computationally tractable.
Inlet/outlet configuration sensitivity analysis
In this section we investigate the robustness of the results in Section 44.3 with regards to the choice of inlet and outlet boundary conditions. This is motivated by the fact that the choice of MAP and IOP in our flow model is based on data obtained from the literature (see Table 3) rather than directly measured from the animals used in the study. First, we want to investigate whether the general patterns of flow are affected by moderate changes in OPP (defined as the difference between MAP and IOP). Second, we want to quantify the relationship between OPP and blood velocity in the domain.
Figure 12 repeats the visualisation in Figure 9 for simulations with OPP smaller and larger. The colour scale has been adjusted to range from to the largest velocity in the domain in each case. It can be appreciated how the general patterns of flow and velocity gradients are greatly preserved from those in Figure 9. As expected, the absolute values differ.
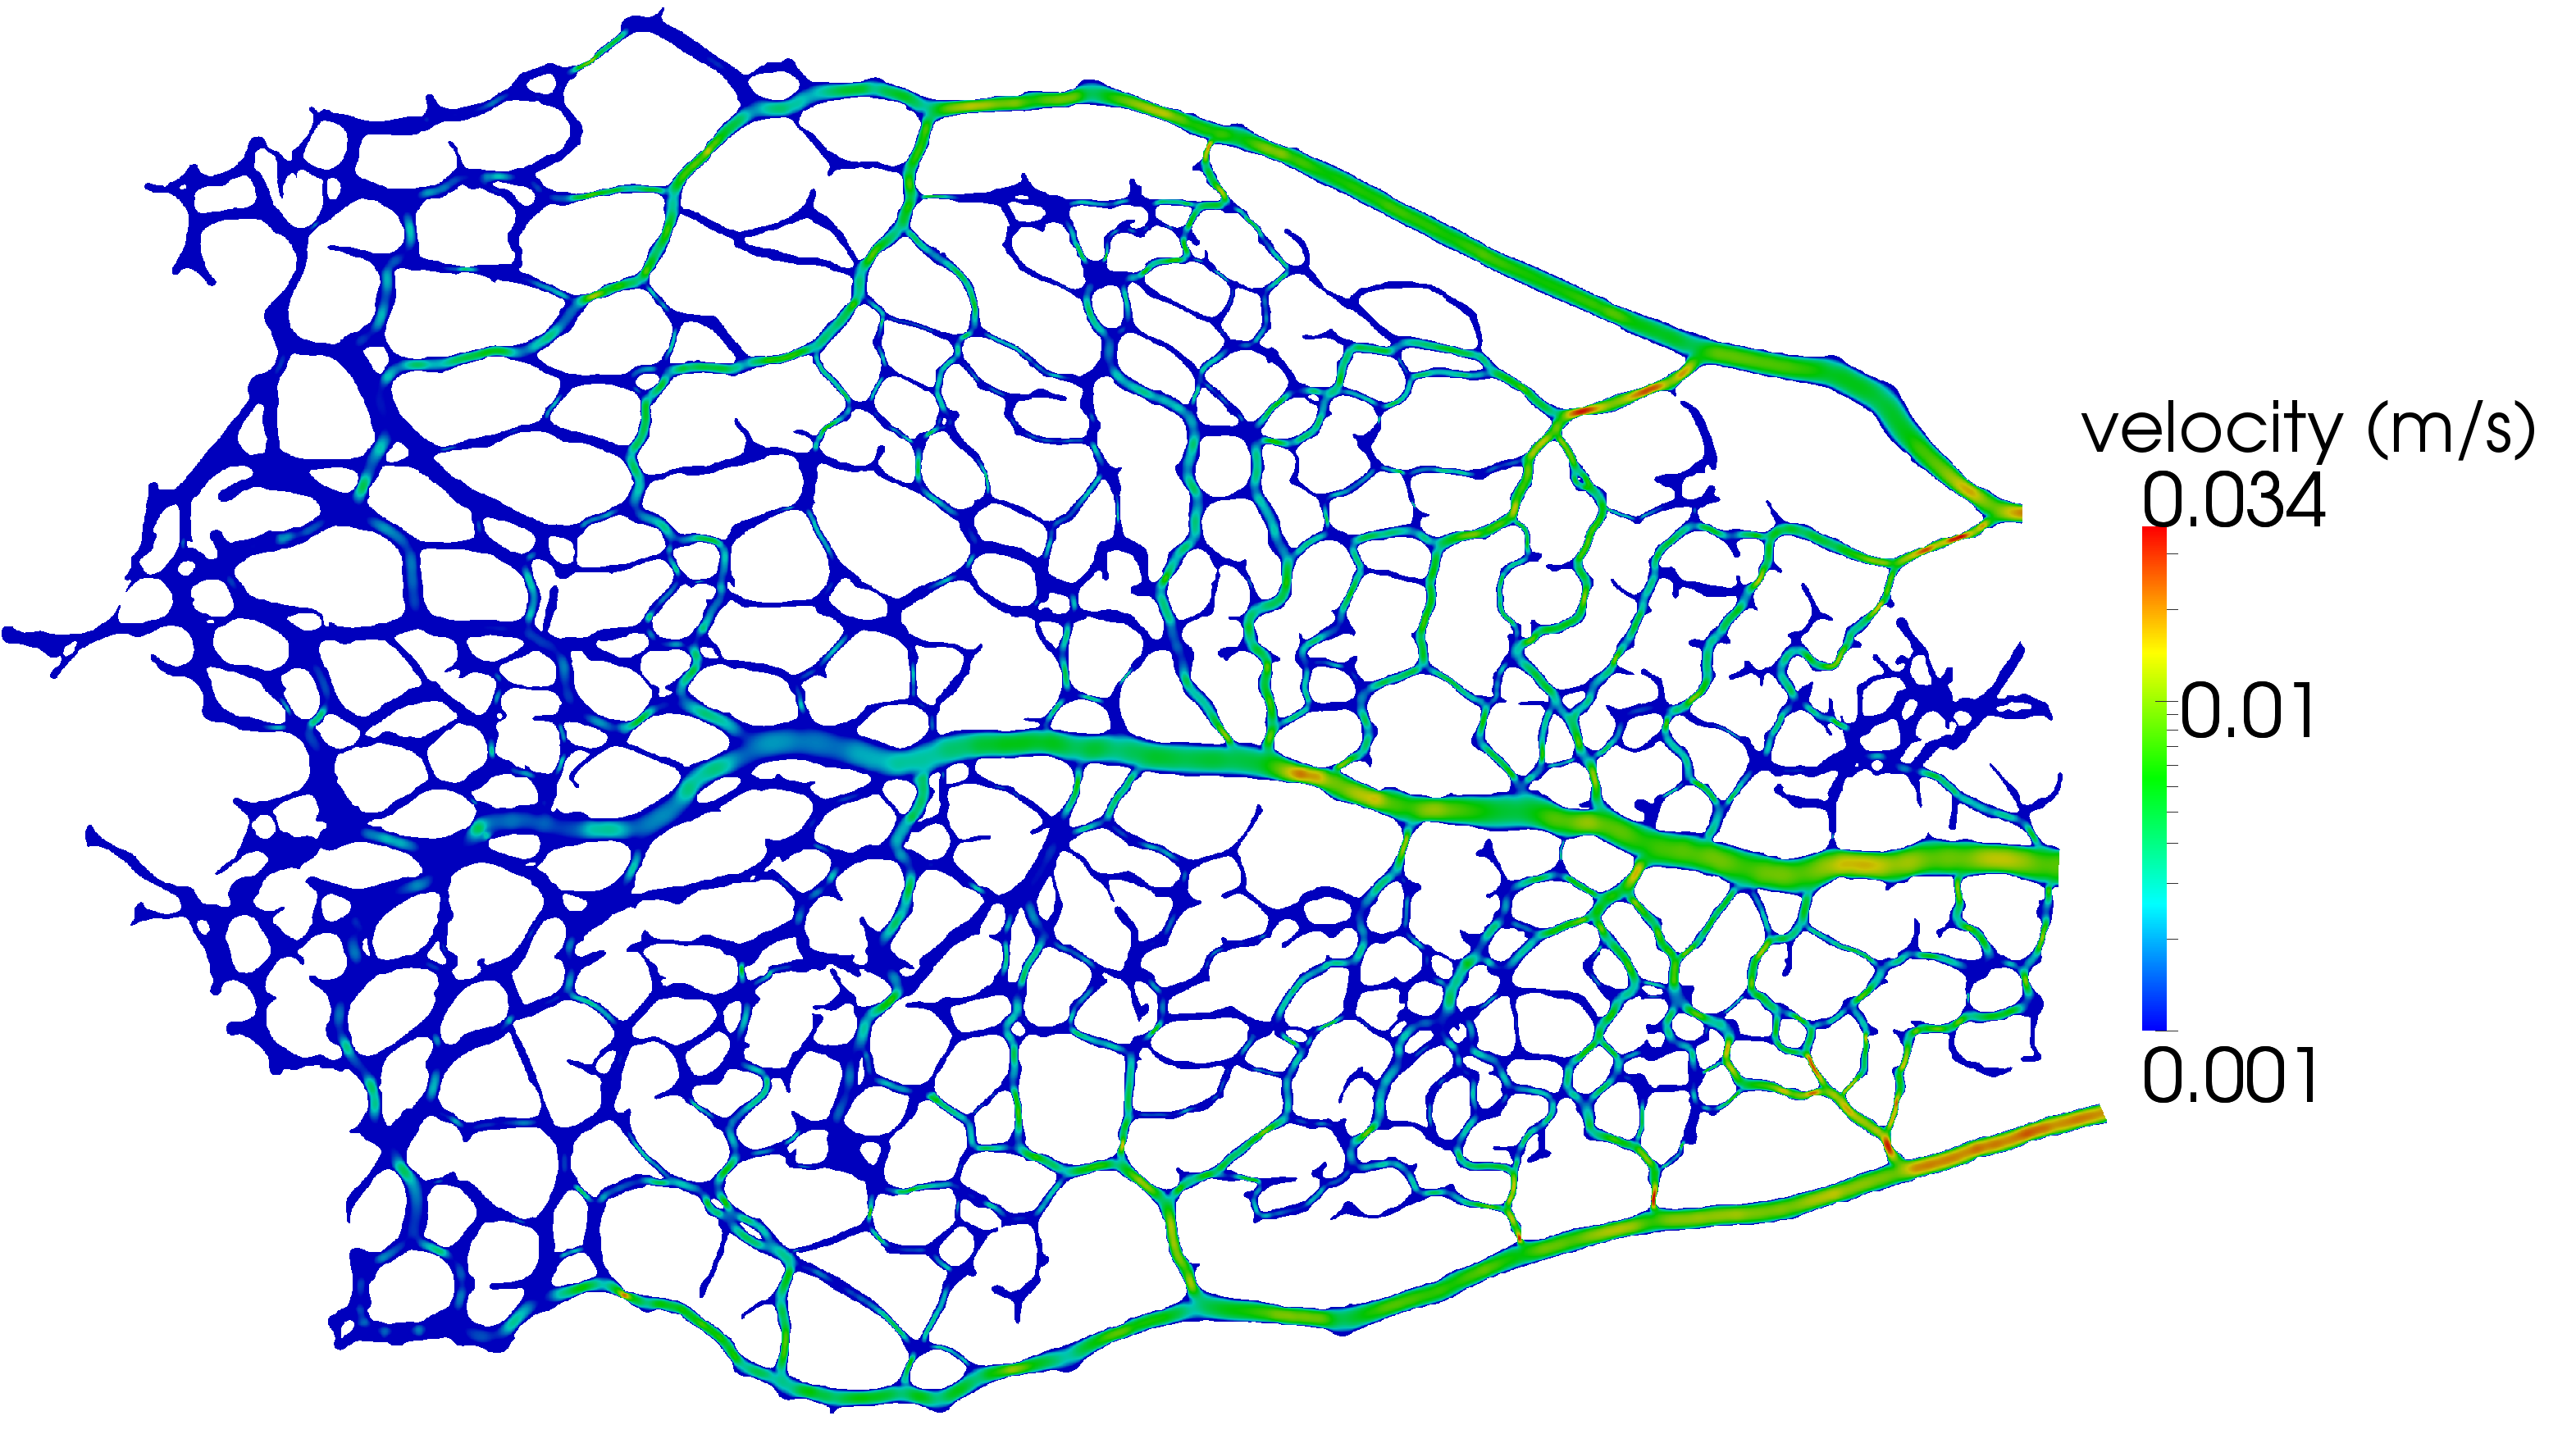
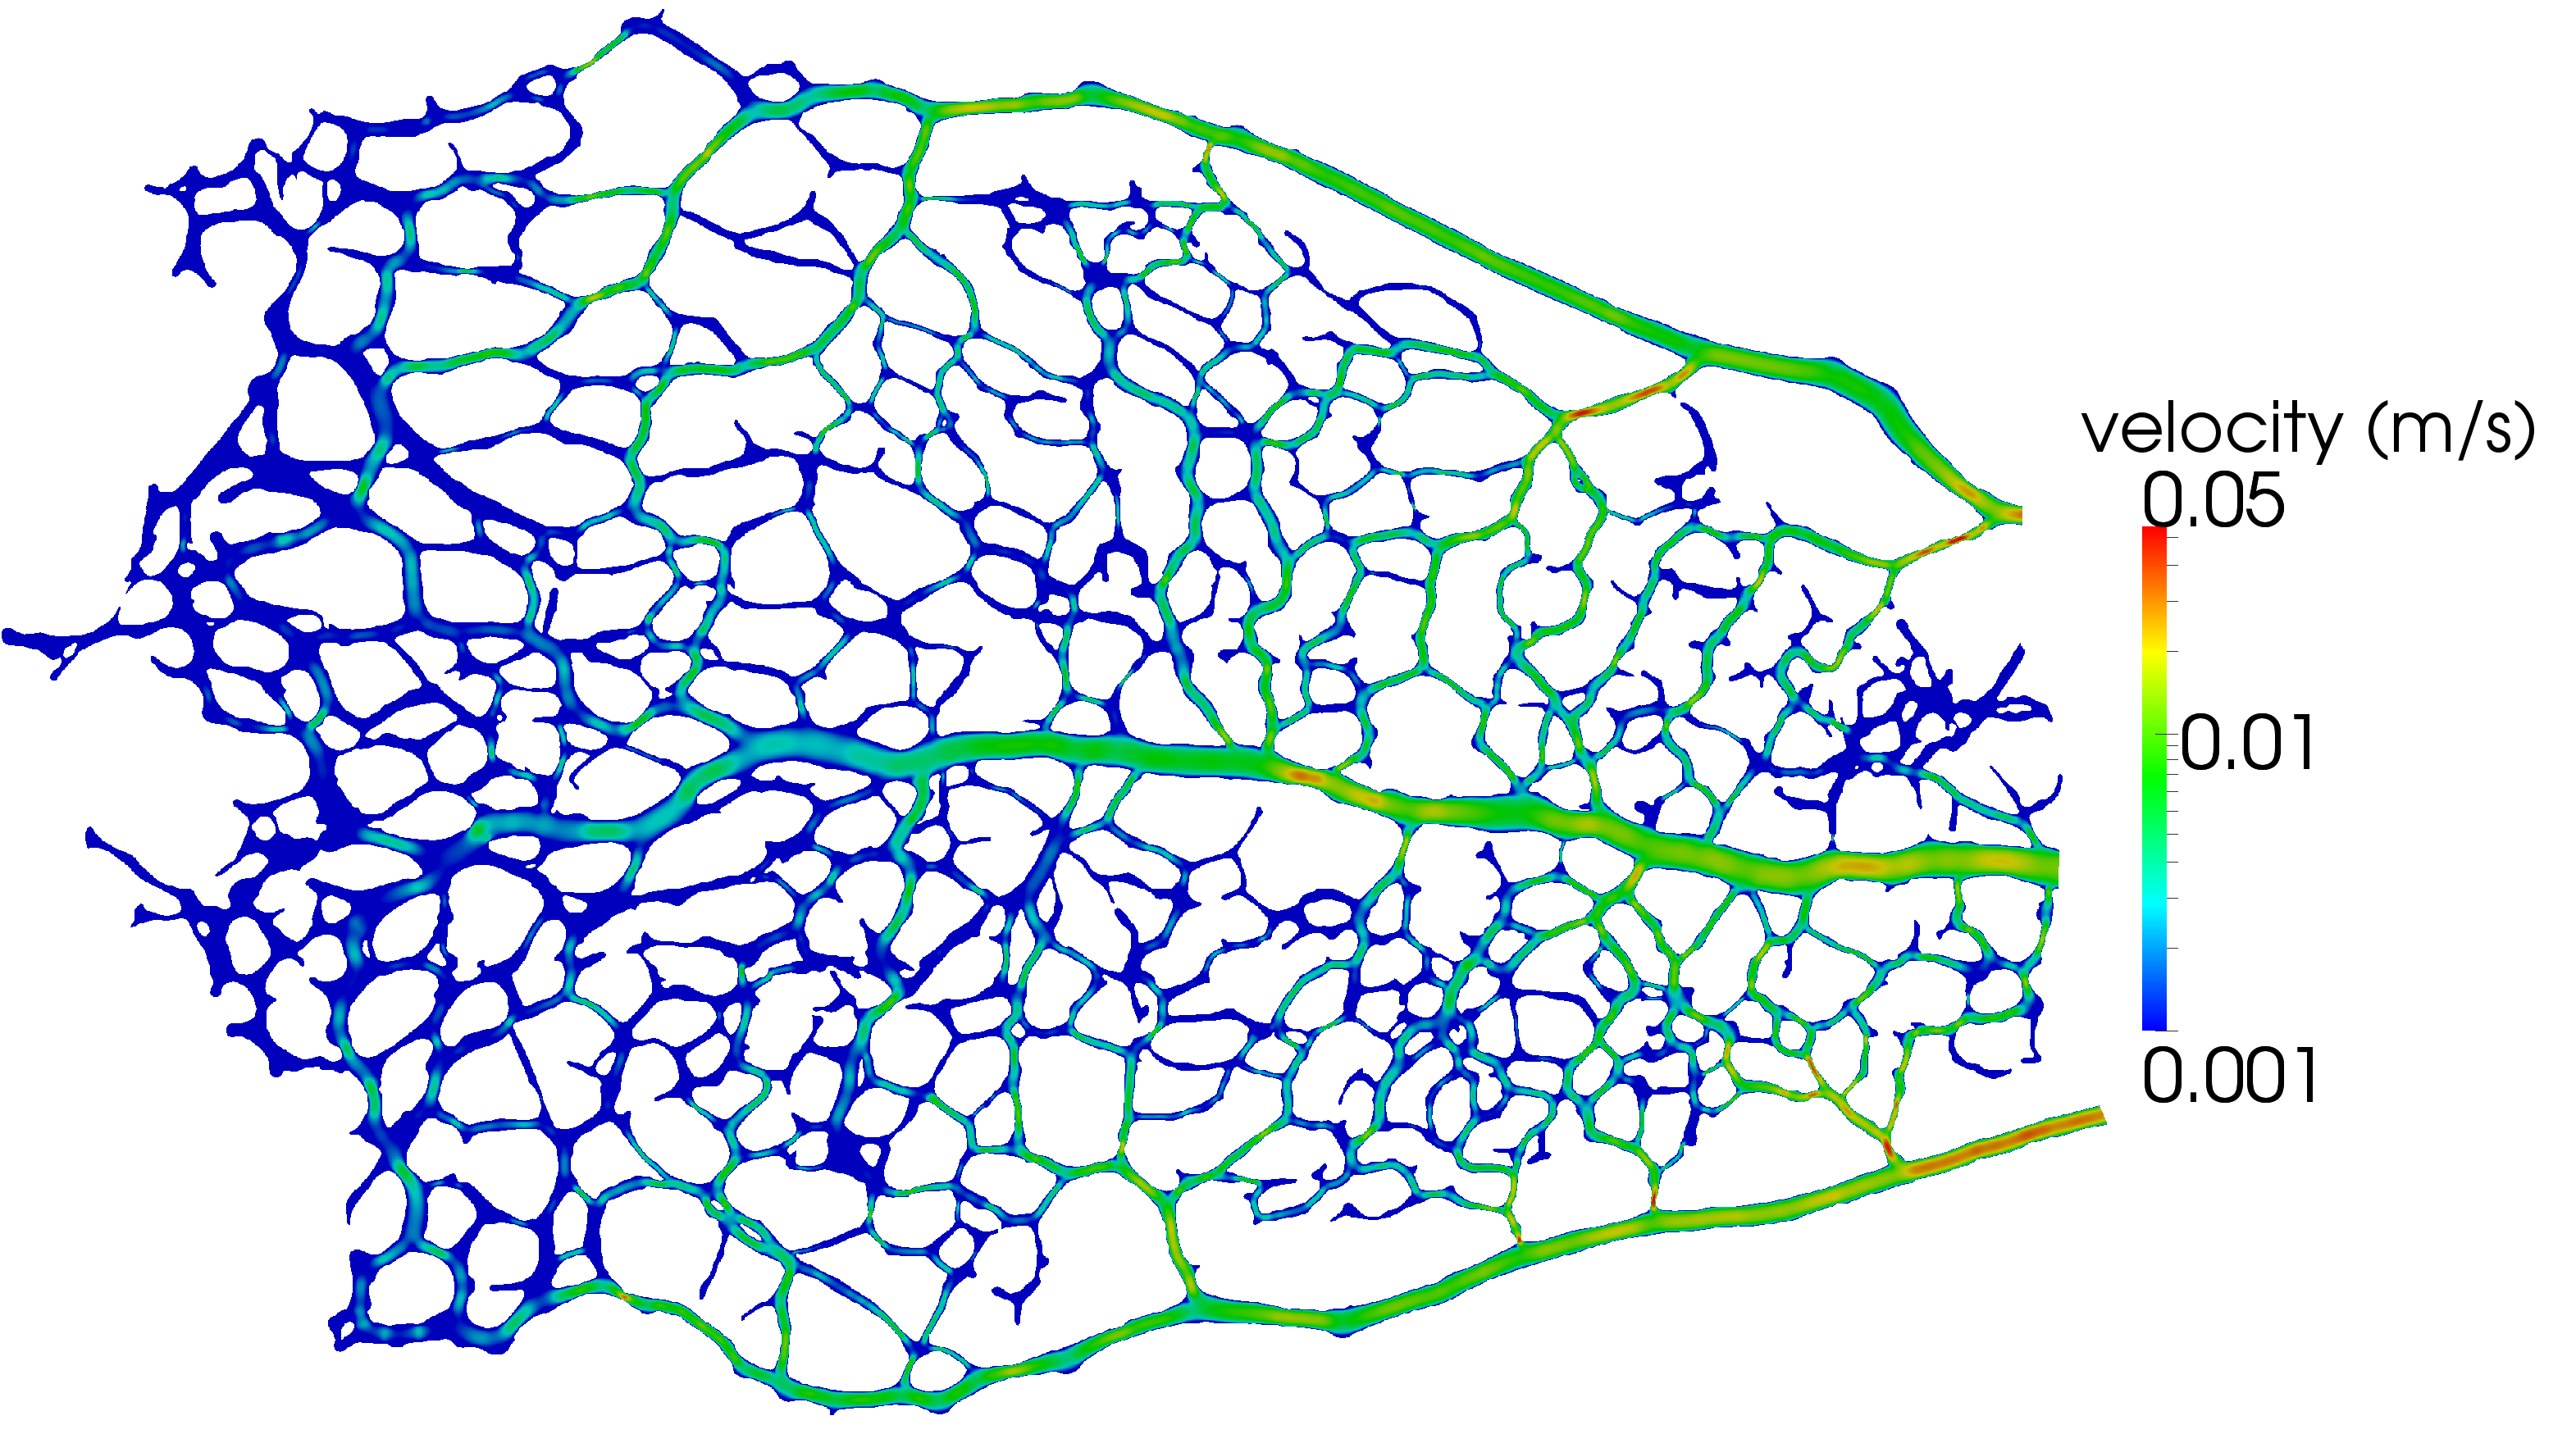
Table 6 presents the largest velocity magnitude recovered for a wider range of OPP values. It can be seen how peak velocity increases by approximately for every increase in OPP. The linear relationship between pressure difference driving flow in the domain and peak velocity indicates that flow occurs in the Stokes regime (i.e. inertial forces are small compared to viscous forces). This result is expected given the typical Reynolds numbers reported in the literature for microcirculation (e.g. for arterioles, venules, and capillaries, respectively (Popel and Johnson,, 2005)).
| OPP () | Domain peak velocity () |
|---|---|
| 25 | 18.97 |
| 35 | 26.65 |
| 45 | 34.31 |
| 55 | 41.96 |
| 65 | 49.61 |
We conclude that the inlet/outlet boundary conditions play a secondary role in determining the flow patterns in the network, hence no modulation in the WSS experienced by the endothelium is expected via changes in OPP (this does not include changes due to autoregulation of the vessels themselves). Changes in vessel network geometry are expected to be the main drivers behind haemodynamic reorganisation during development. This observation supports the idea that regression of a given vessel segment will affect the flow patterns in nearby segments, leading to potential increases in WSS that may contribute to vessel maturation.
References
- Aidun and Clausen, (2010) Aidun, C. K. and Clausen, J. R. (2010). Lattice-Boltzmann Method for Complex Flows. Annual Review of Fluid Mechanics, 42(1):439–472.
- Alm and Bill, (1973) Alm, A. and Bill, A. (1973). Ocular and optic nerve blood flow at normal and increased intraocular pressures in monkeys (Macaca irus): a study with radioactively labelled microspheres including flow determinations in brain and some other tissues. Experimental Eye Research, 15(1):15–29.
- Antiga et al., (2008) Antiga, L., Piccinelli, M., Botti, L., Ene-Iordache, B., Remuzzi, A., and Steinman, D. A. (2008). An image-based modeling framework for patient-specific computational hemodynamics. Medical & biological engineering & computing, 46(11):1097–112.
- Barber et al., (1996) Barber, C. B., Dobkin, D. P., and Huhdanpaa, H. (1996). The quickhull algorithm for convex hulls. ACM Transactions on Mathematical Software, 22(4):469–483.
- Bentley et al., (2013) Bentley, K., Jones, M., and Cruys, B. (2013). Predicting the future: Towards symbiotic computational and experimental angiogenesis research. Experimental cell research, 319(9):1240–6.
- Bernabeu et al., (2013) Bernabeu, M. O., Nash, R. W., Groen, D., Carver, H. B., Hetherington, J., Krüger, T., and Coveney, P. V. (2013). Impact of blood rheology on wall shear stress in a model of the middle cerebral artery. Interface Focus, 3(2):20120094.
- Bouzidi et al., (2001) Bouzidi, M., Firdaouss, M., and Lallemand, P. (2001). Momentum transfer of a Boltzmann-lattice fluid with boundaries. Physics of Fluids, 13(11):3452.
- Boyd et al., (2007) Boyd, J., Buick, J. M., and Green, S. (2007). Analysis of the Casson and Carreau-Yasuda non-Newtonian blood models in steady and oscillatory flows using the lattice Boltzmann method. Physics of Fluids, 19(9):093103.
- Brown et al., (2005) Brown, A. S., Leamen, L., Cucevic, V., and Foster, F. S. (2005). Quantitation of hemodynamic function during developmental vascular regression in the mouse eye. Investigative ophthalmology & visual science, 46(7):2231–7.
- Caiazzo, (2005) Caiazzo, A. (2005). Analysis of Lattice Boltzmann Initialization Routines. Journal of Statistical Physics, 121(1-2):37–48.
- Chen et al., (2012) Chen, Q., Jiang, L., Li, C., Hu, D., Bu, J.-w., Cai, D., and Du, J.-l. (2012). Haemodynamics-driven developmental pruning of brain vasculature in zebrafish. PLoS Biology, 10(8):e1001374.
- Chen and Doolen, (1998) Chen, S. and Doolen, G. D. (1998). Lattice Boltzmann method for fluid flows. Annual Review of Fluid Mechanics, 30(1):329–364.
- Chien, (1970) Chien, S. (1970). Shear Dependence of Effective Cell Volume as a Determinant of Blood Viscosity. Science, 168(3934):977–979.
- Feke et al., (1989) Feke, G. T., Tagawa, H., Deupree, D. M., Goger, D. G., Sebag, J., and Weiter, J. J. (1989). Blood flow in the normal human retina. Investigative ophthalmology & visual science, 30(1):58–65.
- Formaggia et al., (2009) Formaggia, L., Quarteroni, A., and Veneziani, A. (2009). Cardiovascular Mathematics. Modeling and simulation of the circulatory system. Springer-Verlag Italia, Milano.
- Franco et al., (2008) Franco, C. A., Mericskay, M., Parlakian, A., Gary-Bobo, G., Gao-Li, J., Paulin, D., Gustafsson, E., and Li, Z. (2008). Serum response factor is required for sprouting angiogenesis and vascular integrity. Developmental cell, 15(3):448–61.
- Fruttiger, (2007) Fruttiger, M. (2007). Development of the retinal vasculature. Angiogenesis, 10(2):77–88.
- Ganesan et al., (2010) Ganesan, P., He, S., and Xu, H. (2010). Development of an image-based network model of retinal vasculature. Annals of biomedical engineering, 38(4):1566–85.
- Gariano and Gardner, (2005) Gariano, R. F. and Gardner, T. W. (2005). Retinal angiogenesis in development and disease. Nature, 438(7070):960–6.
- Geudens and Gerhardt, (2011) Geudens, I. and Gerhardt, H. (2011). Coordinating cell behaviour during blood vessel formation. Development, 138(21):4569–83.
- Groen et al., (2013) Groen, D., Hetherington, J., Carver, H. B., Nash, R. W., Bernabeu, M. O., and Coveney, P. V. (2013). Analysing and modelling the performance of the HemeLB lattice-Boltzmann simulation environment. Journal of Computational Science, 4(5):412–422.
- Hardy et al., (1994) Hardy, P., Abran, D., Li, D. Y., Fernandez, H., Varma, D. R., and Chemtob, S. (1994). Free radicals in retinal and choroidal blood flow autoregulation in the piglet: interaction with prostaglandins. Investigative ophthalmology & visual science, 35(2):580–91.
- Heywood et al., (1996) Heywood, J. G., Rannacher, R., and Turek, S. (1996). Artificial boundaries and flux and pressure conditions for the incompressible Navier-Stokes equations. International Journal for Numerical Methods in Fluids, 22(5):325–352.
- Jones et al., (2006) Jones, E. a. V., le Noble, F., and Eichmann, A. (2006). What determines blood vessel structure? Genetic prespecification vs. hemodynamics. Physiology, 21:388–95.
- Kiel, (2010) Kiel, J. W. (2010). The Ocular Circulation. Morgan & Claypool Life Sciences.
- Krüger et al., (2009) Krüger, T., Varnik, F., and Raabe, D. (2009). Shear stress in lattice Boltzmann simulations. Physical Review E, 79(4):046704.
- Ladd and Verberg, (2001) Ladd, A. and Verberg, R. (2001). Lattice-Boltzmann simulations of particle-fluid suspensions. Journal of Statistical Physics, 104(September):1191–1251.
- Ladd, (1994) Ladd, A. J. C. (1994). Numerical simulations of particulate suspensions via a discretized Boltzmann equation. Part 1. Theoretical foundation. Journal of Fluid Mechanics, 271:285.
- Lätt and Chopard, (2008) Lätt, J. and Chopard, B. (2008). Straight velocity boundaries in the lattice Boltzmann method. Physical Review E, 77(5):056703.
- Lawson and Weinstein, (2002) Lawson, N. D. and Weinstein, B. M. (2002). Arteries and veins: making a difference with zebrafish. Nature reviews. Genetics, 3(9):674–82.
- Liu et al., (2009) Liu, D., Wood, N. B., Witt, N., Hughes, A. D., Thom, S. A., and Xu, X. Y. (2009). Computational Analysis of Oxygen Transport in the Retinal Arterial Network. Current Eye Research, 34(11):945–956.
- Lobov et al., (2005) Lobov, I. B., Rao, S., Carroll, T. J., Vallance, J. E., Ito, M., Ondr, J. K., Kurup, S., Glass, D. a., Patel, M. S., Shu, W., Morrisey, E. E., McMahon, A. P., Karsenty, G., and Lang, R. a. (2005). WNT7b mediates macrophage-induced programmed cell death in patterning of the vasculature. Nature, 437(7057):417–21.
- Mazzeo and Coveney, (2008) Mazzeo, M. D. and Coveney, P. V. (2008). HemeLB: A high performance parallel lattice-Boltzmann code for large scale fluid flow in complex geometries. Computer Physics Communications, 178(12):894–914.
- Mei et al., (2006) Mei, R., Luo, L.-S., Lallemand, P., and D’Humières, D. (2006). Consistent initial conditions for lattice Boltzmann simulations. Computers & Fluids, 35(8-9):855–862.
- Nagaoka and Yoshida, (2006) Nagaoka, T. and Yoshida, A. (2006). Noninvasive evaluation of wall shear stress on retinal microcirculation in humans. Investigative ophthalmology & visual science, 47(3):1113–9.
- Nash et al., (2014) Nash, R. W., Carver, H. B., Bernabeu, M. O., Hetherington, J., Groen, D., Krüger, T., and Coveney, P. V. (2014). Choice of boundary condition and collision operator for lattice-Boltzmann simulation of moderate Reynolds number flow in complex domains. Physical Review E, 89:023303.
- Ninomiya and Inomata, (2006) Ninomiya, H. and Inomata, T. (2006). Microvasculature of the mouse eye: Scanning electron microscopy of vascular corrosion casts. Journal of Experimental Animal Science, 43(3):149–159.
- Paques, (2003) Paques, M. (2003). Structural and Hemodynamic Analysis of the Mouse Retinal Microcirculation. Investigative Ophthalmology & Visual Science, 44(11):4960–4967.
- Popel and Johnson, (2005) Popel, A. S. and Johnson, P. C. (2005). Microcirculation and Hemorheology. Annual review of fluid mechanics, 37:43–69.
- Potente et al., (2011) Potente, M., Gerhardt, H., and Carmeliet, P. (2011). Basic and therapeutic aspects of angiogenesis. Cell, 146(6):873–87.
- Pries et al., (1996) Pries, A. R., Secomb, T. W., and Gaehtgens, P. (1996). Biophysical aspects of blood flow in the microvasculature. Cardiovascular research, 32(4):654–67.
- Schroeder et al., (2003) Schroeder, W. J., Martin, K., and Lorensen, W. E. (2003). The Visualization Toolkit: An Object-Oriented Approach to 3D Graphics, Third Edition.
- Siekmann and Lawson, (2007) Siekmann, A. F. and Lawson, N. D. (2007). Notch signalling limits angiogenic cell behaviour in developing zebrafish arteries. Nature, 445(7129):781–4.
- Siggers and Waters, (2005) Siggers, J. H. and Waters, S. L. (2005). Steady flows in pipes with finite curvature. Physics of Fluids, 17(7):077102.
- Stahl et al., (2010) Stahl, B., Chopard, B., and Latt, J. (2010). Measurements of wall shear stress with the lattice Boltzmann method and staircase approximation of boundaries. Computers & Fluids, 39(9):1625–1633.
- Uemura et al., (2006) Uemura, A., Kusuhara, S., Katsuta, H., and Nishikawa, S.-I. (2006). Angiogenesis in the mouse retina: a model system for experimental manipulation. Experimental cell research, 312(5):676–83.
- Vogel et al., (2003) Vogel, J., Kiessling, I., Heinicke, K., Stallmach, T., Ossent, P., Vogel, O., Aulmann, M., Frietsch, T., Schmid-Schönbein, H., Kuschinsky, W., and Gassmann, M. (2003). Transgenic mice overexpressing erythropoietin adapt to excessive erythrocytosis by regulating blood viscosity. Blood, 102(6):2278–84.
- Wang et al., (2007) Wang, Y., Bower, B. a., Izatt, J. a., Tan, O., and Huang, D. (2007). In vivo total retinal blood flow measurement by Fourier domain Doppler optical coherence tomography. Journal of biomedical optics, 12(4):041215.
- Wang et al., (2009) Wang, Y., Fawzi, A., Tan, O., Gil-Flamer, J., and Huang, D. (2009). Retinal blood flow detection in diabetic patients by Doppler Fourier domain optical coherence tomography. Optics Express, 17(5):4061.
- Watson et al., (2012) Watson, M. G., McDougall, S. R., Chaplain, M. a. J., Devlin, a. H., and Mitchell, C. a. (2012). Dynamics of angiogenesis during murine retinal development: a coupled in vivo and in silico study. Journal of the Royal Society, Interface / the Royal Society, 9(74):2351–64.
- White et al., (2003) White, B., Pierce, M., Nassif, N., Cense, B., Park, B., Tearney, G., Bouma, B., Chen, T., and de Boer, J. (2003). In vivo dynamic human retinal blood flow imaging using ultra-high-speed spectral domain optical coherence tomography. Optics express, 11(25):3490–7.
- Windberger et al., (2003) Windberger, U., Bartholovitsch, A., Plasenzotti, R., Korak, K., and Heinze, G. (2003). Whole blood viscosity, plasma viscosity and erythrocyte aggregation in nine mammalian species: reference values and comparison of data. Exp Physiol, 88(3):431–440.
- Windberger et al., (2005) Windberger, U., Grohmann, K., Goll, a., Plasenzotti, R., and Losert, U. (2005). Fetal and juvenile animal hemorheology. Clinical hemorheology and microcirculation, 32(3):191–7.
- Wright and Harris, (2008) Wright, W. S. and Harris, N. R. (2008). Ozagrel attenuates early streptozotocin-induced constriction of arterioles in the mouse retina. Experimental eye research, 86(3):528–36.
- Wright et al., (2009) Wright, W. S., Messina, J. E., and Harris, N. R. (2009). Attenuation of diabetes-induced retinal vasoconstriction by a thromboxane receptor antagonist. Experimental eye research, 88(1):106–12.
- Wright et al., (2012) Wright, W. S., Yadav, A. S., McElhatten, R. M., and Harris, N. R. (2012). Retinal blood flow abnormalities following six months of hyperglycemia in the Ins2(Akita) mouse. Experimental eye research, 98:9–15.
- Xiong and Zhang, (2010) Xiong, W. and Zhang, J. (2010). Shear stress variation induced by red blood cell motion in microvessel. Annals of biomedical engineering, 38(8):2649–59.
- Yazdanfar, (2003) Yazdanfar, S. (2003). In Vivo Imaging of Human Retinal Flow Dynamics by Color Doppler Optical Coherence Tomography. Archives of Ophthalmology, 121(2):235.
- Zhi et al., (2011) Zhi, Z., Cepurna, W., Johnson, E., Shen, T., Morrison, J., and Wang, R. K. (2011). Volumetric and quantitative imaging of retinal blood flow in rats with optical microangiography. Biomedical optics express, 2(3):579–91.
- Zhi et al., (2012) Zhi, Z., Yin, X., Dziennis, S., Wietecha, T., Hudkins, K. L., Alpers, C. E., and Wang, R. K. (2012). Optical microangiography of retina and choroid and measurement of total retinal blood flow in mice. Biomedical optics express, 3(11):2976–86.
- Ziegler, (1993) Ziegler, D. P. (1993). Boundary conditions for lattice Boltzmann simulations. Journal of Statistical Physics, 71(5-6):1171–1177.