Low Ionization Emission Lines in Quasars
Clues from Oi 8446 and the Caii Triplet111Submitted to the Astronomical Review.
Abstract
The formation of low emission lines in quasars and active galactic nuclei is still an open issue. Aided by the organizing power of the 4D eigenvector 1 scheme, we review basic developments since the 1980s, devoting special attention to the Caii IR triplet and the Oi 8446 emission lines. Coverage of these lines is cumbersome since they are shifted in an inconvenient IR domain already at modest redshifts ( 0.2). Their detection is also difficult since they are faint and often buried in the Caii absorption of the host galaxy. We discuss how these lines can provide unambiguous constraints on the physical conditions of the broad line emitting regions of quasars when detected in emission, and summarise preliminary results for a sample of luminous, intermediate redshift quasars.
1 Introduction
Several fields of quasar astronomy are still on uncertain grounds. Although a basic understanding in terms of accretion on a supermassive black hole seems now established [12, and references therein], there are several aspects of quasars that still defy comprehension or at least a consistent view. Even if we learned many important things on quasars in the past fifty years, we have to acknowledge that mechanisms giving rise to continuum emission in several bands of the electromagnetic spectrum are still poorly understood, as recently stressed by several authors [12, 1]. Specifically, it is not clear how soft X-ray emission originates, and why radio emission is strong in a minority of quasar and faint in the wide majority. And we do not know well how quasars evolve since there is no major sign of evolution from redshift almost 0 to (at least) 4, when the Universe was about of its current age. A maze of apparently confusing pieces of evidence still fogs the connection between evolution and unification schemes. Not to mention the processes that give rise to prominent line emission. Going beyond heuristic considerations based on the nebular physics developed to interpret Hii regions and planetary nebulæ in the 1950s and 1960s has proved a daunting challenge. The complexity of quasar emitting regions, dense gas exposed to an incredibly strong radiation field became clear relatively early after quasar discovery [10, 11]. So it is perhaps not surprising if some basic and important issues have been left in a limbo, without a clear understanding ever being reached, as discussed by Sulentic et al. [59]. One of the issues concerns the emission mechanism of low-ionization lines in quasars.
If we start looking at quasars from their optical and UV spectra, one of their notable properties is the coexistence of low and high emission lines, where for low and high ionization we understand lines emitted by ionic species whose ionization potential is eV (hydrogen, singly ionized ionic species of magnesium, carbon, iron, calcium), and eV (triply ionized carbon, helium, four times ionised nitrogen) respectively. There is now convincing evidence that high ionization and hydrogen lines are mainly photoionized by the strong quasar continuum since emission line luminosity is proportional to continuum luminosity (at least to a first approximation, [52]) and lines respond to continuum luminosity changes [47]. The issue is still not solved at the time of writing for Feii, whose emission features extend from the far UV to the near IR and are in some cases dominating the appearance of optical quasar spectra [29, 64].
2 Organizing Quasar Diversity: Low Ionization Lines in the 4DE1 Context
The 4D Eigenvector 1 (4DE1) is a parameter space best suited to understand the phenomenology of the of the broad line region (BLR), nowadays an “umbrella term” that embraces an unresolved but complex region where all broad lines are emitted [58, 60, 38, 37, 39, 56, 68, 42]. Following the 4DE1 scheme, sources can be divided in two populations, A and B, with separation at FWHM(H) = 4000 km s-1. Several differences are found between sources above and below this limits (see Refs. [56, 55] for reviews). Population A shows: (1) a scarcity of RL sources, (2) strong/moderate Feii emission, (3) a soft X-ray excess, (4) high-ionization broad lines showing blueshift/asymmetry and (5) broad line profiles are best described by Lorentz fits. Meanwhile, Population B: (1) includes the large majority of the RL sources, (2) shows weak/moderate Feii emission, (3) does not show a soft X-ray excess nor a prominent high ionization line (HIL) blueshift/asymmetry, and (4) their H profiles are best fit with double Gaussian models. Considering that the eigenvector 1 identifies a single dimension in a multidimensional space, it is appropriate to talk of a “sequence along the eigenvector 1” (see for example Fig. 1 of Marziani & Sulentic [30]). The equivalent width of HILs is anti-correlated with Feii4570 equivalent width [3, 58], suggesting a systematic decrease in ionization level from population B to population A [38]. In addition, there are systematic Eddington ratio differences along the sequence, with Pop. A sources being higher radiators. The blue ward asymmetry observed in the Civ1549 profile indicates that at least a part of the HILs is emitted in outflowing gas where the receding part of the flow is obscured [19, 32, 49]. The prominence of the outflow is maximised at the high Eddington ratio end of the 4DE1 sequence [32, 33]. Interestingly enough, there are trends that are preserved along the 4DE1 sequence. For example, Mgii2800 and Feii show systematically narrower profiles than H [34, 61]. If motion is predominantly virial, then Feii and Mgii2800 might be emitted at larger distance from the ionizing sources than H.
In Figure 1 of Dultzin-Hacyan et al. [14] we can see two extreme orientations. At one extreme of this configuration – when the central source is seen face-on, parallel to the axis of the cone – Civ1549 shows an asymmetric profile and a minimum equivalent width, and Feii – Caii emission is strong. The accretion disk obscures the receding half of the emitting clouds, allowing us to see only the approaching side. When the line of sight forms an angle with respect to the disk axis, we expect to have symmetric Civ1549 profiles and less Feii – Caii emission. The H core shares the same behavior as Fe iiopt. It is unshifted, symmetric, and is consistent with a flattened or nearly spherical distribution of clouds.
Summing up, the location of a source in the 4DE1 sequence appears to be governed by Eddington ratio with orientation acting as a source of scatter [38, 63]. Black hole mass and, to a lower extent, metallicity are also found to have a broadening effect on the 4DE1 sequence [57, 67]. Even if 4DE1 eases the systematization of quasar spectral properties, a full understanding of some parameters used in the formulation of the 4DE1 itself is still missing.
3 Low Ionization Lines: the Feii Problem
Photoionization models have troubles in explaining the intensities of some prominent low-ionization lines (LILs): the wording “Feii problem” has been widely used to address the issue of the impossibility to reproduce the strength of Feii (optical and UV) with simple photoionization models [66]. The complexity of the energy level structure of the Feii ion and the uncertainties in the atomic data make theoretical models calculations very difficult [45, 21, 5]. It was recognised in the late 1970s that an important – albeit insufficient – mechanism for producing optical Feii emission is collisional excitation [48]. Over the years, the importance of continuum and line fluorescence (especially Ly and Feii lines self fluorescence) has been also recognized [54] for explaining the whole Feii emission from UV to IR. However, the large number of electronic transitions of the singly ionized iron ion form a pseudo-continuum especially prominent in the UV range between 2000 and 4000 Å. As stressed since long [66], Feii can be the single largest contributor to the emission line spectra, and is therefore a major cooling agent in the BLR. The effect of cooling is to lower excitation temperature and hence to saturate Feii emission with increasing iron abundance [15, 54, 65]. Photoionization models fail to account for strong Feii emitters with 1, where in the intensity ratio between the Feii blend at 4570 Å and H. It is still unclear whether models are inadequate, or an independent heating source is needed. At any rate, the problems of photoionization models led to the suggestion that Feii is emitted in a region which is not radiatively heated, arguably of high density (1011.5 –1012 cm-3), high column density ( 1024 cm-2), and relatively low electron temperature, T 8000 K [8, 9, 21, 16, 41]. A possible scenario involves a shocked region shielded from the central continuum source [23].
The locus of the emission of all LILs in the BLR is subject of debate since many years. As far as spatial location of Feii emission is concerned, circumstantial evidence indicated the outer part of the BLR [50] or the outer part of the accretion disk [7, 14]. Recent efforts were successful in estimating the reverberation distance of Fe iiopt in two low- sources with Fe iiopt of moderate intensity [2], indicating a time-delay distance 1.5 times larger than the one of H, as found for Mgii2800 [35].
4 The Calcium IR Triplet and Oi8446
Oi8446 –
Given the difficult interpretation and prediction of the Feii spectrum, one could resort to the study of the a much simpler ionic species. Especially helpful could be the near IR Caii triplet at 8498, 8542, 8662 Å (hereafter indicated with Caii for brevity), and the Oi8446 emission lines. It has been suggested that these lines are emitted under the same physical conditions as the Feii lines [21, 16, 50, 41, 40].
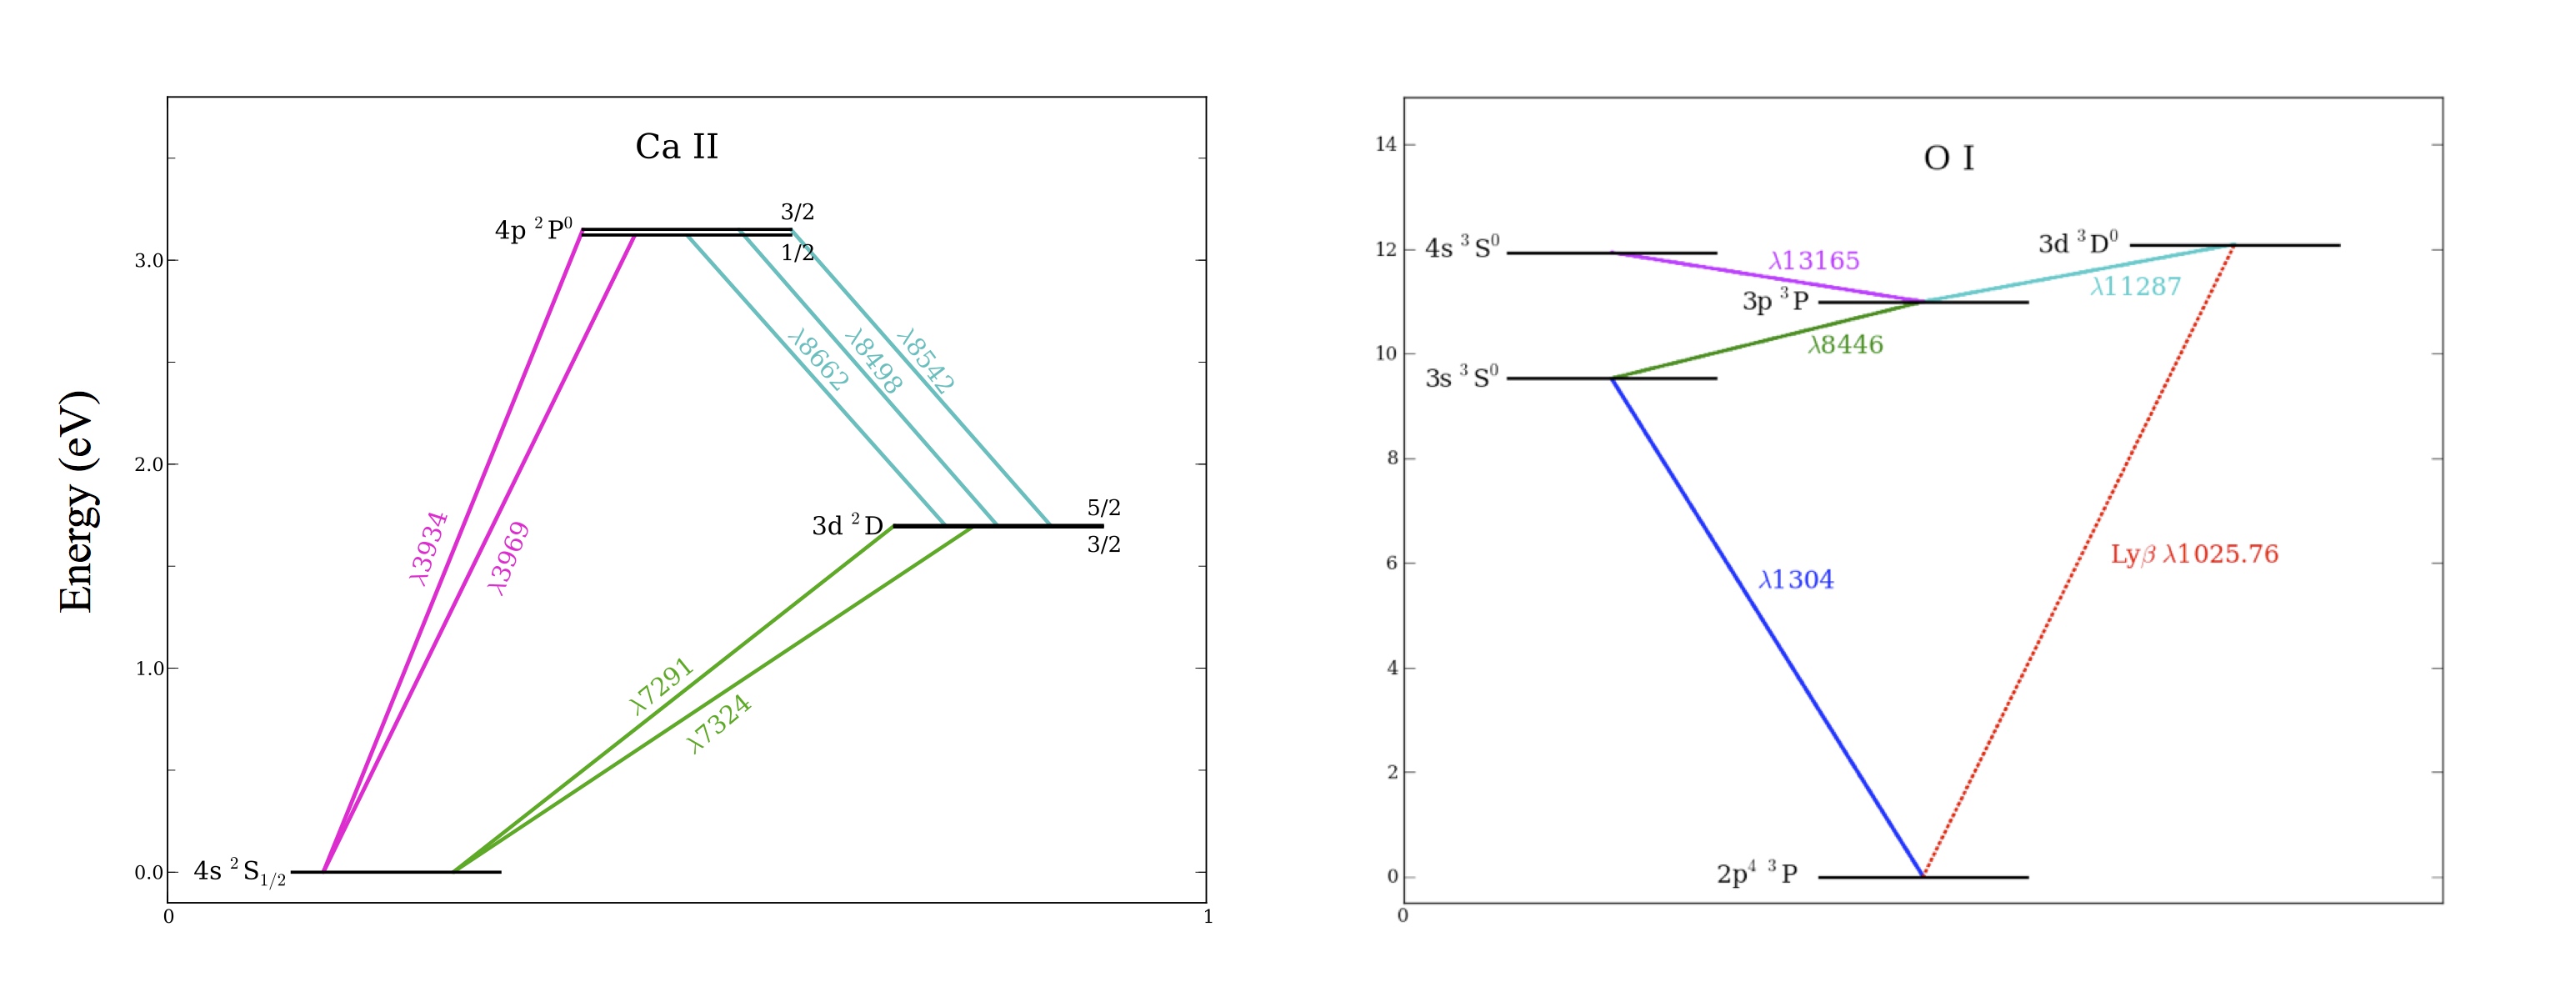
Grandi [20] carried out a landmark observational study of the Oi8446 line for thirteen Seyfert 1 galaxies, showing that the strength and width of these lines are very similar to the H line. He suggested that the emission is associated to the BLR due to the lack of a narrow component.555Landt et al. [25] were able to detect the narrow component in Seyfert 1 and 1.5 galaxies, therefore showing that Oi8446 emission is not a exclusive of the BLR. In the following we will be concerned only with broad Oi8446 emission. Netzer & Penston [44] proposed Bowen fluorescence (or Ly fluorescence) as the main excitation process for Oi8446. There is a coincidence of the energy levels between hydrogen and neutral oxygen: Ly (1025.72 Å) can excite the O i ground state resonance transition 2p 3d (1025.88 Å) if the thermal line width is as expected at K, a typical temperature of photoionized gases. A simplified Grotrian diagram of the O0 atom is shown in Fig. 1; the red line identifies the Ly-induced transition. The Oi8446 line can also be excited by H if the gas is optically thick in this line [20]. During the cascade emission to the ground level, other O i photons are emitted: Oi 11287 and Oi 1304. Hence, the photon flux ratio between 11287 and 8446 has to be exactly one; smaller values suggest that other excitation processes increase the emission of 8446.
The Oi 7775 line was first detected by Rodríguez-Ardila et al. [51] in one object, and later detected for several objects by Landt et al. [25]. This line is produced by collisional excitation,666The lower level associated to this feature, 3s , is the ground level of the quintuplet system of Oi and is metastable. and thus the presence of this mechanism was corroborated. The transitions probabilities imply Oi 7775 / 8446 1.1 for recombination, and Oi 7775 / 8446 0.3 for collisional excitation. Landt et al. [25] could recognize both contributions in different proportions, given that the observed Oi 8446 intensity is usually in excess with respect to value expected from Ly fluorescence [51]. Matsuoka et al. [41], using photoionization models, verified that both Ly fluorescence and collisional excitation produce the Oi emission in a gas with 1011.5 cm-3, illuminated by radiation with a ionization parameter 10-2.5. Therefore, Bowen fluorescence is not the only excitation process for Oi8446 although it accounts for most or at least half of the photon flux in the wide majority of the sources studied by Landt et al. [25]. Continuum fluorescence, recombination and collisional excitation by electrons are likely be present in different proportions for each source.
Caii –
Singly-ionized calcium emission is mainly due to three multiplets emerging from five levels (Fig. 1): (1) the optical H and K lines (3933, 3968 Å) are emitted from level 4p to the ground level 4s; (2) the infrared multiplet, 8498, 8542, 8662 Å arises from transitions from the 4p level to the 3d metastable levels; (3) finally, the forbidden multiplet, 7291, 7324 Å, arises from the 3d metastable levels to the ground level. The ionization potential of Ca+ is 11.871 eV, so the gas where the IR triplet is emitted should be strongly shielded from incident ionization at wavelengths shortward of Ly (10.20 eV). We expect that this region is neutral, optically thick and with high column density [16, 22]. Due to the similarity between the energy of Ly and the ionization potential of Ca+, the 3d metastable level is highly populated and the collisional excitation process leading to the Caii IR triplet emission is efficient. Attempting to reproduce the gas conditions requires that processes like free-free heating, photoionization from excited levels, bound-free heating and Compton recoil ionization be included in photoionization calculations. These processes are able to heat neutral gas with great depths [16] and produce low ionization lines without the need to call upon nonradiative heating processes.
The first survey of Caii near-IR triplet in luminous Seyfert 1 galaxies and low- quasars was performed by Persson [46]. He could clearly detect the Caii emission in fourteen objects, and he could also test that the three lines of the calcium triplet emerge from an optically thick region since they show the same intensity within the uncertainties. In addition, Persson [46] found that the field velocities of Caii and Oi8446 are closely related, with Oi8446 being somewhat narrower. On other hand, Rodríguez-Ardila et al. [50] did not find differences in widths, suggesting that Oi8446 and Caii are emitted at the same distance from the ionizing source.
Comparing Pa 12818, Oi 11287, Feii11127 and Caii triplet, Rodríguez-Ardila et al. [50] proposed that Pa is emitted in an intermediate part of the BLR, while Feii, Oi8446 and Caii are emitted in the outermost part of the BLR. Matsuoka et al. [41] compared EW predicted from photoionization models to the observed ones, and concluded that HILs should be emitted in regions which are more highly ionized and thus closer to the ionizing source. Comparing the intensity ratios of Caii/Oi8446 and Oi 11287/Oi8446 with photoionization models predictions for several sources, Matsuoka et al. [40] found that these lines are being emitted in gases with similar density, but exposed to different ionizing photon flux. This is likely due to a difference in distance from the central continuum source of the quasar.
A natural site of emission is the accretion disk that offers the high column density required for emitting LILs [6, 7]. Dultzin-Hacyan et al. [14] found a very similar behavior between the ratios of Feii4570/H and Caii/H as a function of FWHM(H), respectively, suggesting that they arise in the same region, an optically thick accretion disk. Collin-Souffrin et al. [9] and Ferland & Persson [16] proposed that there may be a nonradiative source of heating which can be the dissipation of mechanical heating inside the accretion disk. We want to point out that although the emitting regions may be at the same distance, they do not have to be the same physical region. For example, we may envision a configuration of plane parallel distribution of BLR clouds above and below the accretion disk. In this configuration the clouds dynamics is dominated by gravity and thus the emitting gas is virialized. Some of these clouds might be at the same distance from the ionization source as some regions within the accretion disk. And thus they share the same dynamics. However, they do not necessarily share the same physical conditions. On the other hand, the presence of non gravitational forces such as radiation pressure is not excluded [43]. As we explain below, the emitting gas within the BLR may be subject to different dynamics. This is why in order to accurately fit a broad line we often need more than one component [31, 42].
5 Preliminary Results from Caii and Oi8446 Observations of Quasars
Several important aspects emerge from the previous discussion: LILs like Feii and Caii can be both emitted in a low ionization, dense medium of high column density, possibly shielded from the central continuum sources. The narrower line width of Feii and Mgii2800 indicate that the distance from the central continuum source could be larger than for other LILs like the Balmer lines. The 4DE1 sequence is defined as a sequence of increasing Feii prominence, and we have seen that Feii emission is still not satisfactorily modelled. While there has been a considerable progress with photoionization models of Feii, and photoionization is now supported by the observation of the Feii response to continuum changes [2], it is not clear if strong Feii emitters can be explained in a pure photoionization scheme. According to Collin and Joly, a different source of heating is needed. The strongest Feii emitters show however no solution of continuity with fainter Feii emitters in the 4DE1 sequence. By Occam’s razor, it should be avoided to invoke an additional mechanism if no discontinuity is observed. As we have seen, the Caii and Oi8446 line formation is better understood. What happens to these lines along the 4DE1 sequence?
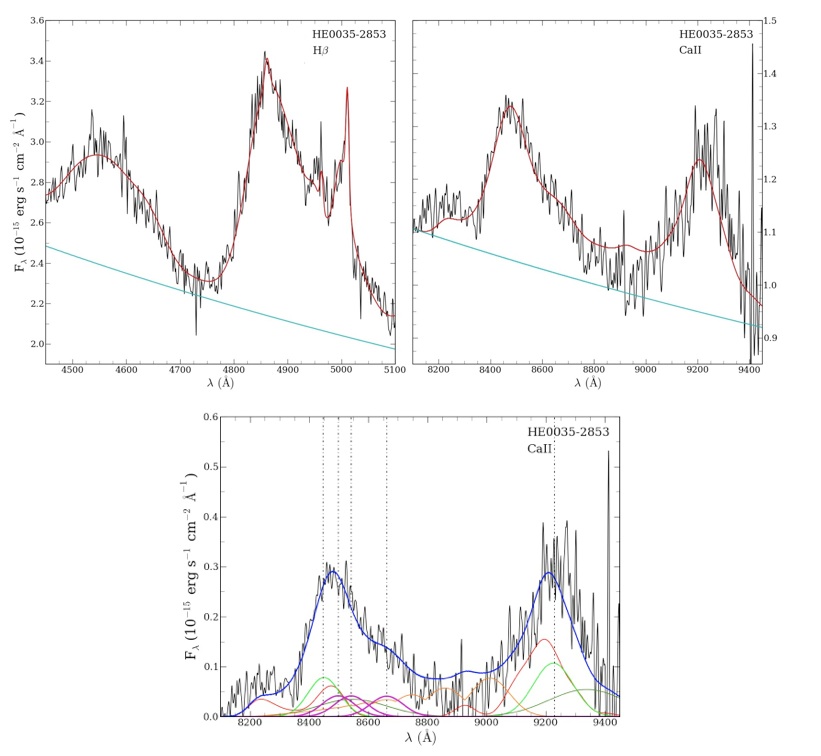
We will not present here a full answer to this question. There are several difficulties to face before a full answer can be obtained. An important side of the issue is observational: Caii and Oi8446 are shifted in the near IR even if redshift is just . Obtaining near IR spectra with the same quality (S/N and dispersion) of optical ones has become possible only in recent times, and there is currently a very limited number of observatories where these lines can be observed in quasars. The consequence is that there are almost no data available even for luminous, low- and intermediate redshift quasars that make most of the samples over which the eigenvector correlations are analysed. The very spectral range around m in rest frame is not well understood. The continuum shape is uncertain, since at m the low energy end of the continuum emitted by the accretion disk, and the high energy end of the hot dust dominating in the mid and far IR merge creating a “hollow” in the spectral energy distribution [26]. In addition, the stellar population of the underlying galaxy bulge is expected to emit a spectrum peaking at m, with Caii in absorption. Turning to the emission lines, significant Feii has been revealed in the range 8000 – 10000 Å [53, 50]. It is interesting to note that the main mechanism responsible for the near IR Feii emission is fluorescence excitation by Ly and in a minimal proportion collisional excitation since the lines at 8900 – 9300 Å are emitted by cascading from a high excitation level that can be populated only by Ly fluorescence. The intensity of these lines are predicted by photoionization calculations and it is possible to model them in the observed spectrum using a template developed ad hoc [18]. The last additional complication in that the Oi8446 and Caii and high order Paschen lines lines are blended together. Extracting information on line fluxes of Oi8446 and Caii requires therefore a careful modelling of the continuum and a multicomponent fit to the emission blend. An example is shown in Fig. 2.
We analyzed a sample of 14 high luminosity Hamburg-ESO quasars with and 0.85 1.64 using the VLT ISAAC IR spectrometer during 2010 in service mode.777A full account of observations of observantions and results will be presented elsewhere, in Martínez-Aldama et al., in preparation. These sources had previous high quality H observations obtained with the same instrument [62, 61, 36]. In addition, the Pa9 line recorded on the same spectra can be used as a proxy of H. Our sample contains 4 Pop. A and 10 Pop. B sources making lower intensity Feii sources (0.1 ) well represented in our sample.
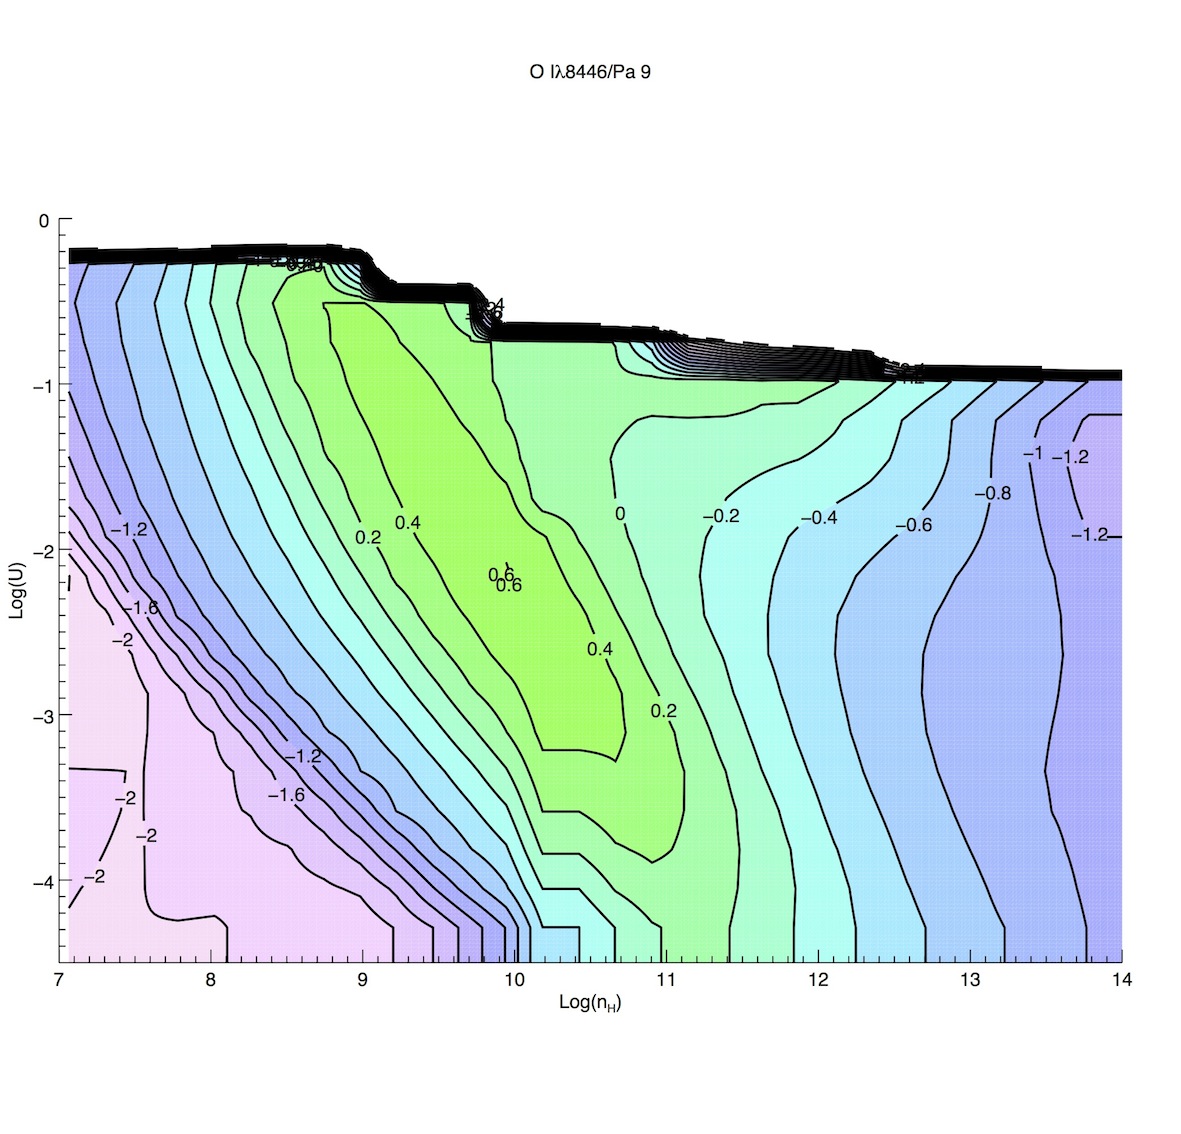
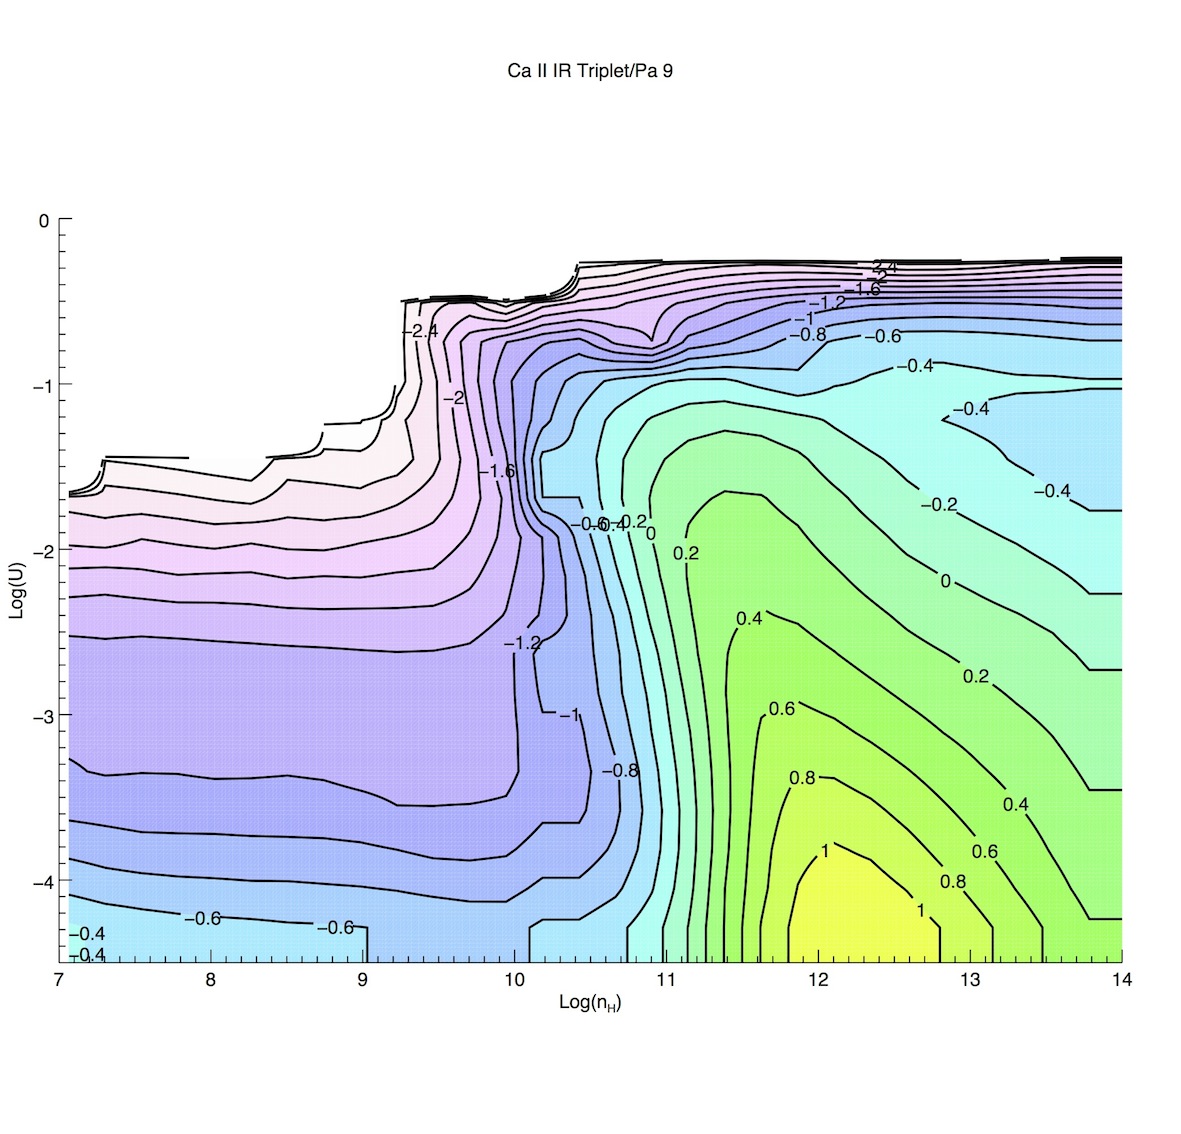
A major result is that Caii is detected in all sources, even in sources where Feii is relatively faint. This has profound implications. Fig. 3 shows the behavior of predicted Oi8446/Pa9 and Caii/Pa9 intensity ratios as a function of hydrogen density and ionization parameter . The ratios have been computed from an array of cloudy 08 [17] simulations that assumed constant and for a gas slab of solar metallicity, = 1023 cm-2, illuminated by a standard quasar continuum. Given the S/N ratio of our spectra, a detection of Caii implies a sharp lower limit to density, 1011.5 cm-3. Lower density values would make Caii undetectable. A second result is that the strongest Caii emitters in our sample, with Caii/H 0.35 imply , and cm-3. Inferences on density and ionization parameters are reinforced by the measures of the Caii/H ratio in extreme Pop. A sources like I Zw 1 or Mark 231: Caii/H 0.4 – 0.5 requires , and cm-3. Therefore, Caii appears to be accounted for within the framework of photoionization models. An additional result emerging from the simulations is the different behaviour of Oi8446 and Caii in the plane (, ): Oi8446 emission if favoured at higher photon flux than Caii. We interpret the difference in behaviour as due to the Bowen fluorescence mechanism that is strongly influenced by the ionizing photon flux. The Bowen mechanism has indeed been found to be the major contributor to the Oi8446 intensity in most active nuclei studied by Landt et al. [25]. The important implication is that Oi8446 emission can originate in deep regions exposed to a large ionizing photon flux provided that column density is high, 1023 cm-2.
The H line profile close to the line base is significantly redshifted in the spectra of Pop. B sources; however, the ratio shift/width 0.1 – 0.2 is modest and indicates predominance of virial broadening. If so, the emitting gas should be exposed to the strongest ionizing photon flux since it is at the smallest distance from the ionizing source [24]. Empirically, a model with 2 Gaussian functions has been highly successful in reproducing the H profiles of Pop. B sources [39, 36, 69]. The broadest Gaussian has been aptly named “very broad component,” with FWHM km s-1. The diagrams in Fig. 3 indicate that Oi8446 emission is possible for the ionization parameter associated to the emitting gas of the VBC, [33], where Caii emission should be negligible. The implication is that Oi8446 and Caii should show different profiles, especially in Pop. B sources. The Oi8446 + Caii blend in Pop. B sources indeed shows a striking similarity to the H profile, and we have considered a very broad component along with a broad component in the fit of Fig. 2.
6 Conclusion
The aim of this paper was not to conduct an extensive review on the formation of the LILs in the spectra of quasars, but rather to gather together pieces and lines of evidence under the framework of the 4DE1 with the hope of gaining additional constraints on the origin of the LILs. We can tentatively conclude that both Caii and Feii are mainly emitted in the same dense region at low ionization [40, 4] since the values we derive from Caii are consistent with the ones of the best model for Feii obtained, for example, by Brühweiler & Verner [4]. This dense low ionization region appears to be present in both Pop. B and Pop. A sources. In extreme Pop. A sources [13, 42] it may be the only region left contributing to LIL emission, while for Pop. B and some (most?) Pop. A sources there is probably a wide gradient in density and physical properties. Nonetheless, if our results are correct, the difference in prominence of Feii emission may be associated more to the relative contribution of this dense region to the total line flux rather than to a continuous change in physical properties from Pop. A to Pop. B [33].
Conventional photoionization models can account for if iron abundance is solar; the upper limit is increased to if abundances are 5–10 times super solar. Sources that are strong Feii emitters have and are relatively rare, 10 % in well-defined flux-limited samples [69, 35]. Most of them have 1 ; only 2% of all sources have [34]. Therefore, one can say that photoionization models come very close to accounting for Feii emission even for relatively rare strong Feii emitters. Nonetheless, it seems important that LIL emission in these extreme Pop. A sources is further investigated. They are the sources with the strongest evidence of a wind [32, 28, 33]; shocks cannot be excluded as an excitation/ionization mechanism. Extreme Pop. A sources show very similar spectra in terms of diagnostic line ratios and profile shapes [13, 42]. Similar structure and dynamics are probably at the origin of the spectral similarity, and it is at least conceivable that a strong wind transfers mechanical energy to the outer regions of the accretion disk, at the same time shielding them from the central ionizing source [27, 28].
References
- Antonucci [2013] Antonucci, R. 2013, Nature, 495, 165
- Barth et al. [2013] Barth, A. J., et al. 2013, ApJ, 769, 128
- Boroson & Green [1992] Boroson, T. A., & Green, R. F. 1992, ApJS, 80, 109
- Brühweiler & Verner [2008] Brühweiler, F., & Verner, E. 2008, ApJ, 675, 83
- Collin & Joly [2000] Collin, S., & Joly, M. 2000, NAR, 44, 531
- Collin-Souffrin [1987] Collin-Souffrin, S. 1987, AAp, 179, 60
- Collin-Souffrin et al. [1988] Collin-Souffrin, S., Dyson, J. E., McDowell, J. C., & Perry, J. J. 1988, MNRAS, 232, 539
- Collin-Souffrin et al. [1980] Collin-Souffrin, S., Joly, M., Dumont, S., & Heidmann, N. 1980, AAp, 83, 190
- Collin-Souffrin et al. [1986] Collin-Souffrin, S., Joly, M., Pequignot, D., & Dumont, S. 1986, AAp, 166, 27
- Davidson [1972] Davidson, K. 1972, ApJ, 171, 213
- Davidson & Netzer [1979] Davidson, K., & Netzer, H. 1979, Reviews of Modern Physics, 51, 715
- D’Onofrio et al. [2012] D’Onofrio, M., Marziani, P., & Sulentic, J. W., eds. 2012, Astrophysics and Space Science Library, Vol. 386, Fifty Years of Quasars From Early Observations and Ideas to Future Research (Springer Verlag, Berlin-Heidelberg)
- Dultzin et al. [2011] Dultzin, D., Martinez, M. L., Marziani, P., Sulentic, J. W., & Negrete, A. 2011, in Proceedings of the conference ”Narrow-Line Seyfert 1 Galaxies and their place in the Universe”. April 4-6, 2011. Milano, Italy., ed. L. F. et al. (Eds.), Proceedings of Science
- Dultzin-Hacyan et al. [1999] Dultzin-Hacyan, D., Taniguchi, Y., & Uranga, L. 1999, in Astronomical Society of the Pacific Conference Series, Vol. 175, Structure and Kinematics of Quasar Broad Line Regions, ed. C. M. Gaskell, W. N. Brandt, M. Dietrich, D. Dultzin-Hacyan, & M. Eracleous, 303
- Dumont et al. [1998] Dumont, A.-M., Collin-Souffrin, S., & Nazarova, L. 1998, AAp, 331, 11
- Ferland & Persson [1989] Ferland, G. J., & Persson, S. E. 1989, ApJ, 347, 656
- Ferland et al. [2013] Ferland, G. J., et al. 2013, RevMexA&Ap, 49, 137
- Garcia-Rissmann et al. [2012] Garcia-Rissmann, A., Rodríguez-Ardila, A., Sigut, T. A. A., & Pradhan, A. K. 2012, ApJ, 751, 7
- Gaskell [1982] Gaskell, C. M. 1982, ApJ, 263, 79
- Grandi [1980] Grandi, S. A. 1980, ApJ, 238, 10
- Joly [1987] Joly, M. 1987, AAp, 184, 33
- Joly [1989] —. 1989, AAp, 208, 47
- Joly et al. [2008] Joly, M., Véron-Cetty, M., & Véron, P. 2008, in Revista Mexicana de Astronomia y Astrofisica Conference Series, Vol. 32, Revista Mexicana de Astronomia y Astrofisica Conference Series, 59–61
- Korista & Goad [2004] Korista, K. T., & Goad, M. R. 2004, ApJ, 606, 749
- Landt et al. [2008] Landt, H., Bentz, M. C., Ward, M. J., Elvis, M., Peterson, B. M., Korista, K. T., & Karovska, M. 2008, ApJS, 174, 282
- Landt et al. [2011] Landt, H., Elvis, M., Ward, M. J., Bentz, M. C., Korista, K. T., & Karovska, M. 2011, MNRAS, 414, 218
- Leighly [2004] Leighly, K. M. 2004, ApJ, 611, 125
- Leighly & Moore [2004] Leighly, K. M., & Moore, J. R. 2004, ApJ, 611, 107
- Marziani et al. [2006] Marziani, P., Dultzin-Hacyan, D., & Sulentic, J. W. 2006, Accretion onto Supermassive Black Holes in Quasars: Learning from Optical/UV Observations (New Developments in Black Hole Research), 123
- Marziani & Sulentic [2012] Marziani, P., & Sulentic, J. W. 2012, The Astronomical Review, 7, 040000
- Marziani et al. [2008] Marziani, P., Sulentic, J. W., & Dultzin, D. 2008, in Revista Mexicana de Astronomia y Astrofisica Conference Series, Vol. 32, Revista Mexicana de Astronomia y Astrofisica Conference Series, 69–73
- Marziani et al. [1996] Marziani, P., Sulentic, J. W., Dultzin-Hacyan, D., Calvani, M., & Moles, M. 1996, ApJS, 104, 37
- Marziani et al. [2010] Marziani, P., Sulentic, J. W., Negrete, C. A., Dultzin, D., Zamfir, S., & Bachev, R. 2010, MNRAS, 409, 1033
- Marziani et al. [2013a] Marziani, P., Sulentic, J. W., Plauchu-Frayn, I., & del Olmo, A. 2013a, ArXiv e-prints
- Marziani et al. [2013b] —. 2013b, ApJ, 764
- Marziani et al. [2009] Marziani, P., Sulentic, J. W., Stirpe, G. M., Zamfir, S., & Calvani, M. 2009, A&Ap, 495, 83
- Marziani et al. [2003a] Marziani, P., Sulentic, J. W., Zamanov, R., Calvani, M., Dultzin-Hacyan, D., Bachev, R., & Zwitter, T. 2003a, ApJS, 145, 199
- Marziani et al. [2001] Marziani, P., Sulentic, J. W., Zwitter, T., Dultzin-Hacyan, D., & Calvani, M. 2001, ApJ, 558, 553
- Marziani et al. [2003b] Marziani, P., Zamanov, R. K., Sulentic, J. W., & Calvani, M. 2003b, MNRAS, 345, 1133
- Matsuoka et al. [2008] Matsuoka, Y., Kawara, K., & Oyabu, S. 2008, ApJ, 673, 62
- Matsuoka et al. [2007] Matsuoka, Y., Oyabu, S., Tsuzuki, Y., & Kawara, K. 2007, ApJ, 663, 781
- Negrete et al. [2012] Negrete, A., Dultzin, D., Marziani, P., & Sulentic, J. 2012, ApJ, 757, 62
- Netzer & Marziani [2010] Netzer, H., & Marziani, P. 2010, ApJ, 724, 318
- Netzer & Penston [1976] Netzer, H., & Penston, M. V. 1976, MNRAS, 174, 319
- Netzer & Wills [1983] Netzer, H., & Wills, B. J. 1983, ApJ, 275, 445
- Persson [1988] Persson, S. E. 1988, ApJ, 330, 751
- Peterson et al. [1982] Peterson, B. M., Foltz, C. B., Byard, P. L., & Wagner, R. M. 1982, ApJS, 49, 469
- Phillips [1978] Phillips, M. M. 1978, ApJ, 226, 736
- Richards et al. [2006] Richards, G. T., et al. 2006, ApJS, 166, 470
- Rodríguez-Ardila et al. [2002a] Rodríguez-Ardila, A., Viegas, S. M., Pastoriza, M. G., & Prato, L. 2002a, ApJ, 565, 140
- Rodríguez-Ardila et al. [2002b] Rodríguez-Ardila, A., Viegas, S. M., Pastoriza, M. G., Prato, L., & Donzelli, C. J. 2002b, ApJ, 572, 94
- Shuder [1981] Shuder, J. M. 1981, ApJ, 244, 12
- Sigut & Pradhan [1998] Sigut, T. A. A., & Pradhan, A. K. 1998, ApJL, 499, L139
- Sigut & Pradhan [2003] —. 2003, ApJS, 145, 15
- Sulentic et al. [2011] Sulentic, J., Marziani, P., & Zamfir, S. 2011, Baltic Astronomy, 20, 427
- Sulentic et al. [2007] Sulentic, J. W., Bachev, R., Marziani, P., Negrete, C. A., & Dultzin, D. 2007, ApJ, 666, 757
- Sulentic et al. [2001] Sulentic, J. W., Marziani, P., & Calvani, M. 2001, X-ray Astronomy: Stellar Endpoints, AGN, and the Diffuse X-ray Background, 599, 963
- Sulentic et al. [2000a] Sulentic, J. W., Marziani, P., & Dultzin-Hacyan, D. 2000a, ARA&A, 38, 521
- Sulentic et al. [2012] Sulentic, J. W., Marziani, P., & M., D. 2012, Astrophysics and Space Science Library, Vol. 386, Fifty Years of Quasars, ed. M. D’Onofrio, P. Marziani, & J. W. Sulentic (Springer Verlag, Berlin-Heidelberg)
- Sulentic et al. [2000b] Sulentic, J. W., Marziani, P., Zwitter, T., Dultzin-Hacyan, D., & Calvani, M. 2000b, ApJL, 545, L15
- Sulentic et al. [2006] Sulentic, J. W., Repetto, P., Stirpe, G. M., Marziani, P., Dultzin-Hacyan, D., & Calvani, M. 2006, A&Ap, 456, 929
- Sulentic et al. [2004] Sulentic, J. W., Stirpe, G. M., Marziani, P., Zamanov, R., Calvani, M., & Braito, V. 2004, A&Ap, 423, 121
- Sulentic et al. [2003] Sulentic, J. W., Zamfir, S., Marziani, P., Bachev, R., Calvani, M., & Dultzin-Hacyan, D. 2003, ApJL, 597, L17
- Vanden Berk et al. [2001] Vanden Berk, D. E., et al. 2001, AJ, 122, 549
- Verner et al. [1999] Verner, E. M., Verner, D. A., Korista, K. T., Ferguson, J. W., Hamann, F., & Ferland, G. J. 1999, ApJS, 120, 101
- Wills et al. [1985] Wills, B. J., Netzer, H., & Wills, D. 1985, ApJ, 288, 94
- Zamanov & Marziani [2002] Zamanov, R., & Marziani, P. 2002, ApJ, 571, L77
- Zamfir et al. [2008] Zamfir, S., Sulentic, J. W., & Marziani, P. 2008, MNRAS, 387, 856
- Zamfir et al. [2010] Zamfir, S., Sulentic, J. W., Marziani, P., & Dultzin, D. 2010, MNRAS, 403, 1759