PHENIX Collaboration
Heavy-flavor electron-muon correlations in and +Au collisions
at = 200 GeV
Abstract
We report pair yield from charm decay measured between midrapidity electrons ( and GeV/) and forward rapidity muons ( and GeV/) as a function of in both and in +Au collisions at GeV. Comparing the results with several different models, we find the results are consistent with a total charm cross section 538 46 (stat) 197 (data syst) 174 (model syst) b. These generators also indicate that the back-to-back peak at is dominantly from the leading order contributions (gluon fusion), while higher order processes (flavor excitation and gluon splitting) contribute to the yield at all . We observe a suppression in the pair yield per collision in +Au. We find the pair yield suppression factor for rad is = 0.433 0.087 (stat) 0.135 (syst), indicating cold nuclear matter modification of pairs.
I Introduction
The study of open heavy flavor production in relativistic collisions is sensitive to different kinds of strong interaction physics. Because the leading order (LO) production mechanism is gluon fusion Brambilla et al. (2011), open heavy flavor production rates are directly related to modification of the gluon parton distribution function (PDF), i.e. shadowing or saturation Gelis et al. (2010). Also, the initial and/or final state partons can scatter and lose energy in the cold nuclear medium Wang and Guo (2001); Frankfurt and Strikman (2007); Vitev (2007), thereby modifying and producing a nuclear modification of open heavy flavor production. Recently, the possibility of flow even in small collision systems such as has raised the question of modified charm momentum distributions Sickles .
Modification to heavy quark production rates and kinematics in +Au collisions at the Relativistic Heavy Ion Collider (RHIC) is well established. Electron production from open heavy flavor decay is enhanced Adare et al. (2012), while production is suppressed Adare et al. (2013) at midrapidity. At positive rapidity, defined with the positive axis as the direction of the deuteron, there is a suppression of heavy-flavor decay muons Adare et al. (a) and a larger suppression of Adare et al. (2013).
While – correlations from open heavy flavor decays have not been published at RHIC to date, correlations involving light flavor hadrons have shown modification in +Au collisions at RHIC. A suppression has been observed of positive rapidity mesons associated with midrapidity trigger hadrons, especially in the back-to-back peak at , indicating scatterings Adare et al. (2011a). This suppression increases as , the fraction of the nucleon momentum carried by the gluon, decreases. These results are in quantitative agreement with energy loss models Kang et al. (2012) and saturation models Stasto et al. (2012); Jalilian-Marian and Rezaeian (2012); Lappi and Mantysaari (2013).
This paper presents measurements of azimuthal correlations of electron-muon pairs produced from heavy flavor decays, primarily , in and +Au collisions using the PHENIX detector at RHIC. The heavy-flavor – correlations are free of backgrounds from other sources that contribute to other dilepton analyses ( or ), such as resonance decay and Drell-Yan. While analysis of dilepton mass and provides a way to separate charm and bottom contributions, the azimuthal correlations have an important advantage for studying the charm production process. The leading order production, and , will produce back-to-back open heavy flavor pairs that can semileptonically decay and produce azimuthally correlated – pairs. Next-to-leading order (NLO) processes like flavor excitation and gluon splitting produce much less correlated and thus much less correlated – pairs. Therefore, modification to different portions of the azimuthal correlations can be attributed to modifications of pairs from different production mechanisms. In energy loss models such as Ref. Kang et al. (2012), a broadening of the back-to-back azimuthal correlation should accompany a suppression of the peak due to the multiple scattering that the incoming gluons and/or the outgoing undergo in the cold nuclear medium.
This paper is organized as follows. The PHENIX detector is outlined in Section II. Section III describes the details of the method used to measure the correlations, the background subtraction method, and the tests of the method. Section IV presents the results in and compares them to Monte Carlo models. The +Au results are presented and compared to the results in Section IV.2. Conclusions are given in Section V.
II PHENIX Experiment
The PHENIX detector at RHIC is multi-purposed and optimized for precision measurements of electromagnetic probes for relativistic hadronic and heavy ion collisions. A complete overview of the detector can be found in Ref. Adcox et al. (2003). The data presented here are from 2006 and 2008 +Au data taking at RHIC. Figure 1 shows a schematic of the detector during those years. This analysis uses the central spectrometer arms for electron detection and the forward rapidity muon spectrometer arms, labeled North and South in Fig. 1, for muon identification. For the 2008 +Au collisions, the deuteron beam moves toward the North arm, which defines positive rapidity for both and +Au. The forward produced muons come from a high- parton in the deuteron interacting with a low- parton in the gold. pythiaSjostrand et al. indicates that the average of a parton producing a heavy flavor muon from 1 GeV/ in the forward muon spectrometer is about . This analysis focuses only on the muons measured in the North arm utilizing the deuteron beam as a probe of low- partons in the gold nucleus.
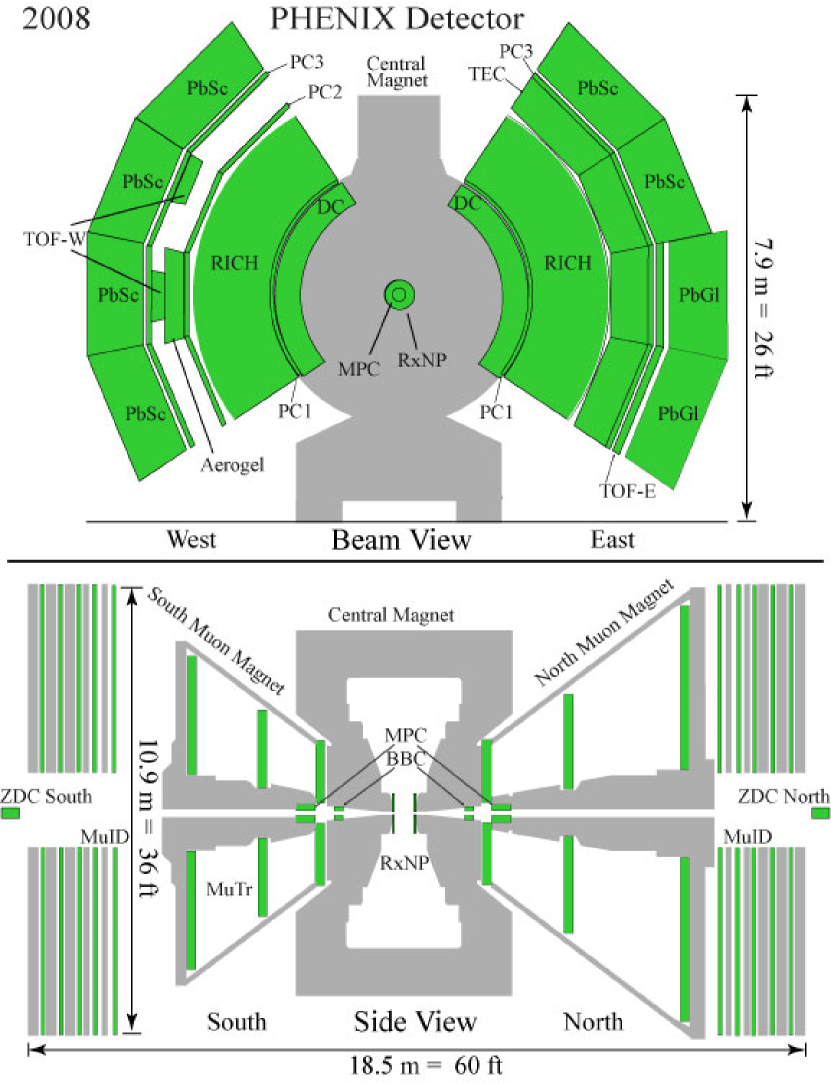
The central spectrometer comprises two arms subtending in azimuth and covering . Charged tracks are measured using a drift chamber (DC) and a set of multi-wire proportional chambers with pad readout (PC1 and PC3). The DC measures the bend angle in the plane due to a central magnetic field directed along the beam axis. PC1 is used to measure the longitudinal coordinate of the track. These tracks are then projected into PC3, where a hit is required to ensure high track quality. The momentum resolution of the tracks in this data is %1.16%, where is the total momentum measured in GeV/. Electrons can be identified from associated hits in the Ring Imaging Čerenkov (RICH) detector and the Electromagnetic Calorimeters (EMCal). Electrons above 17 MeV/ passing through the CO2-filled RICH will emit Čerenkov radiation. The EMCal comprises eight sectors, six of lead-scintillator and two of lead-glass, used to collect the energy from electron and photon showers. The nominal energy resolution for the lead-scintillator and lead-glass is 8.1%2.1% and 6.0%0.9%Aphecetche et al. (2003), respectively.
The North muon spectrometer is located at and covers 2 in azimuth. The spectrometer measures tracks in the muon tracker (MuTr) and the muon identifier (MuID). Prior to entering the muon arm, particles pass through approximately 20 cm of copper and 60 cm of iron. Particles that are not absorbed pass through the MuTr, which comprise three stations of cathode strip chambers with multiple ionization regions and located inside a radial magnetic field. After the MuTr, particles pass through the MuID, which comprises five alternating steel absorbers and MuID detector planes, called gaps, with Iarocci tubes. MuID roads reconstructed from MuID hits are projected back to MuTr tracks and to the measured vertex to provide the complete information for a track through the spectrometer.
Trigger and global event characterization in and +Au are provided by the beam-beam counter (BBC). The BBC is a set of 64 hexagonal Čerenkov counters located from and covering full azimuth. The vertex of the collision along the beam line () is determined by the time difference between the BBCs on either side of the collision region. The minimum bias (MB) trigger requires that there is at least one hit in each of the BBCs. From Vernier scans and verified by Monte Carlo studies, the BBC MB trigger is sensitive to 555% of the inelastic cross section and 884% of the +Au inelastic cross sectionAdare et al. (b). The trigger used for this analysis is a combination of the BBC trigger and a deep muon trigger. The deep muon trigger requires three or more MuID gaps with a signal in both the and direction tubes and that the last pair of hits be in the last (5th gap) or next to last gap (4th gap).
After quality cuts and requiring a vertex within 25 cm of the =0 vertex, an integrated luminosity of 2.1 pb-1 in and a -equivalent of 7.7 pb-1 in +Au was sampled.
III Analysis
The primary goal of this analysis is to identify
| (1) |
where the opposite sign electron-muon pair is from the pair decay.
III.1 Particle Identification
III.1.1 Muon Identification
Only muon candidates with GeV/ are used in the analysis because real muons with total momentum less than about 2.7 GeV/ are stopped in the muon arm before reaching the 5th (and last) gap. Single muon candidates are constructed from MuID roads projected and matched to MuTr tracks. Cuts on MuID roads and MuTr tracks are designed to reject hadrons that mimic a muon signal and to reject tracks that did not originate from the collision vertex. For the MuID roads, at least three of five gaps with hit information are required, including a pair of hits in the 5th gap. These MuID roads must project back near the nominal vertex position. Those muons that do not typically come from beam-related backgrounds. For the MuTr tracks, cuts that reject hadrons are detailed in Ref. Adler et al. (2007). The MuID roads are then projected and matched to MuTr tracks at the 1st MuID gap. An identified muon candidate is the closest MuTr track that matches a MuID road within at least 10∘ in slope and 10 cm in distance. Muon candidates are further restricted to . During both the and +Au data taking periods, there were backgrounds primarily from beam-related particles interacting with material in the accelerator upstream of PHENIX. Collimators were used in the accelerator to reduce this background but it was not totally eliminated. Restricting the range of the muon candidates helped minimize this background.
III.1.2 Electron Identification
Electrons with GeV/ are identified by matching a track in DC, PC1, and PC3 to a signal in the RICH and a cluster in the EMCal. The relevant details on measuring electrons in PHENIX are given in Ref. Adare et al. (2011b). For this analysis, the projected track must match within 3 in position to a cluster in the EMCal. Clusters are also required to have a matching profile, when compared to an electromagnetic shower shape profile at the measured energy. Once a track matches both the RICH and the EMCal, an cut is applied, where it is required that the energy measured in the the EMCal be approximately equal to the reconstructed track momentum . This is sufficient to remove most combinatorial matches and background from real electrons resulting from long-lived particle decays occurring near the DC, which have mismeasured momentum. A cut of -2 to +3 from the mean in the data and -1.5 to +3 from the mean in the +Au data is applied. The asymmetry of the cuts is due to the dominance of backgrounds below 2 or 1.5 of the mean. The tighter cut in the +Au data was necessary because of the increased background from the hadron blind detector (HBD) support material not present during 2006 data taking.
III.2 Acceptance and Efficiencies
After particle identification cuts have been applied to an event, all pairs of identified electrons and muons are formed in each of the four charge-sign combinations. The fully corrected invariant-pair yield, calculated for each sign combination, is Adler et al. (2006)
| (2) |
where is the number of sampled BBC triggered events, is the MB trigger bias accounting for events missed by the BBC triggerAdare et al. (b), and are the rapidity ranges of the electrons and muons, respectively, is the inclusive electron-muon pair yield, and is the mixed-event electron-muon pair distribution. The two-particle acceptance and efficiency is corrected by the mixed-event technique, where electrons from one event are paired with muons from a different event. Pools of inclusive electrons and muons are kept in bins 2.5 cm-wide vertex bins, and, in the case of +Au, 10%-wide centrality bins. When mixing events, the pair distribution is weighted by the - and -averaged efficiency of each particle, and .
Both and were determined by generating single electrons and single muons with a flat distribution in , , or and collisions -vertex location and running them through a geant-3 simulation of the PHENIX detector. The output was subjected to the same analysis cuts applied to the data. The efficiency is defined as the ratio of particles reconstructed through the analysis to the number simulated. These simulations demonstrated that and are independent of the -position of the event vertex, is independent of and has a slight -dependence. Pair yields are reported with the average pseudorapidity , which include the -dependence of both single inclusive muons and the single particle efficiency.
III.3 Background Subtraction
Inclusive muon and electron candidates come from both heavy- and light-flavor decays and from misidentified hadrons. The fully-corrected inclusive electron-muon pair yield for each sign combinations can be written as
| (3) |
Here indicates the fully-corrected inclusive pair yield defined in Eq. III.2; is the fully-corrected pair yield produced from a heavy flavor pair decay; is the fully-corrected pair yield from correlating a heavy flavor decay product with a light flavor decay product; and is the fully-corrected pair yield from correlating pairs of light-flavor decay products or misidentified hadrons. Pairs from the semileptonic decay of a pair have opposite signs. Eq. 3 can be decomposed into its like- and unlike-sign pieces:
| (4) | |||||
While semileptonic decays of can also produce both like- and unlike-sign – signals, in this analysis, pythia indicates that only about 1% of the final heavy-flavor – pair yield is from and is neglected. If we assume muon (electron) candidates from light flavors are not charge-correlated with electron (muon) candidates from light flavors, then
| (5) |
If only one of the pair is from heavy flavor, then again, we assume they are not charge correlated, and
| (6) |
Therefore, the heavy flavor – signal distributions is the difference between the unlike-sign and the like-sign inclusive correlations:
| (7) |
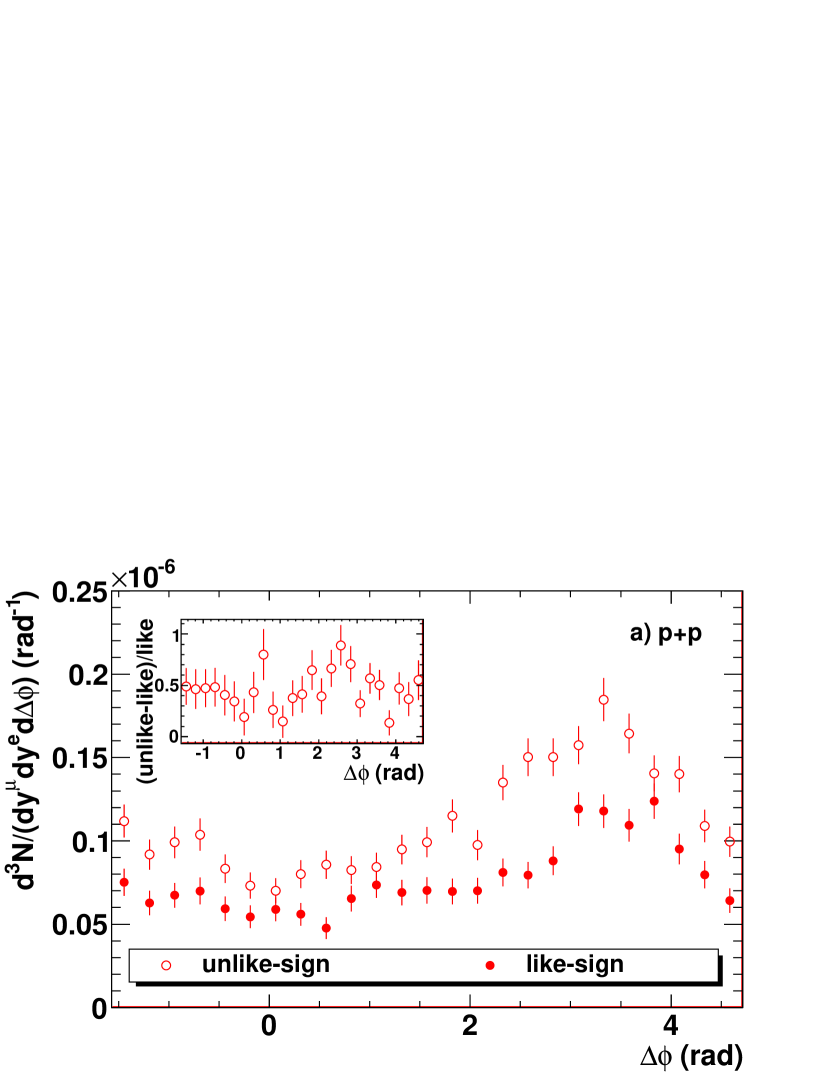
Figure 2 shows the fully-corrected inclusive like-sign () and unlike-sign () – pair distributions in and +Au. The inset figures show the signal-to-background distributions given the assumptions above.
We have checked the like-sign subtraction method using pythia leading order quantum chromodynamics (QCD) events. With all events containing a heavy quark in the final state removed, the pair yields as a function of for like-sign and unlike-sign electron-muon pairs were the same within 3% over all .
While this corroborates the basic idea of the subtraction, the assumption was further tested with data. In the following sections we detail the results of different methods to tag electrons and muons from light flavor decay to examine the validity of Eq. 7 and to quantify the systematic uncertainty of the method. The general method is to use a sample of single electrons paired with single muons, where one or both are likely from light-hadron decays. If the method is correct, the like-sign subtraction should produce no correlation at all. If there are statistically significant correlations after like-sign subtraction, these are subtracted from the final – pair yield and uncertainties on the residual correlation strength are propagated as a systematic uncertainty on the final pair yield. If no statistically significant yield is found after like-sign subtraction, the statistical uncertainty on the zero yield is propagated as the systematic uncertainty.
III.3.1 Correlations between inclusive electrons and punch-through hadrons that fake single muons
One source of background to the single muons is from hadrons that penetrate to the 5th gap, called punch-through hadrons. After single particle cuts there is some small fraction (roughly 1 out of every 250 Hornback (2007)) of candidate tracks with GeV/ that are hadrons that punch through. While this represents an irreducible background to the single muons, we can obtain a clean sample of hadrons that punch through and stop in the 4th gap of the MuID. Fig. 3 shows the distribution of muon candidates that stop in the 4th gap. The peak at 2.3 GeV is composed of muons that have insufficient energy to penetrate further. The broader portion of the distribution comprises light hadrons that are not stopped by the upstream absorber materials but are subsequently absorbed in the steel just after the 4th gap, thus not leaving a hit in the 5th gap. We identify punch-through hadrons as having stopped in the 4th gap with larger than 3 GeV.
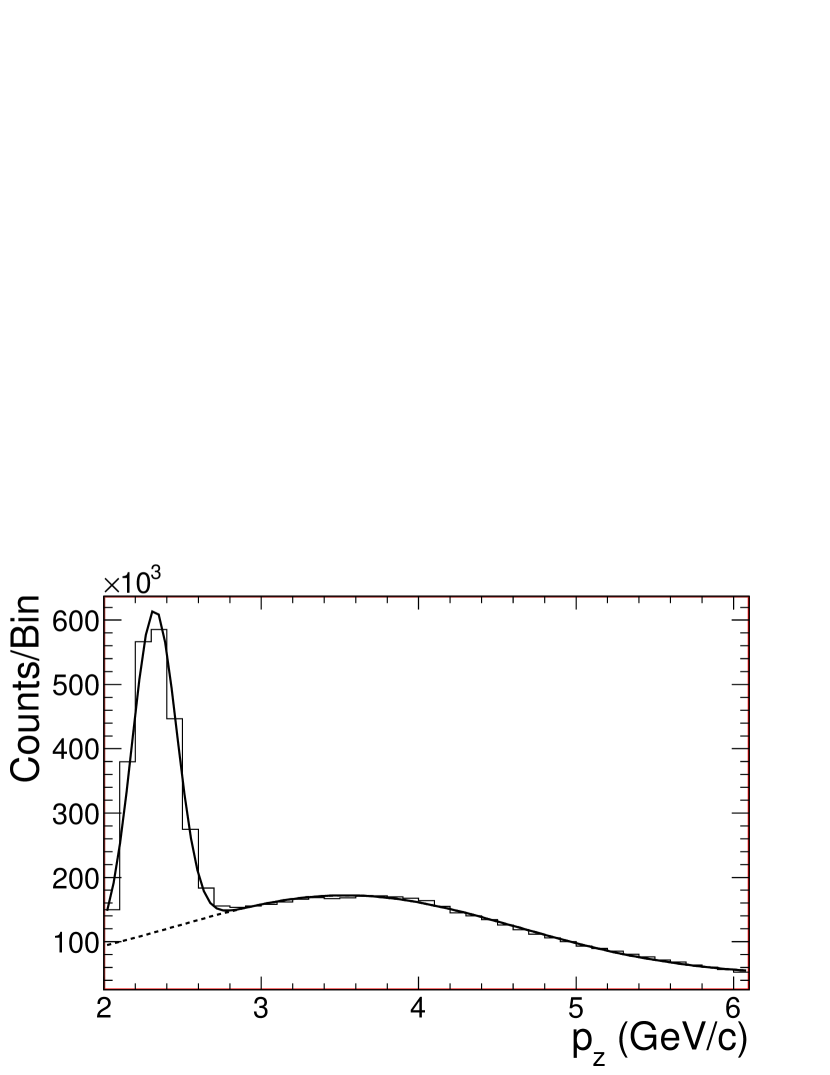
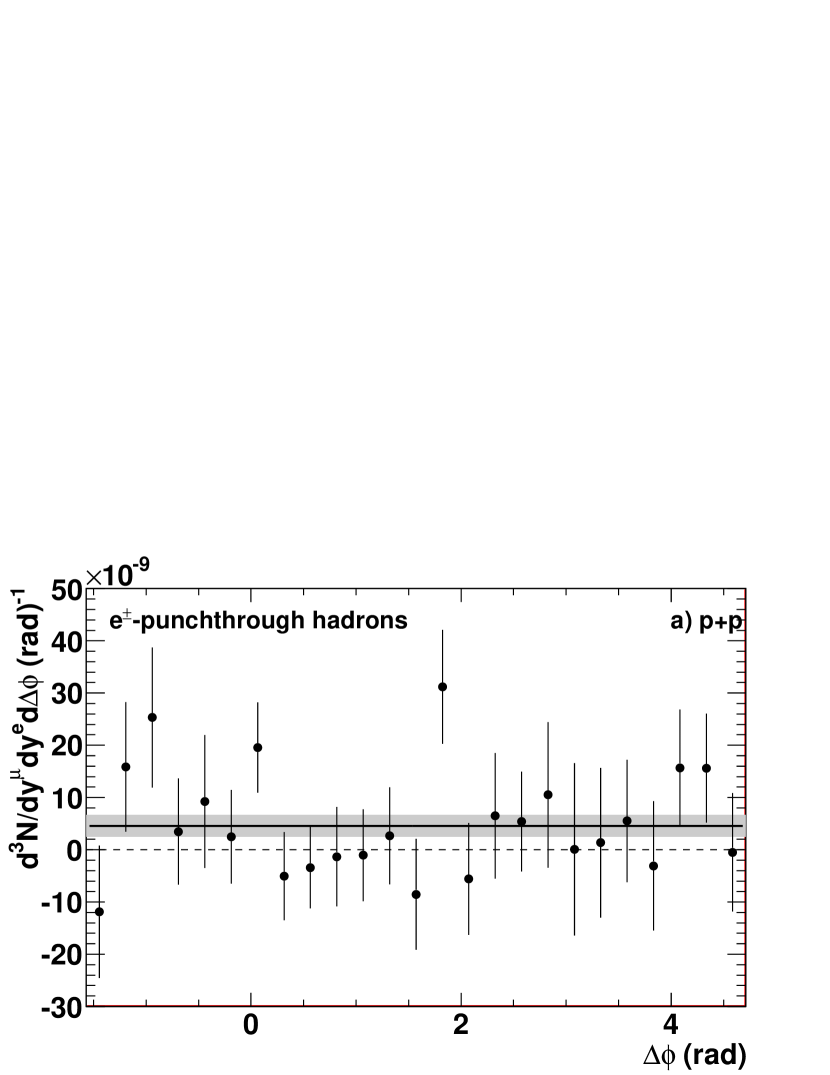
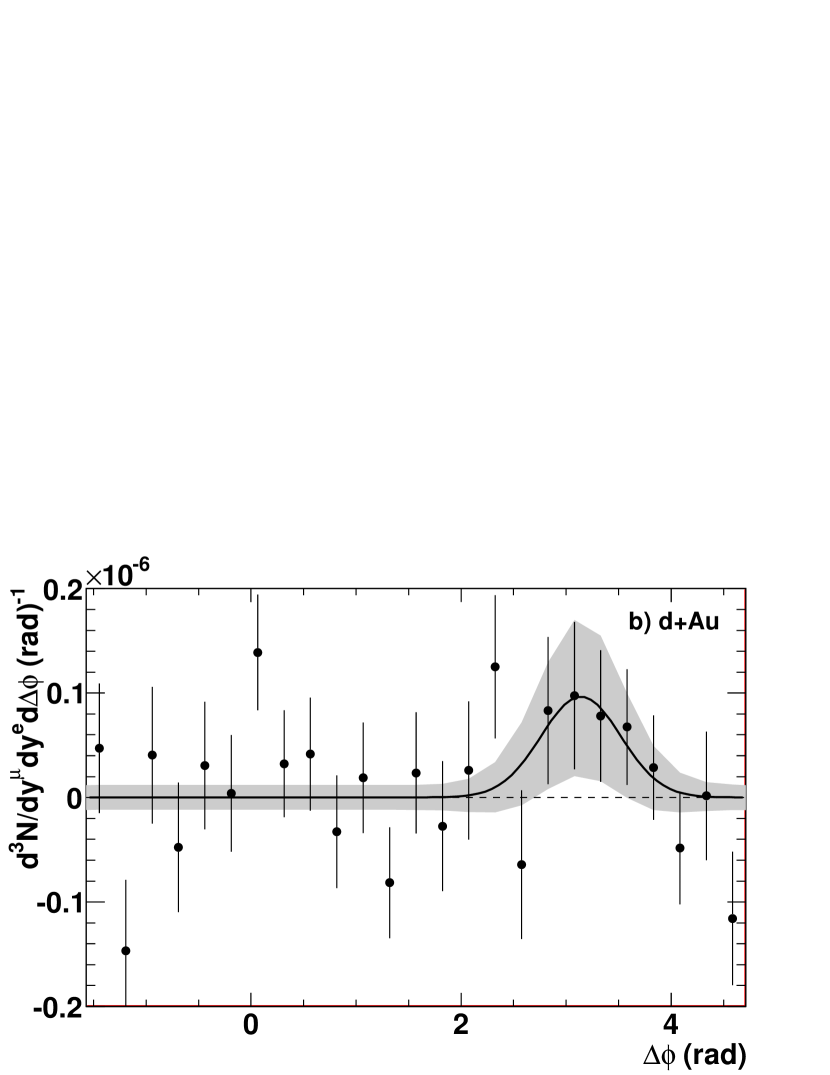
Fig. 4 shows the fully corrected like-sign subtracted pair yield of central-arm electrons and the punch-through hadrons in the muon arms for both and +Au collisions. If both the like- and unlike-sign pair yields were dominantly from light hadron decays, the like-sign subtraction should produce zero pair yield. To determine the magnitude of the residual correlation strength after like-sign subtraction, the data were fitted with a flat line. This is shown as the solid line in Fig. 4a. The fit uncertainty is shown as the shaded band around the solid line. The flat fit in had a /NDF of 22.7/24 and gave a value that was nonzero with greater than 1 significance. This means there is yield in the final – correlations from these punch-through hadrons. The fitted yield was subtracted from the final pair yield and its uncertainty was propagated as a systematic uncertainty on the final pair yield. For the +Au case, we fitted the residual correlation to a flat line and found reasonable agreement with a /NDF of 30.9/24 or a -value of 14%. However, there is a possible excess of counts near , which when included as a Gaussian component fixed at and the width and yield as free parameters, a slightly better /NDF of 26.3/22 or a -value of 26% was found. If there is any correlated yield beyond a pedestal, it would show up in the back-to-back peak. Therefore, we subtract the Gaussian fit, shown as the solid line in Fig. 4 from the final pair yield and propagate the uncertainty, shown as the shaded region around the solid line, on the fit to the systematic uncertainty in the final pair yield.
Two additional corrections to this data are applied before subtraction from the final pair yield. Because the punch-through hadrons are measured in the 4th gap, the yields need to be scaled to match the rate of hadrons at the last gap. The rate of hadrons at the 5th gap was determined by using pion and kaon NLO perturbative QCD spectra Vogelsang and passing them through a geant-3 model of the PHENIX muon arms. The MuID absorber steel cross section was modified until there was agreement between data and the simulation for the rate of punch-through hadrons in the 3rd and 4th gap. We extrapolated to the 5th gap and find the rate of hadrons is 2.810.30 times the rate of punch-through hadrons in the 4th gap Adler et al. (2007). The 3 GeV/ cut removes some fraction of the punch-through hadrons. Based on the two-component fit to the distribution shown in Fig. 3, the yield is scaled up to account for those hadrons rejected by the cut. In the end, the pair yield uncertainty is 2.1710-9 (rad)-1 in . In +Au there is a -independent uncertainty on the final pair yield that is 1.4210-8 (rad)-1 and the Gaussian uncertainty that ranges from 0 to 6.3010-8 (rad)-1.
III.3.2 Correlations Between Inclusive Electrons and Light-Hadron Decay Muons
One source of real muons is from decays of light hadrons, predominantly charged pions and kaons, before the absorber material. The observed rate of muons into the North arm is higher, when the collision vertex is farther from the spectrometer arm. Because heavy flavor decays (including Drell-Yan, heavy quarkonia, etc.) have a much shorter than light flavor decays, heavy flavor decay muons have a much weaker vertex dependence. Therefore, we assume there are two components to the muon rate: a component that follows the primary vertex distribution, attributable to heavy flavor decays, and a component that folds the linear component due to light hadron decays with the primary vertex distribution.
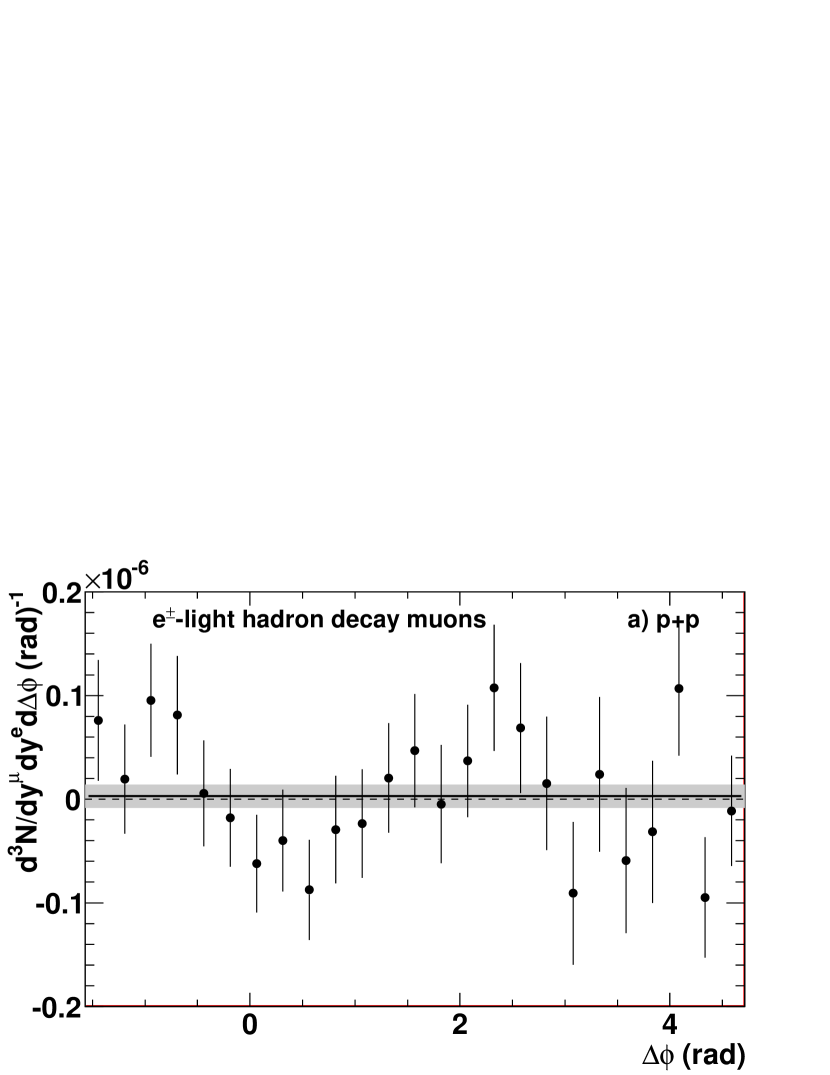
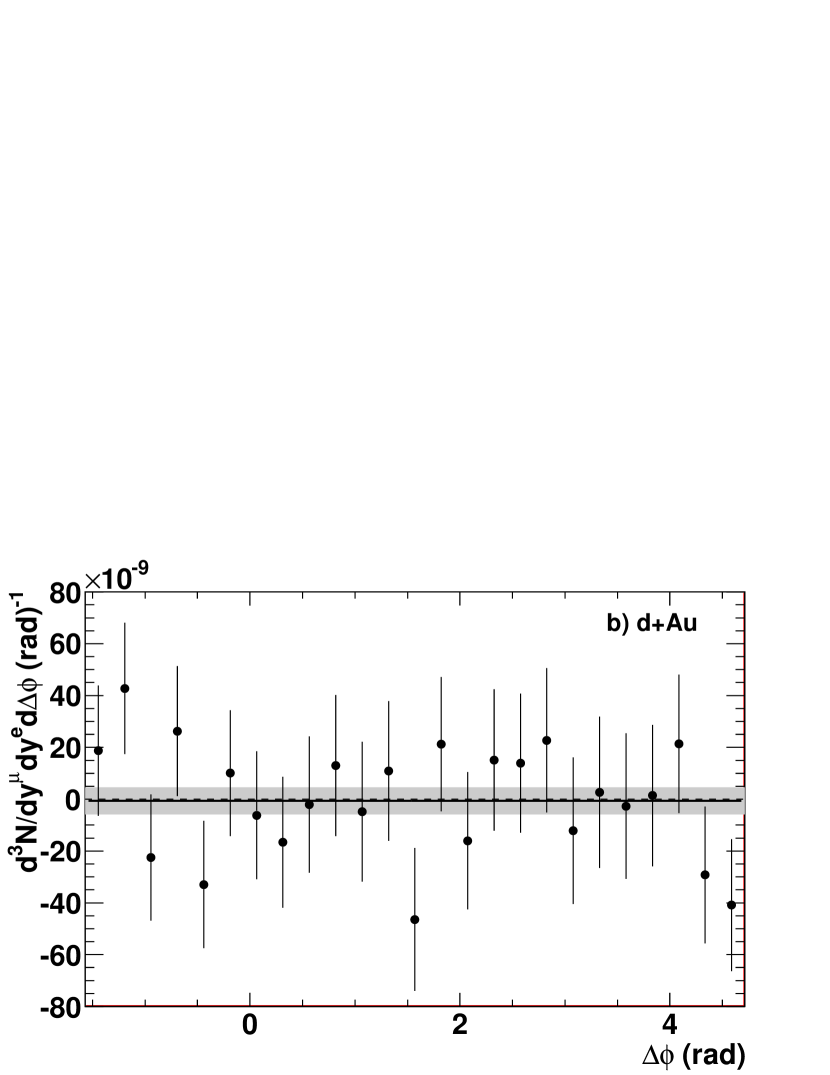
Muons that are near the detector ( cm) and far from the detector ( cm), where is the measured collisions vertex, are separately correlated with central arm electrons. Because the signal heavy flavor muons follow the primary collision vertex distribution, subtracting the near-vertex pair yield from the far-vertex pair yield, should remove these and only residual correlations from decay muons should be present. The pair yields in and +Au after subtracting near- and far-vertex muons and after like-sign subtraction are shown in Fig. 5. The +Au correlations are consistent with a flat line with zero yield with a /NDF of 18.0/24. The data seems to have a residual shape. However, this shape is asymmetric about of zero and is not physical. Therefore, we fit with a flat line that results in zero correlation yield and a /NDF of 27.1/24. The fits are shown in Fig. 5 as solid lines and shaded bands indicating the statistical uncertainties. These uncertainties were propagated into the systematic uncertainties of the final pair yields.
To propagate the uncertainties, additional corrections are needed. First, in the far-near subtraction, some fraction of the decay muons are removed. Second, light hadron decays outside the 30 cm vertex cut are not counted in the subtraction. To account for both effects, a fit to the vertex dependence of the muon yield is extrapolated to a point one interaction length inside the absorber, a distance of about 56 cm from the nominal vertex and about 16 cm into the absorber. It is assumed that the decay contribution to the muons is negligible at that point, which fixes the fraction of muons that are from light decays within the measured vertex window of the analysis. Under this assumption, only 22% of the decay muons are measured within the vertex window after the like-sign subtraction. The fit uncertainties are increased to account for those muons not measured. The final systematic uncertainties on the final pair yield are 1.1310-8 (rad)-1 and 5.0510-8, independent of for and +Au, respectively.
III.3.3 Correlations Between Photonic Electrons and Inclusive Muons
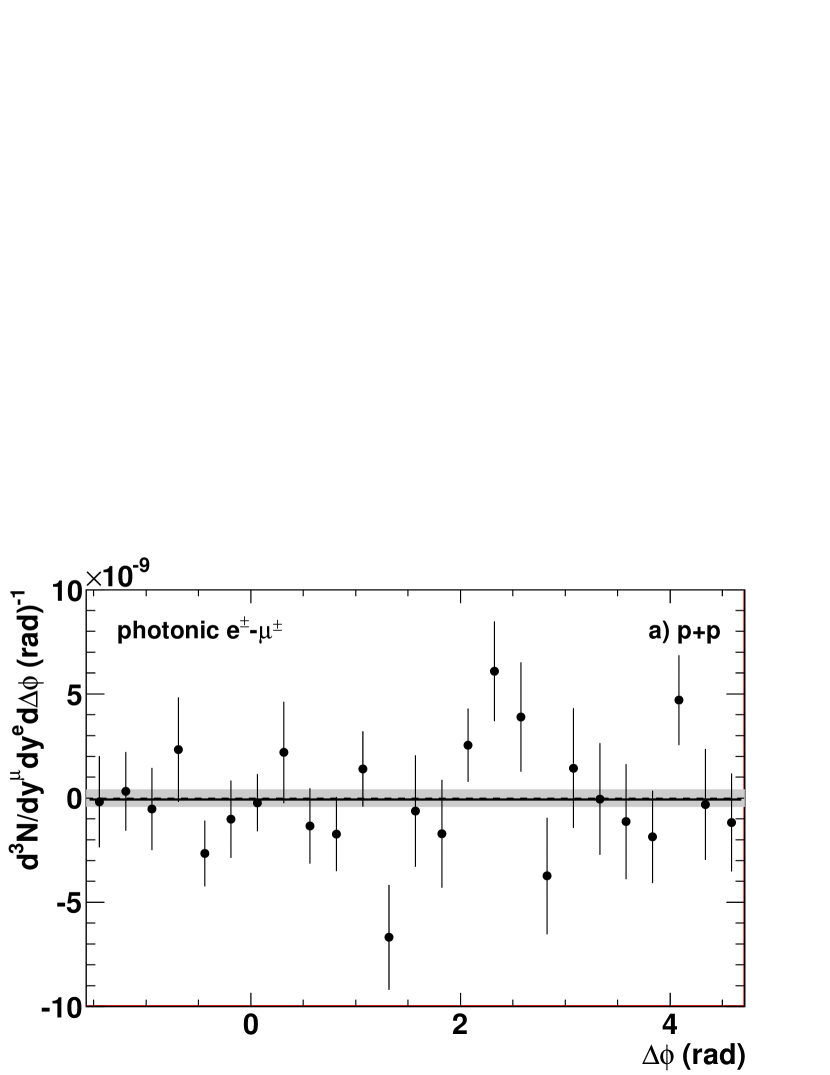
Electrons can result from light hadron decays through internal and external photon conversions. The dominant photonic source of electrons are from decays. We assume that, if we measure the -decay electrons correlations with muons, this will represent the other photonic sources (such as and decay) in shape and yield. To tag decay or converted electrons, we construct the invariant mass distribution of all pairs of electrons and photons in an event. Electrons paired with photons within the mass peak are then correlated with muon candidates. The signal-to-background of pairs in the mass range is about one. To remove correlations from combinatorial electron-photon pairs that fall within the mass window, muon candidates were also correlated with the – pairs in a “sideband” mass region from 0.2–0.4 GeV/. After scaling by the appropriate signal-to-background under the mass region, the “sideband” correlations were subtracted from the in-mass electron-muon correlations for each of the – charge types.
Fig. 6 shows the “sideband”-subtracted and like-sign subtracted correlation between electrons tagged in the mass region with muons from and +Au data. Flat fits to these correlations produced a yield consistent with zero with /NDF of 33.2/24 and 20.2/24 in and +Au data, respectively. The statistical uncertainty from the fitted yield to the -tagged correlations is a factor of 10 smaller than the other background correlations after accounting for reconstruction efficiency and additional sources of photonic electrons. This uncertainty is negligible compared to those from the muon backgrounds.
III.4 Systematic Uncertainties
In this analysis there are three general types of uncertainty that we identify as type A, point-to-point uncorrelated, type B, point-to-point but correlated, and type C, total normalization uncertainty. Except for statistical uncertainties there are no type A uncertainties in this analysis.
The type B uncertainties are from the subtraction of known backgrounds discussed in Section III.3. The fully corrected pair yield uncertainties in are (rad)-1 and (rad)-1 from punch-through hadron and decay hadron subtraction uncertainties, respectively. These values are independent of . In +Au the flat-line fit contributions to the systematic uncertainty are (rad)-1 and (rad)-1 from punch-through hadron and decay hadron subtraction uncertainties, respectively. The additional uncertainty from the Gaussian fit to the punch-through hadron correlations resulted in a -dependent uncertainty ranging in absolute value of 0 at 2 rad to (rad)-1 at . The type-B systematics are summarized in Table 1.
| Type | Description | +Au | |
|---|---|---|---|
| B | dependent | – | 0%—6.3010-8(rad)-1 |
| B | punch-through | (rad)-1 | (rad)-1 |
| B | decay muons | (rad)-1 | (rad)-1 |
| C | muon cuts | 7.8% | 8.3% |
| C | electron cuts | 8.3% | 9.3% |
| C | muon efficiency | 2.2% | 2.2% |
| C | electron efficiency | 1.0% | 1.0% |
| C | trigger efficiency | 11.1% | 4.2% |
| C | total | 16.1% | 13.4% |
The type C uncertainties are attributable to several sources and are given in Table 1. One source of systematic uncertainty is evaluated by tightening the single particle cuts for this analysis. Each single particle cut was tightened independently and the analysis, including reevaluation of the single particle efficiency, was performed. The uncertainty from each of the individual single particle cuts was combined using the correlation amongst the cuts. The values of these are different in and +Au data, because of the higher backgrounds in +Au collisions. However, these uncertainties are highly correlated between and +Au, because the same cuts are applied to both data sets. Another source of uncertainty is in the evaluation of the single particle efficiencies. The single particles were generated flat in and then weighted to match the measured PHENIX heavy flavor lepton spectra Adare et al. (2006). For the uncertainty determination, the single particle efficiency was re-evaluated without the weighting applied. This was estimated to be 1.0% for the electrons and 0.8% for the muons. For muons there is an additional 2.0% uncertainty due to the run-by-run variation in muon acceptance. The final portion of the type C systematic uncertainty is due to the trigger efficiency. To evaluate this uncertainty, the data were analyzed for several data-taking periods defined by the muon trigger performance. The difference in fully-corrected yields between data sets was taken to be the uncertainty in the muon trigger efficiency. This is combined with the uncertainties in the bias factor in Eq. III.2. The total uncertainty for the trigger is 11.1% for and 4.2% for +Au. As indicated in Table 1, combining all Type C uncertainties gives 16.1% for data and 13.4% for +Au data.
IV Results
IV.1 Pair Yields for data and Comparison with Monte Carlo Generators
The fully-corrected like-sign subtracted – pair yield as a function of for electrons with GeV/ and , with opposite-signed forward muons with GeV/ and , in is shown in Fig. 7. The average muon in these correlations is 1.75. The error bars are statistical uncertainties only, while the boxes are the type B systematic uncertainties. We note that the distribution has two components: a nonzero continuum as well as a back-to-back peak near .
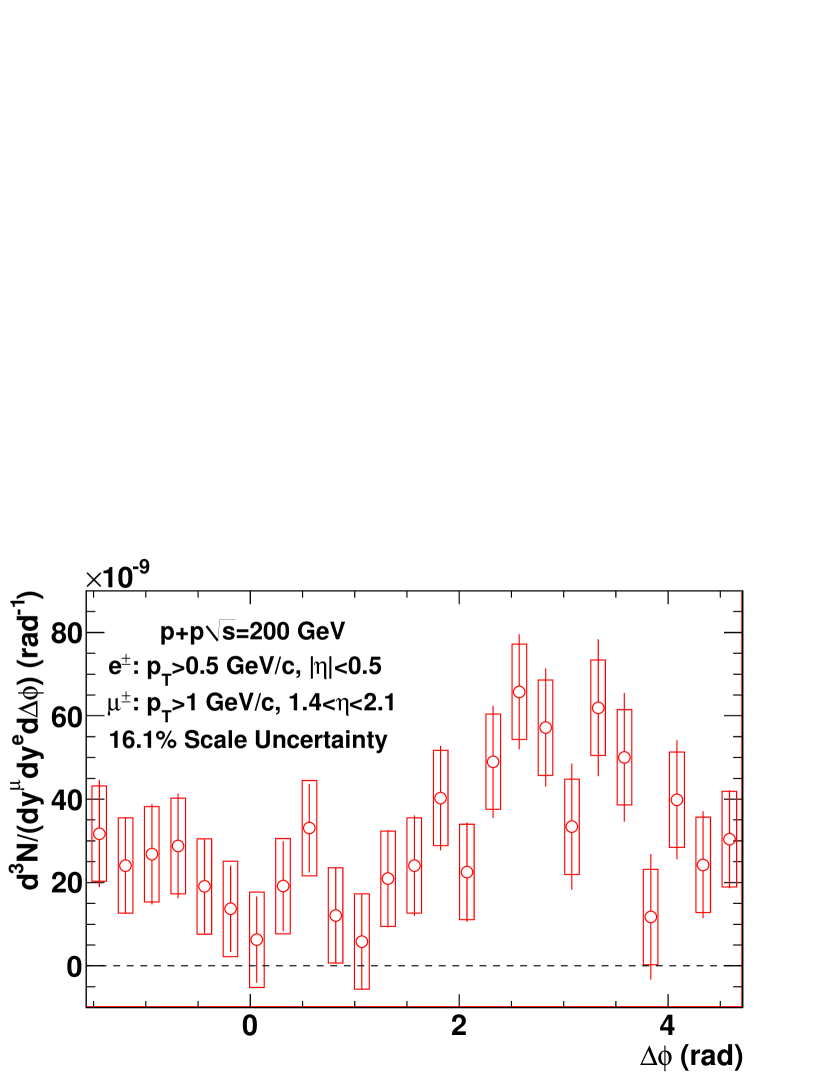
To interpret these data, we compare the results to several different Monte Carlo generators, pythia, powhegFrixione et al. , and MC@NLOFrixione and Webber .
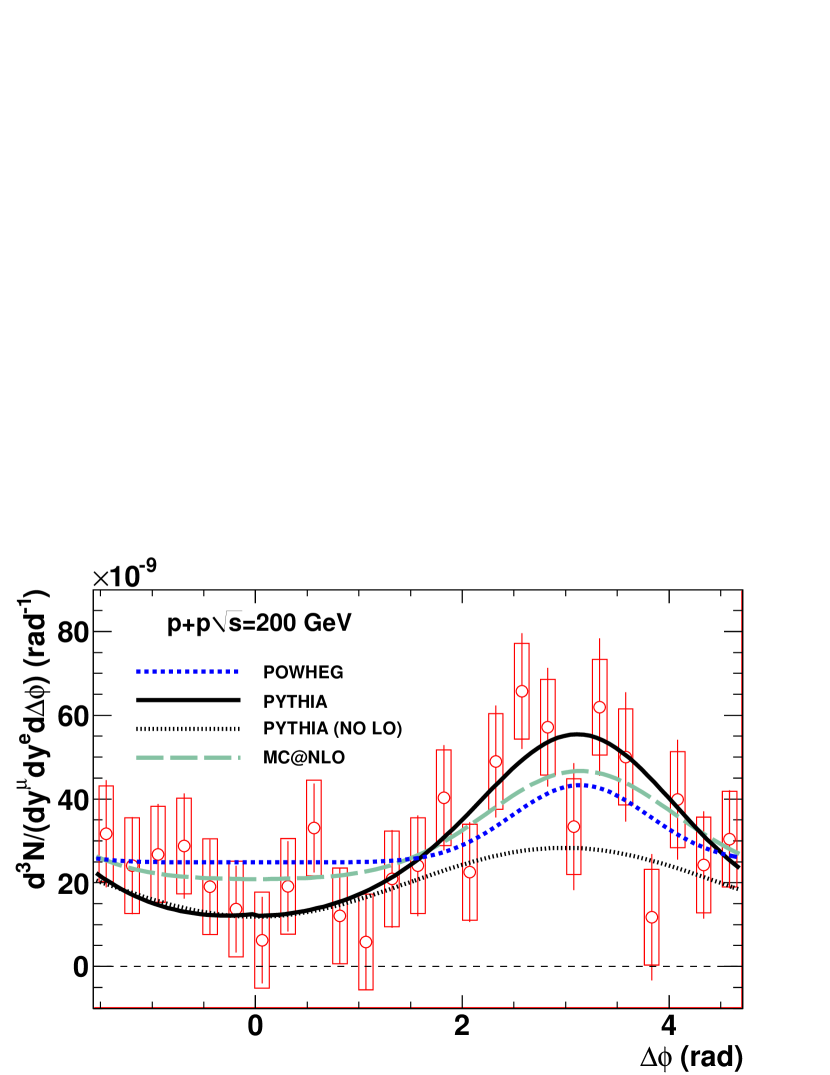
The pythia MB QCD events were generated to model the LO gluon fusion process and also model next-to-leading order processes, like flavor excitation and gluon splitting. Events with a pair and an electron and a muon in the measured kinematic range as the corrected data ( GeV/ and , GeV/ and ) were correlated and a like-sign subtraction was performed. An overall scale factor was used to fit the pythia curve to the data. In the fit, the was calculated for different scale parameters using the statistical error on the data. We report the cross section for the scale factor that minimizes that and report a statistical error on the cross section as the value that changes the by one unit. To evaluate the systematic uncertainty on the cross section, the data were increased and decreased by their combined type B and type C systematic uncertainty and the process to determine the scale factor by finding a minimum using the statistical uncertainty in the data was repeated. We find the pythia correlation is consistent with the data with a cross section of = 34029(stat)116(syst) b with a /NDF of 20.5/24. This is shown as the solid curve in Fig. 8.
The other model comparisons are from NLO generators, powheg and MC@NLO. Events were generated to produce the hard scattering heavy flavor event vertex and then interfaced to pythia, which performed the fragmentation and underlying event generation. The qualitative features of the data are present in these correlations: the continuum and the back-to-back peak. As described for the pythia fit, a single scale parameter was used to calculate a between the generated – correlations and the data using the data’s statistical uncertainty. The resulting best fits for powheg and MC@NLO are shown in Fig. 8 as the short dashed and the long dashed lines, respectively. The extracted cross sections are = 511 44 (stat) 198 (syst) b with /NDF of 23.5/24 for powheg and = 764 64 (stat) 284 (syst) b with /NDF of 19.2/24 for MC@NLO.
We combine the cross sections from the three models and report a measured cross section of 538 46 (stat) 197 (data syst) 174 (model syst). The central value of the cross section is the average of the three model cross sections, while the model systematic uncertainty is the standard deviation of the three model cross sections. This value can be compared with previous PHENIX measurements. From the heavy flavor electron spectra at midrapidity, PHENIX found 567 57 (stat) 224 (syst) Adare et al. (2006) and from the dielectron mass spectrum at midrapidity, PHENIX extracted 554 39(stat) 142 (data syst) 200 (model syst) Adare et al. (2009a). Within the data systematics the value extracted here is consistent with previously published PHENIX results.
| description | (b) | ||
|---|---|---|---|
| pythia – | 34029(stat)116(syst) | ||
| powheg – | 51144(stat)198(syst) | ||
| MC@NLO – | 76464(stat)284(syst) | ||
| Combined – | 53846(stat)197(data syst)174(model syst) | ||
| PHENIX single Adare et al. (2006) | 56757(stat)224(syst) | ||
| PHENIX dilepton () Adare et al. (2009a) | 55439(stat)142(data syst)200(model syst) |
Using the pythia event record, it is possible to separate the production into an LO component, where the and a component from the pythia model of NLO mechanisms of flavor excitation and gluon splitting, where the pair is produced in the initial or final-state shower. The “pythia (NO LO)” dashed line in Fig. 8 shows the correlations from the sample of produced pythia events, where the were not generated in the primary event vertex of pythia. The back-to-back peak at is dominated by the LO gluon fusion process while the continuum is due to the correlations from the higher order processes. From an accounting from pythia, we find that 32% of the – pair yield results from gluon fusion, consistent with the expectations from charm production Brambilla et al. (2011).
Throughout the analysis it has been assumed that semileptonic decay is the dominant contribution to the correlations. However, semileptonic decays would produce a signal in both the like- and the unlike-sign pair distributions. Up to four semileptonic decays can occur where -quarks semileptonically decay to -quarks, which subsequently semileptonically decay. We have used pythia and powheg to check these contribution from bottom. In both cases, for electrons and muons in the kinematic region that we measure, the bottom contribution is about a factor of 100 below the charm yield. This is further corroborated by the PHENIX heavy flavor electron measurements that show that bottom becomes significant only at above 3 GeV/ Adare et al. (2009b). In this analysis only 3% of the sampled electrons have a above 3 GeV/, so we expect that the bottom contribution is negligible in this measurement especially compared to the background subtraction systematic uncertainties.
IV.2 Yields in + and Comparison to
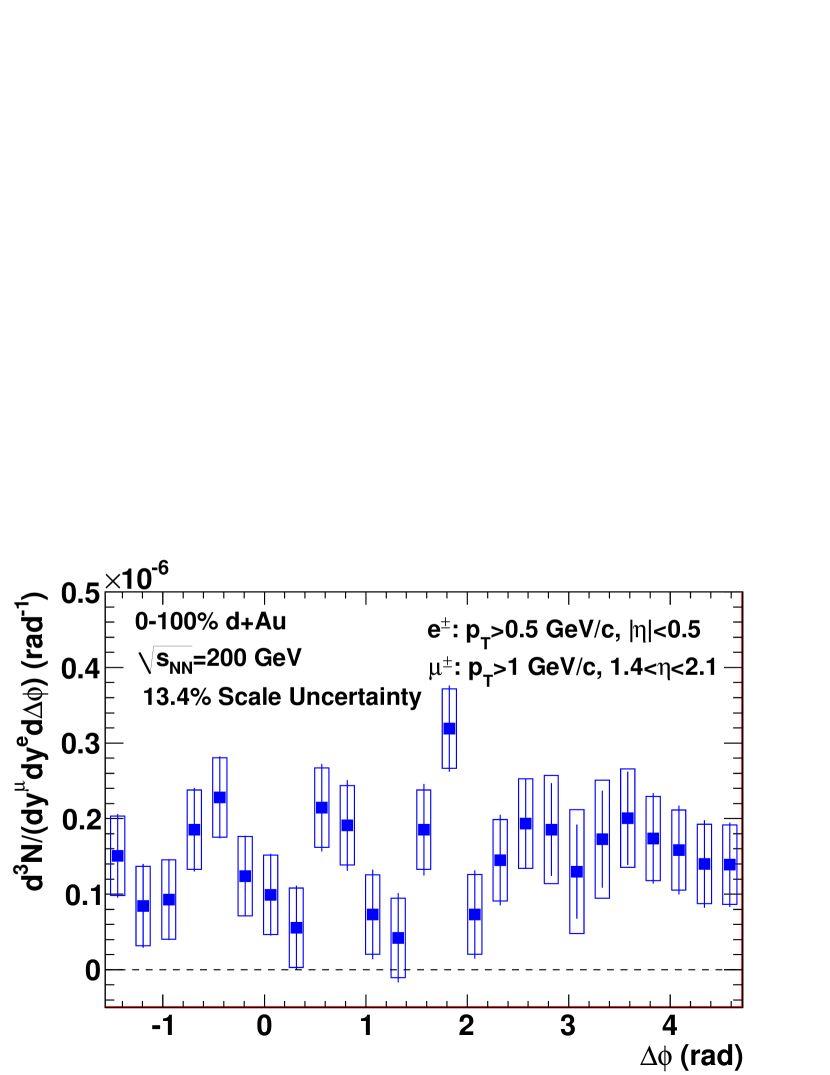
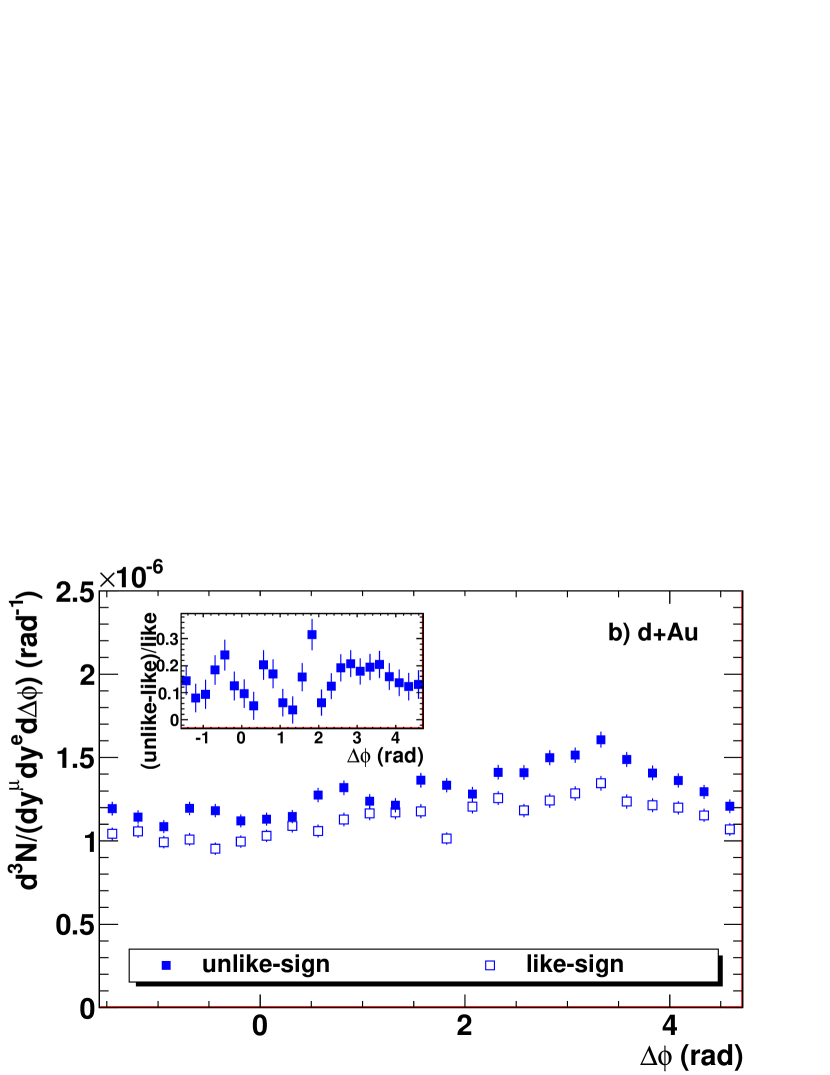
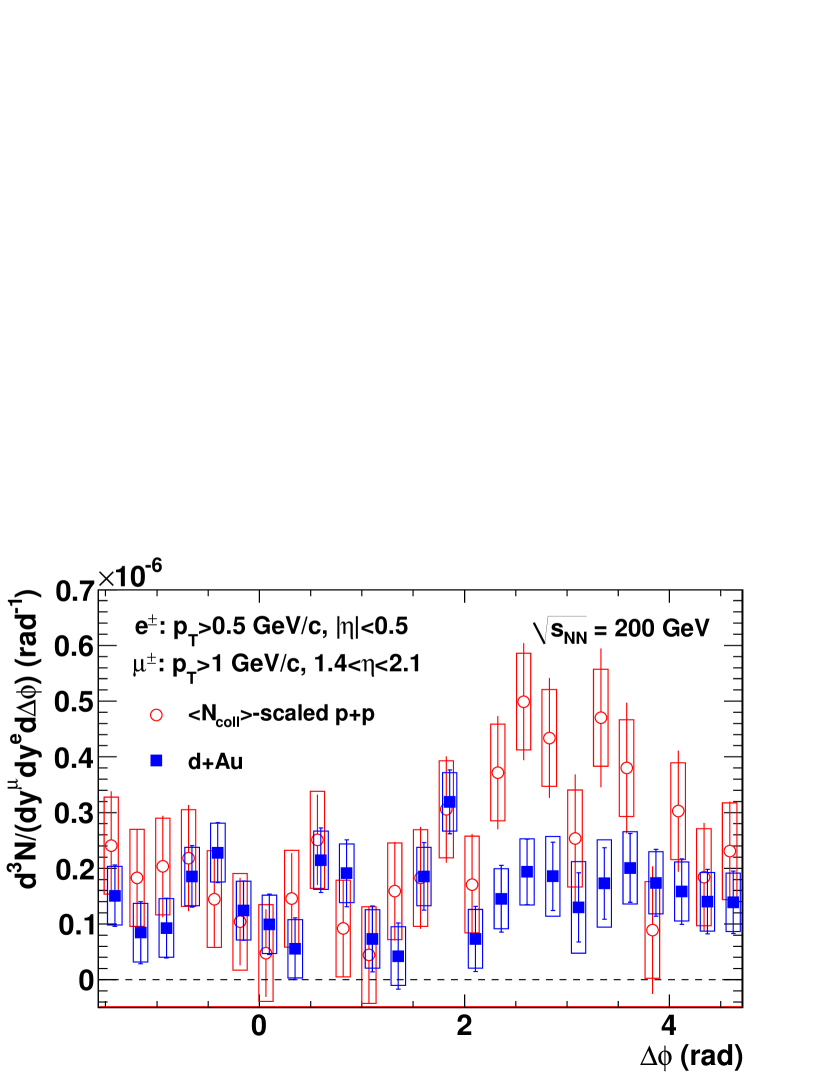
The fully-corrected like-sign subtracted pair yield as a function of for electrons with GeV/ and with forward muons with GeV/ and in 0%–100% +Au, corresponding to the total inelastic cross section, is shown in Fig. 9. A nonzero correlations strength is observed. However, unlike the data, there is a much less distinct back-to-back peak near of . Fig. 10 shows the overlay of the and +Au pair correlations. The pair correlations are scaled by the +Au Adare et al. (b). The peak in +Au is suppressed compared to , indicating a medium modification to the yield per collision in +Au.
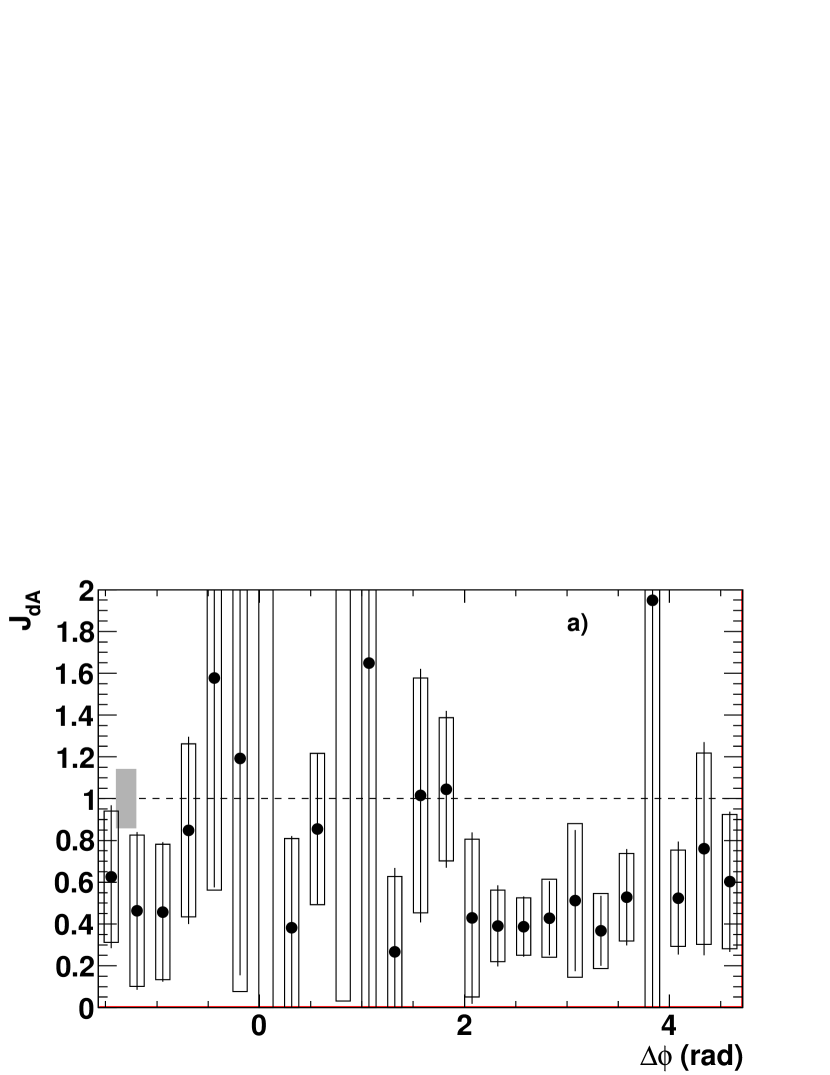
To quantify the difference between and +Au yields, we calculate the ratio defined as the ratio of a pair yield in +Au to the -scaled pair yield in .
| (8) |
Any deviation from unity of this ratio would indicate modification to the yield. When taking this ratio several systematic uncertainties common to and +Au cancel. These are dominantly from identical cuts used in the analyses with the same systematic uncertainties. The noncanceling type C systematic uncertainties in the and +Au yields are 7.7% and 8.9%, respectively.
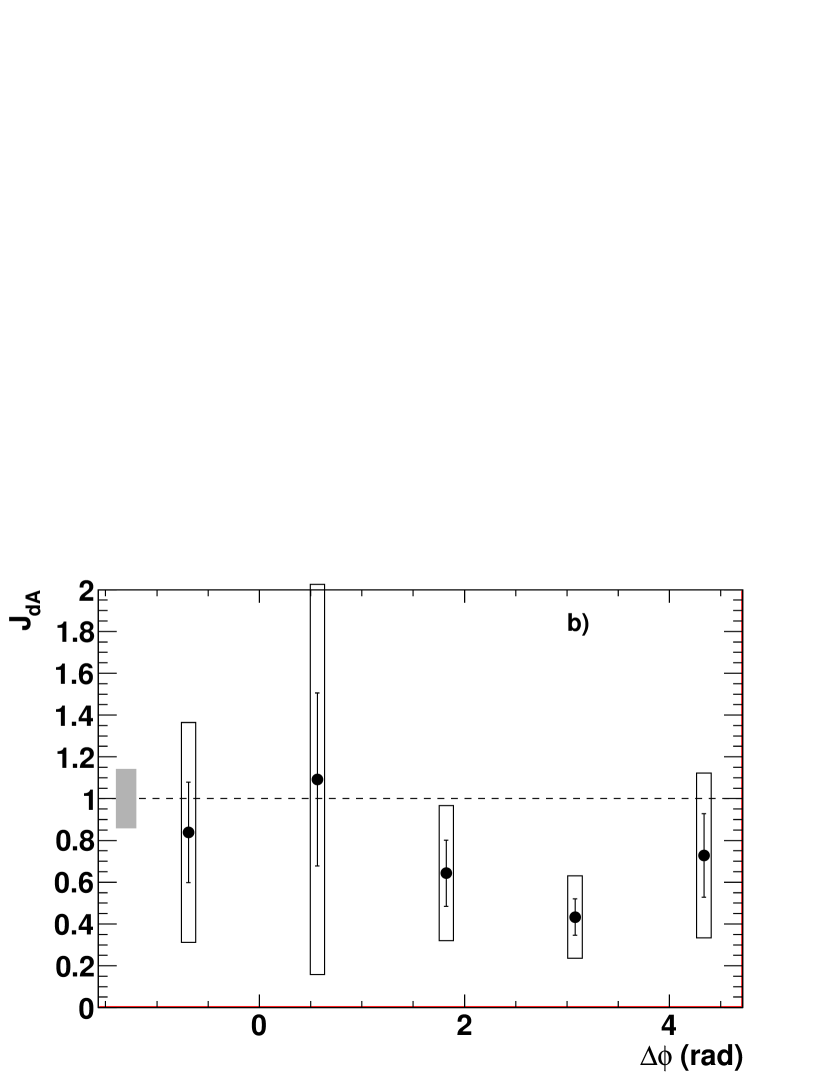
Fig. 11a shows a plot of as a function of for all bins in . The bars are statistical uncertainties and the type B systematic uncertainties are plotted as boxes. The noncanceling type-C uncertainty is 14.1% and is indicated by the shaded box around one on the left. While the points near are consistent with unity with large error bars, the points near , where is about 0.4. For clarity, Fig. 11b shows a rebinning of Fig. 11a. We find
| (9) | |||||
for the bin near . This value is 3.5 different from unity after combining the statistical and systematic uncertainties.
These results show that, in the measured kinematics, charm pairs are modified in the cold nuclear medium. These results are in a different kinematic region than either the single electrons, which are enhanced at midrapidity Adare et al. (2012), or the single muons, which are suppressed at forward rapidity Adare et al. (a). From the pythia simulation, the – correlations arise from partons in the gold nucleus with at , on the edge of the shadowing region. As discussed in Section IV.1, the back-to-back peak is dominated by leading order gluon fusion, while the continuum is dominated by other processes like flavor excitation and gluon splitting. The observed back-to-back peak and pedestal in and +Au should help lead to an understanding of the mechanism or mechanisms responsible for the modification. For example, the back-to-back peak is dominated by low- gluons participating in the hard scattering, whereas the continuum has a larger contribution of quarks participating in the hard scattering. Quarks are probably less shadowed than gluons at the and where this analysis is measured. It is possible that there are kinematic differences between the final state charm quarks in the peak and the continuum. These differences could affect the amount of final state energy loss and multiple scattering that modify the measured pair yields. It may be possible to combine these results with other cold nuclear matter charm measurements to disentangle the effects of shadowing, saturation, and energy loss.
V Summary and conclusions
We presented PHENIX results for heavy flavor production of azimuthally-correlated unlike sign – pairs in and +Au collisions at of 200 GeV. The yield shows a nonzero continuum as well as a back-to-back peak structure centered at . When compared with several models, we find the charm cross section 538 46 (stat) 197 (data syst) 174 (model syst) b. This is also consistent with previously measured cross sections at this center of mass energy. In +Au collisions a yield reduction in the back-to-back peak is observed, where we measure = 0.433 0.087 (stat) 0.135 (syst). This indicates that the nuclear medium modifies the correlations. Such a suppression could arise due to nuclear PDF shadowing, saturation of the gluon wavefunction in the Au nucleus, or initial/final state energy loss and multiple scattering.
ACKNOWLEDGMENTS
We thank the staff of the Collider-Accelerator and Physics Departments at Brookhaven National Laboratory and the staff of the other PHENIX participating institutions for their vital contributions. We acknowledge support from the Office of Nuclear Physics in the Office of Science of the Department of Energy, the National Science Foundation, a sponsored research grant from Renaissance Technologies LLC, Abilene Christian University Research Council, Research Foundation of SUNY, and Dean of the College of Arts and Sciences, Vanderbilt University (U.S.A), Ministry of Education, Culture, Sports, Science, and Technology and the Japan Society for the Promotion of Science (Japan), Conselho Nacional de Desenvolvimento Científico e Tecnológico and Fundação de Amparo à Pesquisa do Estado de São Paulo (Brazil), Natural Science Foundation of China (P. R. China), Ministry of Education, Youth and Sports (Czech Republic), Centre National de la Recherche Scientifique, Commissariat à l’Énergie Atomique, and Institut National de Physique Nucléaire et de Physique des Particules (France), Bundesministerium für Bildung und Forschung, Deutscher Akademischer Austausch Dienst, and Alexander von Humboldt Stiftung (Germany), Hungarian National Science Fund, OTKA (Hungary), Department of Atomic Energy and Department of Science and Technology (India), Israel Science Foundation (Israel), National Research Foundation and WCU program of the Ministry Education Science and Technology (Korea), Physics Department, Lahore University of Management Sciences (Pakistan), Ministry of Education and Science, Russian Academy of Sciences, Federal Agency of Atomic Energy (Russia), VR and Wallenberg Foundation (Sweden), the U.S. Civilian Research and Development Foundation for the Independent States of the Former Soviet Union, the US-Hungarian Fulbright Foundation for Educational Exchange, and the US-Israel Binational Science Foundation.
References
- Brambilla et al. (2011) N. Brambilla, S. Eidelman, B. Heltsley, R. Vogt, G. Bodwin, et al., Eur. Phys. J. C 71, 1534 (2011).
- Gelis et al. (2010) F. Gelis, E. Iancu, J. Jalilian-Marian, and R. Venugopalan, Ann. Rev. Nucl. Part. Sci. 60, 463 (2010).
- Wang and Guo (2001) X.-N. Wang and X.-f. Guo, Nucl. Phys. A 696, 788 (2001).
- Frankfurt and Strikman (2007) L. Frankfurt and M. Strikman, Phys. Lett. B 645, 412 (2007).
- Vitev (2007) I. Vitev, Phys. Rev. C 75, 064906 (2007).
- (6) A. M. Sickles, arXiv:1309.6924.
- Adare et al. (2012) A. Adare et al. (PHENIX Collaboration), Phys. Rev. Lett. 109, 242301 (2012).
- Adare et al. (2013) A. Adare et al., Phys. Rev. C 87, 034904 (2013).
- Adare et al. (a) A. Adare et al. (PHENIX Collaboration), arXiv:1310.1005.
- Adare et al. (2011a) A. Adare et al. (PHENIX Collaboration), Phys. Rev. Lett. 107, 172301 (2011a).
- Kang et al. (2012) Z.-B. Kang, I. Vitev, and H. Xing, Phys. Rev. D 85, 054024 (2012).
- Stasto et al. (2012) A. Stasto, B.-W. Xiao, and F. Yuan, Phys. Lett. B 716, 430 (2012).
- Jalilian-Marian and Rezaeian (2012) J. Jalilian-Marian and A. H. Rezaeian, Phys. Rev. D 86, 034016 (2012).
- Lappi and Mantysaari (2013) T. Lappi and H. Mantysaari, Nucl. Phys. A 908, 51 (2013).
- Adcox et al. (2003) K. Adcox et al. (PHENIX Collaboration), Nucl. Instrum. Methods A 499, 469 (2003).
- (16) T. Sjostrand, S. Mrenna, and P. Z. Skands, PYTHIA 6.4 Physics and Manual, J. High Energy Phys. 05 (2006) 026.
- Aphecetche et al. (2003) L. Aphecetche et al. (PHENIX Collaboration), Nucl. Instrum. Methods A 499, 521 (2003).
- Adare et al. (b) A. Adare et al. (PHENIX Collaboration), arXiv:1310.4793.
- Adler et al. (2007) S. Adler et al. (PHENIX Collaboration), Phys. Rev. D 76, 092002 (2007).
- Adare et al. (2011b) A. Adare et al. (PHENIX Collaboration), Phys. Rev. C 84, 044905 (2011b).
- Adler et al. (2006) S. Adler et al. (PHENIX Collaboration), Phys. Rev. C 73, 054903 (2006).
- Hornback (2007) D. Hornback, Ph.D. thesis, University of Tennessee (2007).
- (23) W. Vogelsang, private communication.
- Adare et al. (2006) A. Adare et al. (PHENIX Collaboration), Phys. Rev. Lett. 97, 252002 (2006).
- (25) S. Frixione, P. Nason, and G. Ridolfi, J. High Energy Phys. 09 (2007) 126.
- (26) S. Frixione and B. R. Webber, J. High Energy Phys. 06 (2002) 029.
- Adare et al. (2009a) A. Adare et al. (PHENIX Collaboration), Phys. Rev. D 79, 012003 (2009a).
- Adare et al. (2009b) A. Adare et al. (PHENIX Collaboration), Phys. Rev. Lett. 103, 082002 (2009b).