Structural and Magnetic Properties of CoO-Pt core-shell nanoparticles
Abstract
Using microemulsion methods, CoO-Pt core-shell nanoparticles (NPs), with diameters of nominally 4 nm, were synthesized and characterized by high-resolution transmission electron microscopy (HRTEM) and a suite of x-ray spectroscopies, including diffraction (XRD), absorption (XAS), absorption near-edge structure (XANES), and extended absorption fine structure (EXAFS), which confirmed the existence of CoO cores and pure Pt surface layers. Using a commercial magnetometer, the ac and dc magnetic properties were investigated over a range of temperature (2 K 300 K), magnetic field ( kOe), and frequency ( kHz). The data indicate the presence of two different magnetic regimes whose onsets are identified by two maxima in the magnetic signals, with a narrow maximum centered at 6 K and a large one centered at 37 K. The magnetic responses in these two regimes exhibit different frequency dependences, where the maximum at high temperature follows a Vogel-Fulcher law, indicating a superparamagnetic (SPM) blocking of interacting nanoparticle moments and the maximum at low temperature possesses a power law response characteristic of a collective freezing of the nanoparticle moments in a superspin glass (SSG) state. This co-existence of blocking and freezing behaviors is consistent with the nanoparticles possessing an antiferromagnetically ordered core, with an uncompensated magnetic moment, and a magnetically disordered interlayer between CoO core and Pt shell.
pacs:
75.75.Fk, 75.50.Vv, 61.05.cj, 75.40.GbI Introduction
Over the past few decades, cobalt based nanoparticles (NPs) have attracted a significant amount of research interest because of their applications in ferrofluids, electronic components, solar energy transformers, anodes for batteries, and chemical catalysts.Guo et al. (2012); Zeisberger et al. (2007); Osorio-Cantillo et al. (2012) Such nanoparticles are one of the leading candidates for high density magnetic recording media, where the particles with small size, narrow size distribution, and controlled shape are required.Kobayashi et al. (2003)
In addition, fine Co-based particles are model materials for fundamental investigations of a variety of magnetic phenomena, such as exchange spring and exchange bias in magnetically hard and soft phases of antiferromagnetic (AFM) and ferromagnetic (FM) interlayers, respectively.Morales et al. (2009); Chandra et al. (2012) Studies of the dynamics of the Co based nanoclusters showed interesting features such as pure superparamagnetic (SPM) relaxation,Jönsson et al. (2004); Tadic et al. (2009); Jönsson and García-Palacios (2001) spin canting,Lee et al. (2012) and superspin glass (SSG) behavior.Chandra et al. (2012); Sahoo et al. (2002) More specifically, the SSG behavior is typically manifested in strongly interacting and dense nanoparticle systems showing spin glass (SG) behavior. The evidence of SSG transition in fine-particle systems is strengthened by standard spin glass fingerprints, namely the critical slowing down of the relaxation and the divergence of the nonlinear susceptibility at a finite glass transition temperature .Sahoo et al. (2002) Finally, based on numerous studies, interparticle dipole-dipole interactions are known to increase the average blocking temperature and affect the height and distribution of the energy barriers.Mørup et al. (2010)
All of these interesting magnetic phenomena in nanoparticles can be induced and influenced by a combination of particle sizes and surface effects.Zysler et al. (2003); Thota and Kumar (2007); Winkler et al. (2005, 2008); De Biasi et al. (2005); Jamet et al. (2001); De Toro et al. (1999); Ambrose and Chien (1996); Arrott (1985); Rechtin et al. (1970); Golosovsky et al. (2006); Tiwari and Rajeev (2005); Wang and Zeng (2009) Especially in small nanoparticles, the surface effects play an important role in tuning of the magnetic behavior as the decreasing of particle size leads to an increasing fraction of atoms lying at or near the surface, where uncompensated surface spins can generate a net magnetic moment. Punnoose et al. (2001) These interface effects are more pronounced in antiferromagnetic nanoparticles than ferromagnetic ones because of lower magnetic moment of their cores. Anomalous magnetic properties arising from complicated surface effects have been the focus of experimental studes over the past few years by investigations involving antiferromagnetic nanoparticles of NiO,Winkler et al. (2005, 2008); Singh et al. (2010); Rall and Seehra (2012) -Fe2O3,Akamatsu et al. (2006), FeOOHH2O,Punnoose et al. (2005) and CoO.Zhang et al. (2003); Silva et al. (2010); Gubin and Koksharov (2002) In fact, CoO is specifically germane to the present study, and its bulk form exhibits antiferromagnetic ordering at a Néel temperature K. Above , CoO possesses a NaCl structure, whereas below , unstressed crystals experience tetragonal contractions along the cubic [100] directions, giving rise to domains.Tombs and Rooksby (1950); Rechtin and Averbach (1971); Silinsky and Seehra (1981) Reducing the particle size to the nanoscopic scale reduces and dramatically changes the magnetic properties.Silva et al. (2010)
Given the broad range of work reported, it is noteworthy that investigations involving antiferromagnetic CoO nanoparticles with Pt coatings has not been reported. In this paper, we describe the detailed structural and magnetic study of CoO-Pt core-shell nanoparticles with diameters near 4 nm, where the choices of the Pt coating and the size of particles were driven by the desire to avoid agglomeration and to enhance potential biomedical applications. Due to the small size of the nanoparticles being studied, the detailed structure properties were investigated using the methods of X-ray absorption near-edge structure (XANES) and extended X-ray absorption fine structure (EXAFS) giving information about the number and type of neighboring atoms, inter-atomic distances, and disorder. Theoretical simulations were performed to illustrate the effect of crystalline structure on the EXAFS pattern. Analysis of results of magnetic measurements (dc magnetization and ac susceptibility) showed a combination of superparamagnetic blocking and collective superspin glass freezing. The interpretations of the results indicate that the presence of Pt shell is the key factor in observed magnetic behavior. Specifically, the Pt shell, in combination with the small size of Co-based core, can polarize (or frustrate) the spins at the surface and in the near-surface regions of antiferromagnetic CoO nanoparticles. Such cooperation of two different processes with completely different spins dynamics in Co-based nanoparticles has not been previously reported and is an important finding of this work. Usually the existence of shell layers with different spin dynamics leads to an exchange bias effect. However, in the sample under study, no bias mechanism was observed, thereby indicating the mechanism of spin glass freezing that leads to the SSG state is mainly influenced by the strong dipolar magnetic interactions of superspins.
The presentation of our work starts by providing the details of the synthesis protocols used to fabricate the samples, and the subsequent characterization methods used to explore the chemical composistion and morphology. Next, the magnetic investigations and results are described, while an extentend discussion of the anlaysis of all of the data are given. Finally, the paper concludes with a summary of our findings.
II EXPERIMENTAL DETAILS
II.1 Sample Preparation
The CoO-Pt core-shell nanoparticles were synthesized using the reverse micelle concept,Carpenter et al. (1999); Lin et al. (2001); Lee and Choi (2003) based on dissolution of a cationic surfactant in an organic solvent and the formation of spherical reverse micelle aggregates. All chemicals were purchased from Aldrich and Sigma and used without further purification. The reverse micelle solutions were prepared using cetyltrimethylammonium bromide (CTAB) as the surfactant with octane as the oil phase, while 1-butanol was used as a co-surfactant helping to stabilize the micelle solutions. Water solutions of CoCl2, NaBH4 and H2PtCl6 were used for the formation of initial droplets in the reverse micelles, whose reaction lead to the final nanoparticles. The size of the particles (water droplet size) was controlled by adjusting of the water-to-surfactant molar ratio [H2O/CTAB] = 5. The Co based particles formed the cores coated by a non-magnetic Pt surface layer. This process prevents the agglomeration of particles and is effective in preparing particles with metal cores and different shells.
II.2 Characterization
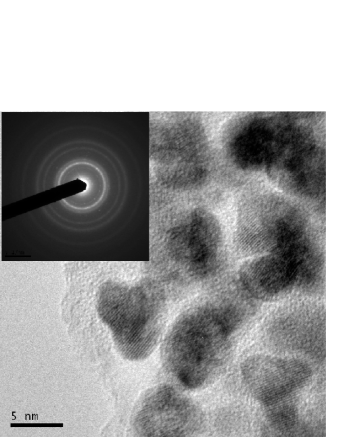
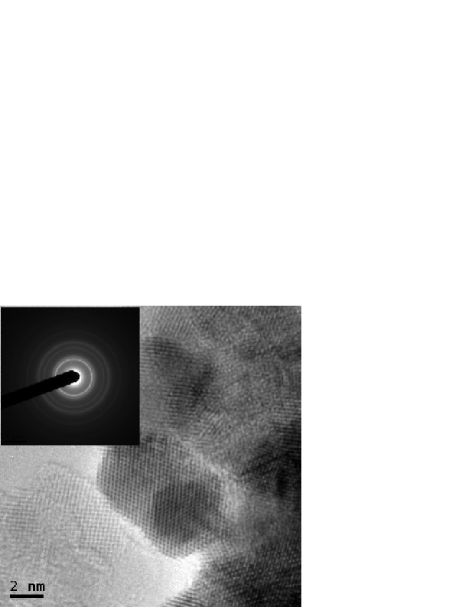
High-resolution transmisson electron microscopy (HRTEM) and electron diffraction analysis were performed with a JEOL JEM 3010 transmission electron microscope operated at 300 kV (LaB6 cathode). Copper grids coated with a holey carbon support film were used to prepare samples for the TEM studies. Powdered samples were dispersed in ethanol, and the suspension was treated in an ultrasonic bath for 10 min.
The structure of the nanoparticles was investigated by means of the angular dispersive x-ray diffraction (XRD) and x-ray absorption spectroscopy (XAS). The XRD measurements using high-energy photons were performed at the wiggler beamline BW5 at HASYLAB/DESY (Hamburg, Germany). The wavelength of the radiation was set to 0.12398 Å, which corresponds to the beam energy of 100 keV. Thin-walled (20 m) quartz capillaries having diameters of 2 mm were used for the XRD measurements. A powder sample was illuminated for 50 s with the well collimated beam having the cross-section of mm2. A LaB6 standard was used to calibrate the sample-to-detector distance along with the tilt of the imaging plate relative to the beam path and to determine the instrumental broadening. Diffraction patterns were collected in transmission mode using a MAR345 image plate detector. Two dimensional XRD patterns were radially integrated using the FIT2D program.Hammersley et al. (1996)
The local atomic arrangement was investigated by x-ray absorption spectroscopy (XAS), which provides complementary information to XRD measurements though offering better chemical sensitivity. The XAS measurements were conducted at the bending magnet experimental stations C and X1 at HASYLAB/DESY. The fine oscillations of the linear absorption coefficient (E) were measured at the Co edge (7709 eV) and at the Pt edge (11564 eV) in transmission mode using a fixed exit double-crystal Si (111). In order to optimize absorption signal, powder nanoparticles (7.1 mg) were uniformly dispersed with cellulose powder (200 mg). Compressing the mixture using a hydraulic press yielded a sample pellet with diameter and height of 13 and 3 mm, respectively. The pellet was placed behind the first ionization chamber and was illuminated by the incoming beam having the cross-section mm2. The energy calibration was performed simultaneously with the sample measurement by putting the corresponding reference Co or Pt foil behind the second ionization chamber. Experimentally measured x-ray absorption cross section (E) was analyzed by the standard procedures of data reduction described elsewhereKlementev (2001); Saksl et al. (2007) using the program VIPER.Klementev (2001); Klementiev and freeware (2013) Firstly, the EXAFS signal was extracted, weighted by , and subsequently Fourier transformed (FT) into the real space of interatomic distances. Then the main peak of the FT- signal was separated by applying the so-called Hanning window function with the coefficient . The resulting data were then inverse Fourier transformed back into -space, and these filtered data only contain information about the atoms nearest to the absorbing ones (first coordination shell). Finally, fitting by an appropriate model yields structural information about the coordination number , the interatomic distance , and the Debye-Waller factor . The backscattering amplitude and phase shift functions, necessary for computation of the EXAFS signal from the model, were calculated using the FEFF 6 code.Ankudinov et al. (1998)
Magnetic measurements were performed on a commercial superconducting quantum interference device (SQUID) magnetometer (Quantum Design MPMS XL5) over a range of temperatures (2 K K) and in applied static magnetic fields up to 50 kOe. A sample with mass 6.9 mg was placed in a plastic capsule that was supported by a plastic sample holder. The diamagnetic contribution of the capsule and holder are insignificant compared with the large magnetic signal of the sample, so no correction was necessary. For K, the complex ac magnetic susceptibility, , was recoreded by the same instrument using an ac magnetic field of 2.5 Oe in the frequency interval 1 Hz kHz while no dc magnetic field was applied.
III RESULTS AND DISCUSSION
III.1 Structural properties
Typical micrographs, showing the size and shape of the resulting CoO-Pt core-shell nanoparticles, are shown in Fig. 1, and particle size (log-normal) distribution analysis yielded diameters of nm. Although HRTEM evidence of the core-shell morphology was not resolved, this result is consistent with the findings of Park and Cheon,Park and Cheon (2001) whose HRTEM images showed only smooth and homogenous boundaries for solid-solutions and core-shell CoPt nanoparticle samples. However, the core-shell nature of our CoO-Pt nanoparticles was resolved by our EXAFS experiments, vide infra. Electron diffraction patterns, shown as insets in Fig. 1, clearly indicate the crystalline character of the sample and long-range structural order.

The XRD pattern of our CoO-Pt core-shell nanoparticles is shown in Fig. 2, where the relatively broad Bragg peaks indicate the nanocrystalline nature of the sample. While the analysis suggests the presence of the fcc Pt phase (PDF 40-802), the CoO phase can not be resolved unambiguously due to overlapping of the anticipated CoO peaks with the ones associated with the Pt phase. These observations are typical for core-shell nanostructures of iron or cobalt fine nanoparticles coated with Au or Pt.Carpenter (2001); Park et al. (2004) So, the CoO phase in our particles was resolved by our EXAFS and XANES studies, vide infra. Nevertheless, the XRD can be used to extract the average grain size from the line broadening by applying the Scherrer formula.Scherrer (1918) More specifically, Bragg peaks at (111), (200), and (220) were fitted to Gaussian functions to extract values for the FWHM, which were corrected for the instrumental broadening. Finally, the anlaysis yielded values for the average size of nanoparticles, nm, and the lattice parameter, Å.
In order to provide experimental evidence for the CoO-Pt core-shell morphology of our samples, XAS measurements at the Pt and Co edges were performed. A great advantage of XAS is its chemical sensitivity that provides a mircoscopic probe of the atomic neighborhood of a selected atomic constituent. Generally, a signal obtained from XAS consists of two parts: (i) the part near the absorption edge, literally named XANES (X-ray absorption near-edge structure) and (ii) EXAFS (extended X-ray absorption fine structure) that starts eV above an absorption edge and persists up to about 1 keV beyond the edge by revealing specific oscillations of the absorption coefficient. In ohter words, XANES can provide information about the electronic configuration and is sensitive to the oxidation state of the absorbing atom, while EXAFS contains information about coordination environment of the absorbing atom.
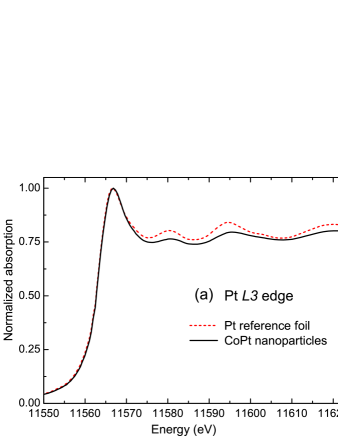
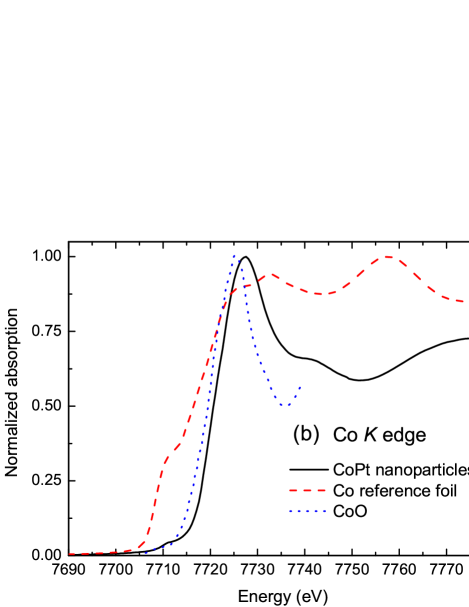
The XANES spectra for nanoparticles obtained at the Pt and Co edges are shown Fig. 3, together with XANES spectra obtained from pure Pt and Co reference foils (with micrometer size), respectively. In the case of the Pt edge, the XANES signal coming from CoO-Pt core-shell nanoparticles is practically identical to the signal from Pt reference foil. This behavior indicates the Pt atoms in the nanoparticles have comparable electronic configurations and the same oxidation states (exactly the same position and the shape of the absorption edge) as Pt atoms in the reference foil. The situation at Co edge is completely different, and the XANES signal of CoO-Pt core-shell particles has no common features with XANES extracted from the Co reference foil, as documented in Fig. 3 (b). It implies that Co atoms of studied nanoparticles feel diverse electronic surrounding as Co atoms in the reference foil. Shifting and mainly shape changing of the absorption edge suggests different oxidation state of cobalt atoms, specifically a CoO phase. These results observed at the Co absorption edge are in accordance with the observations of Cheng and co-authors,Cheng et al. (2004) who used XANES and EXAFS methods for a detailed structural study of Co nanoparticles with different sizes (3 nm, 5 nm, and 12 nm) prepared under anaerobic conditions. Their XANES results showed that the pattern from the 12 nm Co particles closely resembled the data from the Co foil at the 7712 eV edge, while the pattern for the 5 nm particles had a much smaller shoulder and the 3 nm particles showed almost no signature. In fact, the dataCheng et al. (2004) from the 3 nm particles are closest to signatures expected from a CoO standard. In other words, the smallest Co particles (3 nm) possess a surface layer of oxygen eventhough the synthesis was realized in anaerobic conditions.Cheng et al. (2004) The results from our study are consistent with this trend, where the presence of CoO was identified in the XANES data.
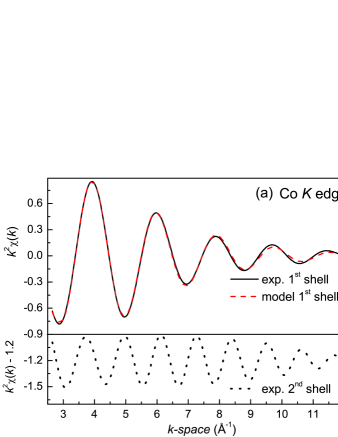
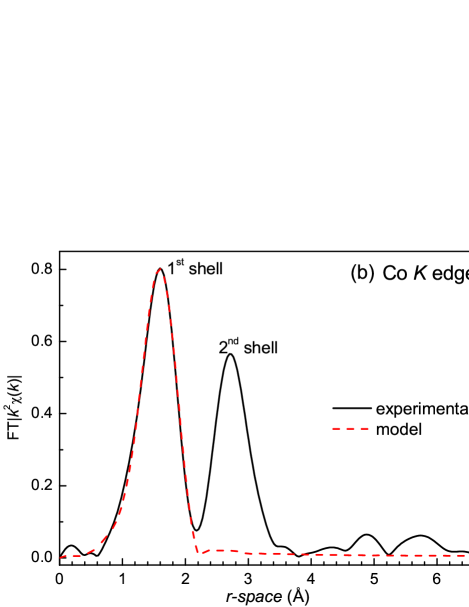
Additional insight about the structure of our samples was obtained from the EXAFS data, shown in Figs. 4 and 5. Immediately obvious is that the Fourier transformation of the weighted signal at the Co edge is characterized by two well separated peaks situated at 1.6 Å and 2.7 Å, see Fig. 4(b). These peak positions corresponds roughly to the most probable interatomic distances between an absorbing atom and its nearest neighboring atoms. It is important to note that the interatomic distances extracted in this manner are usually underestimated, so one has to apply phase shift corrections to obtain reasonable values. Nevertheless, the location of the first peak at relatively low values suggests the presence of atoms, with a small atomic radius, surrounding the Co. Consequently, an inverse Fourier transformation of the first peak can be performed, as described in the preceeding section, with 0.61 Å Å, and fitted by a shell of oxygen atoms. The results of the fit are compared to the data in Fig. 4(a), and the values of the fitting parameters are , Å, Å2 with . The same procedure was applied to the second peak, which contains information about the second coordination shell, where the analysis is restricted to 2.19 Å Å.
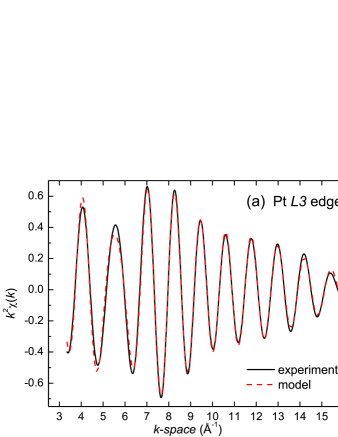
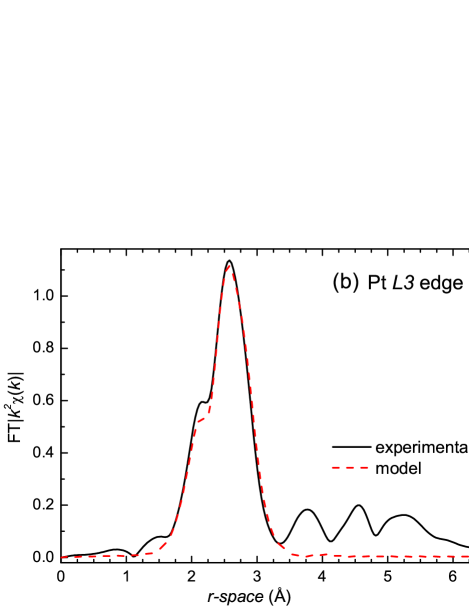
To unambiguously confirm that the external shell of nanoparticles consists exclusively of Pt atoms and does not contain any Co atoms, the Pt EXAFS signal, Fig. 5 was analyzed using two different models. The initial fitting was performed for a cluster of 12 Pt atoms (the first coordination shell) surrounding an absorbing Pt atom with positions corresponding to the atomic positions in fcc Pt phase, as motivated by the XRD results. The second model is a modification of the first one, but with 4 of the 12 Pt atoms were replaced by Co atoms. This model represents the Pm3m CoPt3 phase (PDF 299-499). We have found that including Co atoms in the first coordination shell strongly decreases the fit quality if the coordination number is constrained to the values between 2 and 4. When leaving unconstrained, its value tended to zero, meaning that there is essentially no contribution from Co atoms in the first coordination shell. Therefore, we conclude the shell surrounding the Co core consists exclusively of Pt atoms. As can be seen from Fig. 5, the final fit of the experimental data shows nice agreement with the first model based on a pure fcc Pt phase, where the extracted structural parameters , Å, Å2 with . To summarize the structural studies based on results of XRD, XANES and EXAFS experiments, our samples consist of core CoO particles with pure Pt shells.
III.2 dc magnetization
III.2.1 Temperature dependence
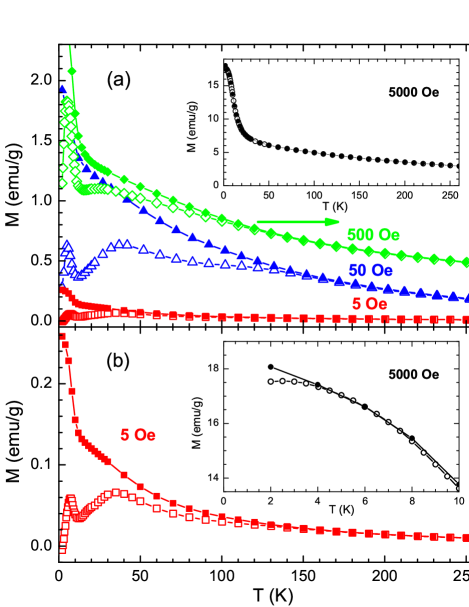
The temperature dependences of the zero-field-cooled (ZFC) and field-cooled (FC) dc-magnetizations, and , in low static fields ( Oe) are shown in Fig. 6. In these low fields, the magnetic response bifurcates at a temperature, , exhibiting irreversibility at lower temperatures. In addition, a striking feature is the presence of two discrete ZFC maxima in 5 Oe, suggesting two blocking or freezing temperatures, and . The field dependences of these three characteristic temperatures are tabulated in Table 1.
| (Oe) | (K) | (K) | (K) |
|---|---|---|---|
| 5 | 6 | 36 | 168 |
| 50 | 5 | 37 | 142 |
| 500 | 4 | 29 | 115 |
| 5000 | 3 | 3 |

Another significant feature of the data shown in Fig. 6 is the behavior of , which shows a progressive increase with decreasing temperature below and a sharp rise below . The sharp increase at the lowest temperatures suggests an additional magnetic contribution and may be related to the collective freezing of the disordered spins in the interface “spin” layer between antiferromagnetic CoO core and non-magnetic Pt shell.
The presence of two maxima in data acquired in low fields was also reported by Winkler et al.Winkler et al. (2005, 2008) and Thota and KumarThota and Kumar (2007) for NiO core-shell nanoparticles with antiferromagnetic cores. They associated this peculiar behavior with the freezing of the magnetically ordered region in the surface shell. In addition, Zhang et al.Zhang et al. (2003) interpreted the anomalous properties of antiferromagnetic CoO nanoparticles in terms of a core-shell model, where the ferromagnetic portion is attributed to the increase of the uncompensated moments at the surface resulting from the reduced coordination of surface spins. Furthermore, the results of Zysler et al.Zysler et al. (2003) and Biasi et al.De Biasi et al. (2005) show on the important role of the surface anisotropy in determination of the anomalies of dc magnetization of 3 nm sized magnetic nanoparticles. Likewise, Dutta et al.Dutta et al. (2009) employed a core-shell model, which assumes the coexistence of an ordered core with disordered surface spins, to explain unconventional magnetic properties of nominally 4 nm iron oxide nanoparticles.

The existence of these two, low-temperature maxima in low magnetic fields begs the question as to the nature of the magnetic state at high temperatures. In an attempt to resolve this issue, magnetic susceptibility times temperature versus temperature plots were constructed, and the results for the data sets in 5 Oe and 5000 Oe are shown in Fig. 7. The data for these two fields show contrasting behavior, as the data in 5 Oe indicate a ferromagnetic trend for 150 K K while the results in 5000 Oe indicate an antiferromagnetic trend for nearly all temperatures. In other words, the signatures present in the static magnetic responses appear to possess a complex interplay of temperature and magnetic field, so the results of isothermal studies will be presented before a full discussion is presented at the end of this subsection.
III.2.2 Field dependence
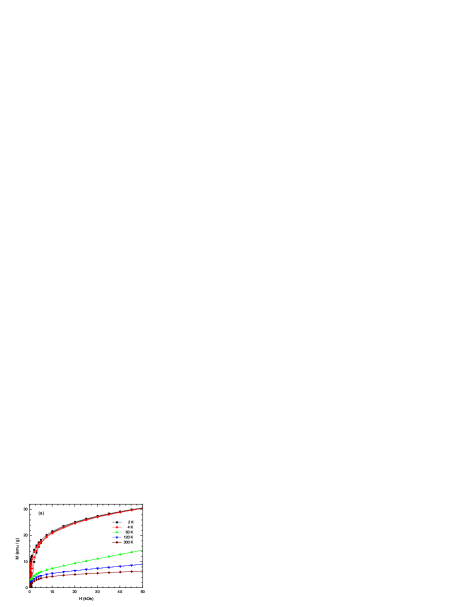
After ZFC, the isothermal loops were obtained by sweepting to kOe at several temperatures, Fig. 8. For K, the magnetization curves are reversible and no coercivity was detected, whereas for K, hysteresis was observed, and the values of the coercive fields are listed in the legend of Fig. 8(b). For K, it is noteworthy that a temperature-dependent paramagnetic constribution is observed as a straight-line for 30 kOe kOe. This observation suggests a modified Langevin formalism, which has been applied to other systems for ,Makhlouf et al. (1997); Seehra et al. (2000); Seehra and Punnoose (2001); Punnoose et al. (2004) might be applied to the data sets at 50 K and 120 K, because neither a classical Langevin functionKim et al. (2001) nor a weighted sum of Langevin functionsTadic et al. (2009); Fonseca et al. (2002) plausibly simulated the data. The modified Langevin analysis provides coarse estimates of the nanoparticle magnetic moments of 1500 at 50 K and 2000 at 120 K, where, presumably, the difference between these two values arises from thermal variations of the antiferromagnetic interactions.
Using the data reported by Silva et al.,Silva et al. (2010) the moments at 50 K and 120 K might be expected from 4 nm diameter nanoparticles of antiferromagnetically ordered CoO. However, the Néel temperature of nanoparticles of this size are expected to be significantly less than 240 K.Silva et al. (2010) So, the temperature of the maximum value of , for the ZFC data set with subsequent measuring in 5 Oe, Fig. 8, is near 145 K and provides an estimate of .Bragg and Seehra (1973); Seehra and Punnoose (2001); Dutta et al. (2008) In addition, K was estimated a Curie-Weiss law analysis of the data obtained at 10 kOe. Ensemble, various analyses of the data consistently indicate K.
III.3 ac susceptibility
The real (in-phase), , and the imaginary (out-of-phase), , of the magnetic susceptibility are shown in Figs. 9 and 10 after ZFC. The existence of two maxima are observed in both components near the temperatures of the peaks resolved in the dc study, Fig. 6 and Table 1, but the ac data reveal these feasures to be frequency dependent. More specifically, the real part of the magnetic responses shifts toward higher temperatures for both maxima with increasing frequency, while the amplitudes of the magnetic signals decrease. These trends are also reflected in the imaginary part of the magnetic responses although the amplitudes of the magnetic signals show a weak increase. Generally speaking, these results for the dynamical response are characteristics of blocking or freezing processes, so additional inspection of the the thermal and frequency responses are necessary to clarify the nature of the peaks.

The narrow low temperature peak located at 6 K exhibits the presence of a “cusp-like” maximum in , which weakly depends on the frequency. Such characteristics are expected for “ideal” spin glasses.De Toro et al. (1999); Mydosh (1994) Contrastingly, the high temperature peak of located near 37 K exhibits features associated with a broad distribution and possesses a strong frequency dependence. A useful and sensitive criterion to distinguishing between the freezing and the blocking processes lies in the determining the relative shift of the peak temperature in given by Mydosh (1994)
| (1) |
where is the average value of the frequency dependent blocking/freezing temperature determined by the maximum of , while denotes the difference between measured in the frequency interval. The parameter assumes values in the range for atomic spin glassesTiwari and Rajeev (2005); Mydosh (1994); Goya and Morales (2004) and for non-interacting superparamagnets.Winkler et al. (2005); De Toro et al. (1999); Mydosh (1994); Peddis et al. (2012) These ranges can be compared to the values of obtained for low temperature and high temperature features observed in our CoO-Pt core-shell samples, where calculated for low temperature maximum falls within the interval tpyically associated with a spin-glass state. On the other hand, the value of calculated for the high temperature maximum falls below the range usually associated with a non-interacting nanoparticle system,Winkler et al. (2005); De Toro et al. (1999); Mydosh (1994); Goya and Morales (2004) and thus the presence of inter-particle interactions can be inferred. Now that these qualitative associations have been made, quantitative analysis of the magnetic data will allow additional interpretations to be made.

III.3.1 High temperature (broad) peak
To quantitatively analyze the high temperature peak, the Stoner-Wohlfarth-Neél description can be used.Tadic et al. (2009); Vázquez-Vázquez et al. (2011) In this description, an anisotropy energy barrier blocks the magnetic moments until a sufficient thermal activation energy relaxes spins from the blocked state to the superparamagnetic state. The dynamics of the non-interacting superparamagnets are described by Neél-Arrhenius law,De Toro et al. (1999); Tiwari and Rajeev (2005) which can be written as
| (2) |
where is the time associated with particle flips between two energy states, is an attempt frequency, and is the temperature at which exhibits a maximum.Tadic et al. (2009); Tiwari and Rajeev (2005); Luis et al. (2006) For non-interacting particles, typical values for are usually within the range s. Fitting the experimental data to Eq. (2) yields s, which is considerably lower than the values expected for non-interacting particles. So the breath of the analysis can be expanded by using the Vogel-Fulcher law,Tadic et al. (2009); De Toro et al. (1999); Luis et al. (2006) namely
| (3) |
where accounts for a static interaction field due to the moments of surrounding particles.Singh et al. (2009) Fitting the data associated with the high temperature peak with Eq. (3) yields the reasonable results shown in Fig. 11(a). The resulting values for the parameters are s, K and K. The anisotropy barrier is related with the uniaxial anisotropy constant trough relation , where is the volume of the nanoparticle. For a particle with diameter nm, erg/cm3, which is a reasonable result.


III.3.2 Low temperature (sharp) peak
The temperature and frequency response of the ac susceptibility in the vicinity of the low temperature peak are dramaticaly different than the behavior observed near the high temperature peak. Since the data are strikingly similar to observations reported in other nanosystems,De Toro et al. (2012); Vázquez-Vázquez et al. (2011); Djurberg et al. (1997) the analysis begins by differentiating between behavior indicative of superspin glass (SSG) and the atomic spin glass (SG) behavior. Specifically for spin glasses, the spin freezing temperature, , can be defined as the temperature where the real part of ac susceptibility, manifests a maximum.Akamatsu et al. (2006); Petracic et al. (2006) Although is often taken as a temperature at which is 0.98 times the equilibrium susceptibility, it is reasonable to define as a temperature of maximum susceptibility in the curve for dynamical scaling analysis, as was demonstrated by Gunnarsson et al.Gunnarsson et al. (1992) and Djurberg et al.Djurberg et al. (1997) The dynamic scaling hypothesis provided that this system exhibits a conventional critical slowing down toward the transition temperature , the variation of maximum relaxation time with transition temperature is described byDe Toro et al. (1999); Akamatsu et al. (2006); Djurberg et al. (1997); Wu and Leighton (2003)
| (4) |
Here, is the characteristic time scale for the spin dynamics, is the critical temperature for spin-glass ordering (this is equivalent to the value of ), is a constant exponent, where is a dynamic exponent, and is the critical exponent characterizing the divergence of the correlation length given byDjurberg et al. (1997)
| (5) |
The agreement of experimental data with Eq. (4) is shown in Fig. 11(b), where the best fit yields the values of , K, and s. These results are comparable with other atomic spin glass systemsJönsson and García-Palacios (2001); Mørup et al. (2010); Zhang et al. (2003); Silva et al. (2010) and nanoparticles superspin glass systems, where typical values for the parameters are , s. Ensemble, these results indicate the slow spin dynamics in the vicinity of the low temperarture peak.
IV Summary
The structure and the magnetic properties of fine nanoparticles composed of antiferromagnetic CoO cores coated by a Pt shell, prepared by a reverse micelle method, are presented. A suite of experimental probes were used to establish the structural and magnetic properties of the nanoparticles that possess a nominal diameter of 4 nm. Below about 6 K, the core-shell nanoparticles possess superspin glass properties. At higher temperatures, up to about 37 K, the magnetism of the cores is blocked and interparticle interactions play an important role in the dynamical magnetic response. This co-existence of blocking and freezing behaviors is consistent with the nanoparticles possessing an antiferromagnetically ordered core, with an uncompensated magnetic moment, and a magnetically disordered interlayer between CoO core and Pt shell. Finally, due to their small diameters and the presence of the Pt shell, the cores experience magnetic ordering near 150 K. Ultimately, these results provide benchmarks by which this system can be judged for potential use in microlectronic or biotechnology applications.
Acknowledgements.
This work was supported by the Slovak Research and Development Agency under the contract APVV-0222-10 and APVV-0132-11 and VEGA projects of Ministry of Education of the Slovak Republic (No. 1/0583/11, No. 1/0861/12), by the Ministry of Education of the Czech Republic via ECOP program n. cz.1.07/2.3.00/30.0057 (ŠM), by the US National Science Foundation (NSF) via DMR-1202033 (MWM) and DMR-1157490 (NHMFL), and by the Fulbright Commission of the Slovak Republic (MWM). The authors (AZ and VZ) would like to thank DESY/HASYLAB project No. I-20110282 EC and also Dr. N. Murafa (AS CR, Rez, Czech Republic) for HRTEM measurements. Computing assistance from V. Tkáč is also gratefully acknowledged.References
- Guo et al. (2012) S. Guo, S. Zhang, L. Wu, and S. Sun, Angew. Chem. Int. Ed. 51, 11770 (2012).
- Zeisberger et al. (2007) M. Zeisberger, S. Dutz, R. Müller, R. Hergt, N. Matoussevitch, and H. Bönnemann, J. Magn. Magn. Mater. 311, 224 (2007).
- Osorio-Cantillo et al. (2012) C. Osorio-Cantillo, A. N. Santiago-Miranda, O. Perales-Perez, and Y. Xin, J. Appl. Phys. 111, 07B324 (2012).
- Kobayashi et al. (2003) Y. Kobayashi, M. Horie, M. Konno, B. Rodríguez-González, and L. M. Liz-Marzán, J. Phys. Chem. B 107, 7420 (2003).
- Morales et al. (2009) R. Morales, Z.-P. Li, J. Olamit, K. Liu, J. M. Alameda, and I. K. Schuller, Phys. Rev. Lett. 102, 097201 (2009).
- Chandra et al. (2012) S. Chandra, H. Khurshid, W. Li, G. C. Hadjipanayis, M. H. Phan, and H. Srikanth, Phys. Rev. B 86, 014426 (2012).
- Jönsson et al. (2004) P. Jönsson, J. L. J.L García-Palacios, M. F. Hansen, and P. Nordblad, J. Mol. Liq. 114, 131 (2004).
- Tadic et al. (2009) M. Tadic, V. Kusigerski, D. Markovic, I. Milosevic, and V. Spasojevic, J. Magn. Magn. Mater. 321, 12 (2009).
- Jönsson and García-Palacios (2001) P. E. Jönsson and J. L. García-Palacios, Phys. Rev. B 64, 174416 (2001).
- Lee et al. (2012) J. B. Lee, W. G. Hong, H. J. Kim, Z. Jaglicic, S. Jazbec, M. Wencka, A. Jelen, and J. Dolinsek, Phys. Rev. B 86, 224407 (2012).
- Sahoo et al. (2002) S. Sahoo, O. Petracic, C. Binek, W. Kleemann, J. B. Sousa, S. Cardoso, and P. P. Freitas, Phys. Rev. B 65, 134406 (2002).
- Mørup et al. (2010) S. Mørup, M. F. Hansen, and C. Frandsen, Beilstein J. Nanotech. 1, 182 (2010).
- Zysler et al. (2003) R. Zysler, H. Romero, C. Ramos, E. Biasi, and D. Fiorani, J. Magn. Magn. Mater. 266, 233 (2003).
- Thota and Kumar (2007) S. Thota and J. Kumar, J. Phys. Chem. Solids 68, 1951 (2007).
- Winkler et al. (2005) E. Winkler, R. D. Zysler, M. Vasquez Mansilla, and D. Fiorani, Phys. Rev. B 72, 132409 (2005).
- Winkler et al. (2008) E. Winkler, R. D. Zysler, M. V. Mansilla, D. Fiorani, D. Rinaldi, M. Vasilakaki, and K. N. Trohidou, Nanotechnology 19, 185702 (2008).
- De Biasi et al. (2005) E. De Biasi, R. D. Zysler, C. A. Ramos, H. Romero, and D. Fiorani, Phys. Rev. B 71, 104408 (2005).
- Jamet et al. (2001) M. Jamet, M. Négrier, V. Dupuis, J. Tuaillon-Combes, P. Mélinon, A. Pérez, W. Wernsdorfer, B. Barbara, and B. Baguenard, J. Magn. Magn. Mater. 237, 293 (2001).
- De Toro et al. (1999) J. A. De Toro, M. A. López de la Torre, J. M. Riveiro, R. Sáez Puche, A. Gómez-Herrero, and L. C. Otero-Díaz, Phys. Rev. B 60, 12918 (1999).
- Ambrose and Chien (1996) T. Ambrose and C. L. Chien, Phys. Rev. Lett. 76, 1743 (1996).
- Arrott (1985) A. S. Arrott, Phys. Rev. B 31, 2851 (1985).
- Rechtin et al. (1970) M. D. Rechtin, S. C. Moss, and B. L. Averbach, Phys. Rev. Lett. 24, 1485 (1970).
- Golosovsky et al. (2006) I. Golosovsky, I. Mirebeau, G. André, M. Tovar, D. Tobbens, D. Kurdyukov, and Y. Kumzerov, Phys. Solid State 48, 2130 (2006).
- Tiwari and Rajeev (2005) S. D. Tiwari and K. P. Rajeev, Phys. Rev. B 72, 104433 (2005).
- Wang and Zeng (2009) J. Wang and X. Zeng, in Nanoscale Magnetic Materials and Applications, edited by J. P. Liu, E. Fullerton, O. Gutfleisch, and D. Sellmyer (Springer US, 2009) pp. 35–65.
- Punnoose et al. (2001) A. Punnoose, H. Magnone, M. S. Seehra, and J. Bonevich, Phys. Rev. B 64, 174420 (2001).
- Singh et al. (2010) V. Singh, V. Srinivas, M. Ranot, S. Angappane, and J.-G. Park, Phys. Rev. B 82, 054417 (2010).
- Rall and Seehra (2012) J. D. Rall and M. S. Seehra, Journal of Physics: Condensed Matter 24, 076002 (2012).
- Akamatsu et al. (2006) H. Akamatsu, K. Tanaka, K. Fujita, and S. Murai, Phys. Rev. B 74, 012411 (2006).
- Punnoose et al. (2005) A. Punnoose, M. Seehra, J. van Tol, and L. Brunel, Journal of Magnetism and Magnetic Materials 288, 168 (2005).
- Zhang et al. (2003) L. Zhang, D. Xue, and C. Gao, J. Magn. Magn. Mater. 267, 111 (2003).
- Silva et al. (2010) N. J. O. Silva, A. Millán, F. Palacio, M. Martins, T. Trindade, I. Puente-Orench, and J. Campo, Phys. Rev. B 82, 094433 (2010).
- Gubin and Koksharov (2002) S. Gubin and Y. Koksharov, Inorg. Mater. 38, 1085 (2002).
- Tombs and Rooksby (1950) N. C. Tombs and H. P. Rooksby, Nature 165, 442 (1950).
- Rechtin and Averbach (1971) M. D. Rechtin and B. L. Averbach, Phys. Rev. Lett. 26, 1483 (1971).
- Silinsky and Seehra (1981) P. S. Silinsky and M. S. Seehra, Phys. Rev. B 24, 419 (1981).
- Carpenter et al. (1999) E. Carpenter, C. Sangregorio, and C. O’Connor, IEEE Trans. Magn. 35, 3496 (1999).
- Lin et al. (2001) J. Lin, W. Zhou, A. Kumbhar, J. Wiemann, J. Fang, E. Carpenter, and C. O’Connor, J. Solid State Chem. 159, 26 (2001).
- Lee and Choi (2003) J.-K. Lee and S.-M. Choi, Bull. Korean Chem. Soc. 24, 32 (2003).
- Hammersley et al. (1996) A. P. Hammersley, S. O. Svensson, M. Hanfland, A. N. Fitch, and D. Hausermann, High Pressure Res. 14, 235 (1996).
- Klementev (2001) K. V. Klementev, J. Phys. D: Appl. Phys. 34, 209 (2001).
- Saksl et al. (2007) K. Saksl, J. Bednarčík, R. Nicula, E. Burkel, S. Roth, and H. Franz, J. Phys.: Condens. Matter 19, 176215 (2007).
- Klementiev and freeware (2013) K. V. Klementiev and freeware, VIPER: Visual Processing in EXAFS Researches (2013), http://www.cells.es/ Beamlines/CLAESS/software/viper.html .
- Ankudinov et al. (1998) A. L. Ankudinov, B. Ravel, J. J. Rehr, and S. D. Conradson, Phys. Rev. B 58, 7565 (1998).
- Park and Cheon (2001) J.-I. Park and J. Cheon, J. Am. Chem. Soc. 123, 5743 (2001).
- Carpenter (2001) E. E. Carpenter, Journal of Magnetism and Magnetic Materials 225, 17 (2001).
- Park et al. (2004) J.-I. Park, M. G. Kim, Y.-w. Jun, J. S. Lee, W.-r. Lee, and J. Cheon, Journal of the American Chemical Society 126, 9072 (2004).
- Scherrer (1918) P. Scherrer, Göttinger Nachrichten Gesell. 2, 98 (1918).
- Cheng et al. (2004) G. Cheng, J. D. Carter, and T. Guo, Chem. Phys. Lett. 400, 122 (2004).
- Dutta et al. (2009) P. Dutta, S. Pal, M. S. Seehra, N. Shah, and G. P. Huffman, Journal of Applied Physics 105, 07B501 (2009).
- Makhlouf et al. (1997) S. A. Makhlouf, F. T. Parker, and A. E. Berkowitz, Phys. Rev. B 55, R14717 (1997).
- Seehra et al. (2000) M. S. Seehra, V. S. Babu, A. Manivannan, and J. W. Lynn, Phys. Rev. B 61, 3513 (2000).
- Seehra and Punnoose (2001) M. S. Seehra and A. Punnoose, Phys. Rev. B 64, 132410 (2001).
- Punnoose et al. (2004) A. Punnoose, T. Phanthavady, M. S. Seehra, N. Shah, and G. P. Huffman, Phys. Rev. B 69, 054425 (2004).
- Kim et al. (2001) D. Kim, Y. Zhang, W. Voit, K. Rao, and M. Muhammed, J. Magn. Magn. Mater. 225, 30 (2001).
- Fonseca et al. (2002) F. C. Fonseca, G. F. Goya, R. F. Jardim, R. Muccillo, N. L. V. Carreño, E. Longo, and E. R. Leite, Phys. Rev. B 66, 104406 (2002).
- Bragg and Seehra (1973) E. E. Bragg and M. S. Seehra, Phys. Rev. B 7, 4197 (1973).
- Dutta et al. (2008) P. Dutta, M. S. Seehra, S. Thota, and J. Kumar, Journal of Physics: Condensed Matter 20, 015218 (2008).
- Mydosh (1994) J. A. Mydosh, Spin Glasses: An Experimental Introduction (Taylor & Francis, London, 1994) pp. 66 – 67.
- Goya and Morales (2004) G. F. Goya and M. P. Morales, J. Meta. Nanocryst. Mater. 20-21, 673 (2004).
- Peddis et al. (2012) D. Peddis, D. Rinaldi, G. Ennas, A. Scano, E. Agostinelli, and D. Fiorani, Phys. Chem. Chem. Phys. 14, 3162 (2012).
- Vázquez-Vázquez et al. (2011) C. Vázquez-Vázquez, M. López-Quintela, M. Bujáán-Núúñez, and J. Rivas, J. Nanopart. Res. 13, 1663 (2011).
- Luis et al. (2006) F. Luis, F. Bartolomé, F. Petroff, J. Bartolomé, L. M. García, C. Deranlot, H. Jaffrès, M. J. Martínez, P. Bencok, F. Wilhelm, A. Rogalev, and N. B. Brookes, Europhys. Lett. 76, 142 (2006).
- Singh et al. (2009) V. Singh, M. S. Seehra, and J. Bonevich, Journal of Applied Physics 105, 07B518 (2009).
- De Toro et al. (2012) J. A. De Toro, J. A. González, P. S. Normile, P. Muñiz, J. P. Andrés, R. López Antón, J. Canales-Vázquez, and J. M. Riveiro, Phys. Rev. B 85, 054429 (2012).
- Djurberg et al. (1997) C. Djurberg, P. Svedlindh, P. Nordblad, M. F. Hansen, F. Bødker, and S. Mørup, Phys. Rev. Lett. 79, 5154 (1997).
- Petracic et al. (2006) O. Petracic, X. Chen, S. Bedanta, W. Kleemann, S. Sahoo, S. Cardoso, and P. Freitas, J. Magn. Magn. Mater. 300, 192 (2006).
- Gunnarsson et al. (1992) K. Gunnarsson, P. Svedlindh, J.-O. Andersson, P. Nordblad, L. Lundgren, H. Aruga Katori, and A. Ito, Phys. Rev. B 46, 8227 (1992).
- Wu and Leighton (2003) J. Wu and C. Leighton, Phys. Rev. B 67, 174408 (2003).