Reducing pervasive false positive identical-by-descent segments detected by large-scale pedigree analysis
Eric Y. Durand1,†, Nicholas Eriksson1, Cory Y. McLean1,†
23andMe, Inc., Mountain View, CA, USA
These authors contributed equally to this work.
Corresponding author: Cory Y. McLean, cmclean@23andme.com
Abstract
Analysis of genomic segments shared identical-by-descent (IBD) between individuals is fundamental to many genetic applications, from demographic inference to estimating the heritability of diseases, but IBD detection accuracy in non-simulated data is largely unknown. In principle, it can be evaluated using known pedigrees, as IBD segments are by definition inherited without recombination down a family tree. We extracted 25,432 genotyped European individuals containing 2,952 father-mother-child trios from the 23andMe, Inc. dataset. We then used GERMLINE, a widely used IBD detection method, to detect IBD segments within this cohort. Exploiting known familial relationships, we identified a false positive rate over 67% for 2–4 centiMorgan (cM) segments, in sharp contrast with accuracies reported in simulated data at these sizes. Nearly all false positives arose from the allowance of haplotype switch errors when detecting IBD, a necessity for retrieving long ( cM) segments in the presence of imperfect phasing. We introduce HaploScore, a novel, computationally efficient metric that scores IBD segments proportional to the number of switch errors they contain. Applying HaploScore filtering to the IBD data at a precision of 0.8 produced a 13-fold increase in recall when compared to length-based filtering. We replicate the false IBD findings and demonstrate the generalizability of HaploScore to alternative data sources using an independent cohort of 555 European individuals from the 1000 Genomes project. HaploScore can improve the accuracy of segments reported by any IBD detection method, provided that estimates of the genotyping error rate and switch error rate are available.
Introduction
IBD segments are regions of DNA between two individuals that were inherited from a recent shared common ancestor. IBD segments can be detected on high-density genetic data such as that produced by genome-wide genotyping arrays or whole genome sequencing.
Detecting the presence and distribution of IBD segments between individuals is fundamental to many genetic applications 1. Long-range phasing 2 uses IBD segments to resolve haplotype phasing inaccuracies. IBD segments have been used to identify disease genes 3, 4, 5 and estimate the heritability of traits and common diseases 6, 7. The lengths and distribution of IBD segments within and across populations have been used to infer demographic history 8, 9, 10 and identify regions under natural selection 11, 12.
All methods for IBD detection ultimately try to detect a similarity between haplotypes that is statistically unlikely to occur in the absence of IBD sharing. Hidden Markov models have been used extensively for probabilistic IBD segment detection 13, 11, 14, 15, 16, 17, 12. However, these methods scale quadratically with input sample sizes and are thus not suitable for IBD detection in population-scale datasets (reviewed in 1). Non-probabilistic IBD detection methods use a “hash-and-extend” methodology that is conceptually similar to BLAST 18: identical or nearly identical short haplotype match “seeds” are detected efficiently and the seeds are extended to adjacent sites subject to heuristic constraints. These non-probabilistic methods have the advantage that they are able to scale to much larger datasets than probabilistic methods. Implementations include GERMLINE 19, 9, fastIBD 20, and RefinedIBD 21. GERMLINE and RefinedIBD use short windows of sites as seeds, whereas fastIBD uses small segments of the inferred haplotype graph as seeds.
These three methods differ in the way that detected candidate segments are chosen to be kept as true IBD segments: fastIBD uses haplotype frequency, RefinedIBD uses a combination of segment genetic length and a likelihood ratio test, and GERMLINE uses segment length. The probabilistic refinement methods of fastIBD and RefinedIBD require a haplotype graph to be generated. Consequently, both fastIBD and RefinedIBD perform haplotype phasing in addition to IBD detection. Haplotype phasing has superlinear computational complexity 22. Current computer memory capacity constraints limit the number of individuals who can be phased together to tens of thousands of individuals. Thus, computing all pairwise IBD requires splitting the cohort into multiple smaller batches, all of which must be compared to each other, each time being phased anew. This makes the detection of all pairwise IBD segments in a cohort of over 100,000 individuals computationally infeasible using these methods. Since GERMLINE uses segment length to refine IBD segments, it does not perform genotype phasing. Consequently, detection of all pairwise IBD segments can be performed on large cohorts by phasing each individual once and then using GERMLINE to detect IBD.
IBD detection accuracy is typically assessed on simulated data, as true IBD segments can then be known precisely 11, 23, 19, 21. However, accurate simulation of population demography is difficult 1, and simulation parameters directly affect the estimated precision and recall of IBD detection algorithms. With a large number of father-mother-child trios, IBD detection accuracy can be estimated on non-simulated data by examining concordance between reported IBD segments in the child and his or her parents.
In this work, we analyze the accuracy of IBD segments reported by GERMLINE since its decoupling of phasing and IBD detection make it feasible for IBD detection on population-scale datasets. We use a large cohort of trios to assess IBD segment accuracy on non-simulated data. We perform a detailed examination of discrepant segments and present a method that substantially improves accuracy while remaining computationally tractable for population-scale datasets. Finally, we replicate the findings using an independent cohort of individuals from the 1000 Genomes project.
Results
Non-simulated data show substantial inaccuracy in short reported IBD segments
To analyze IBD detection accuracy on non-simulated data, we examined IBD segments detected in a cohort of 25,432 individuals of European ancestry that includes 2,952 distinct father-mother-child trios (the “23andMe cohort”, Material and Methods). By focusing specifically on segments reported between a trio child and an individual who is not a parent of that child (henceforth called “child-other” segments), IBD accuracy can be quantified: by the definition of IBD, if a child-other segment is true, at least one of the child’s parents must also share a segment IBD with the individual (henceforth called “parent-other” segments) that encompasses the child-other segment.
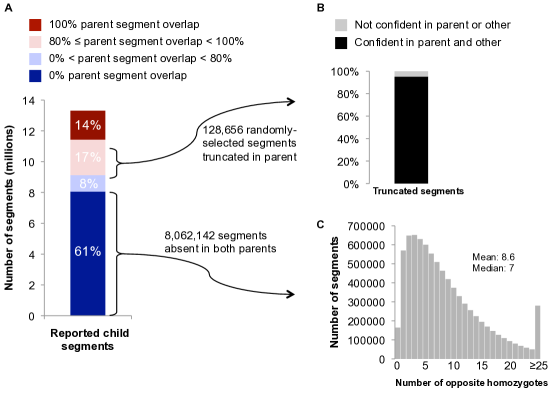
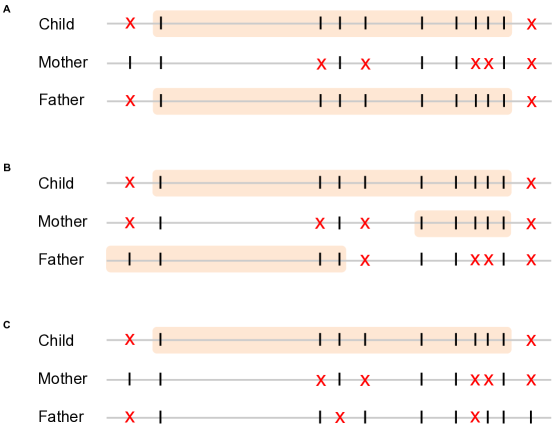
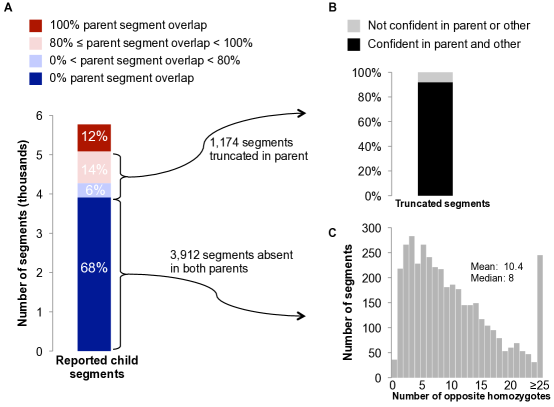
GERMLINE reported a total of 18,125,797 child-other segments in the 23andMe cohort on chromosome 21. After filtering artifactual IBD segments reported in regions of low site density, 13,307,562 child-other segments were retained for analysis. Only 14% of these child-other segments were encompassed by a parent-other segment (Figure 1A, Supplementary Figure S1A). Another 25% of child-other segments have a partial parent-other segment in which at least one segment end is truncated (Figure 1A, Supplementary Figure S1B). Segment ends imply the presence of opposite homozygote genotypes between the individuals. Opposite homozygote sites that terminate a parent-other segment exclude the possibility of child-other IBD at those sites. To determine whether truncated segment ends represented false child-other IBD or genotyping error in parent-other regions, Illumina GenCall scores were examined at the opposite homozygote sites truncating 128,656 randomly selected partial parent-other segments. Considering GenCall scores of as confident genotype calls 24, over 95% of opposite homozygote sites analyzed (122,364/128,656) have confident genotype calls in both the parent and other individual. This result indicates that the vast majority of disagreements between child-other and parent-other segments represent false positive IBD in the child rather than false negative IBD in the parent (Figure 1B).
The remaining 61% of child-other segments have no corresponding parent-other segment (Figure 1A, Supplementary Figure S1C). All segments in this subset were analyzed to determine whether they represented false positive child-other segments or false negative parent-other segments by examining the number of parent-other opposite homozygote sites in the region. Nearly 98% of these child-other segments have at least one opposite homozygote site in the parent (Figure 1C). Given a 95% accuracy rate for parent-other opposite homozygote sites (Figure 1B), the probability that a region containing opposite homozygote sites is actually a false negative parent-other IBD segment was calculated as . The expected fraction of false negative parent-other segments in this subset is , and thus the fraction of false positive child-other segments in this subset is . This likely represents a conservative (i.e. low) estimate of false positive child-other segments for two reasons: the actual genotyping accuracy is much higher than the stringent confident genotype call threshold indicates, and segments with no opposite homozygote sites can still be not shared IBD.
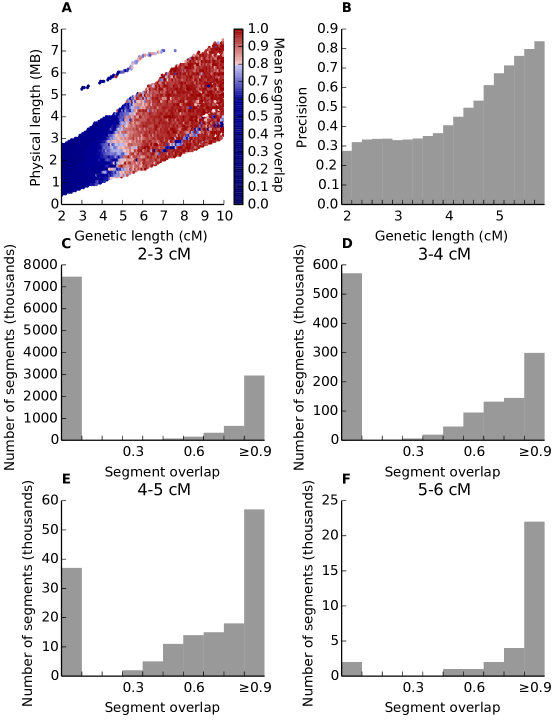
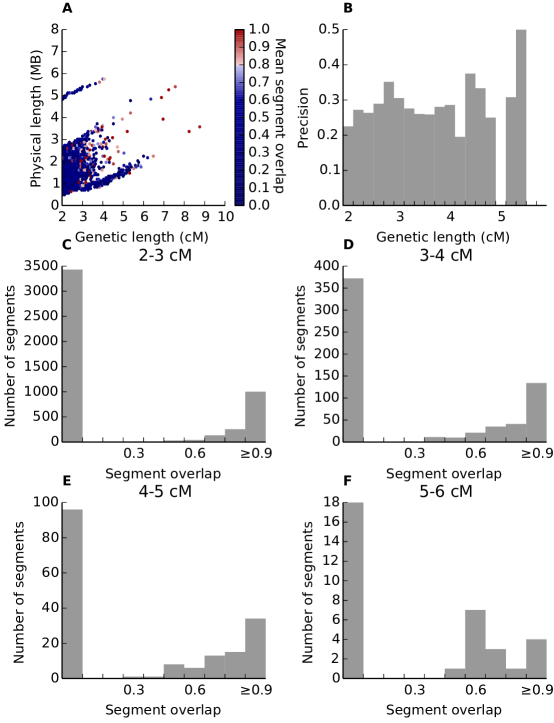
The unexpectedly small number of child-other segments that are fully spanned by a corresponding parent-other segment motivated an analysis of the relationship between segment length and segment overlap. Segment overlap between parent and child was calculated based on the fraction of sites in the child-other segment (Supplementary Figure S1). Segments were segregated by genetic and physical lengths and the average segment overlap of all segments in each bin was calculated (Figure 2A). Genetic length is a more reliable indicator of average segment overlap than physical length and segments longer than 6 cM generally show a high degree of overlap. However, the average overlap drops rapidly as segment length is reduced (Figure 2A).
IBD accuracy was estimated by considering child-other segments with substantial parent-other segment overlap as true IBD. Because precise determination of IBD endpoints from genotype data is difficult 21, a threshold of 80% segment overlap was used to classify a segment as true IBD. Using this criterion, more than 67% of all reported segments shorter than 4 cM are false positive child segments (Figure 2B). Figure 2C–F show the IBD segment overlap distributions segregated by genetic length. Most 2–3 cM segments are erroneous (Figure 2C), and only segments longer than 5 cM have a negligible number of false positives (Figure 2F). Indeed, when filtering solely by genetic length, all segments shorter than 5 cM must be discarded in order to achieve a precision value of (Supplementary Figure S2). However, because there are many more short segments, eliminating all segments shorter than 5 cM eliminates 99% of all true IBD segments, a dramatic loss in recall (Supplementary Figure S2). In the next section, we investigate the properties of true IBD segments of all lengths, and contrast them with erroneous segments.
Overly permissive diplotype matching causes reported segment inaccuracy
IBD segments are shared between two individual haplotypes. Thus, if the phase of each individual genotype was known, IBD detection algorithms could in principle analyze each individual haplotype independently. However, for individuals without a genotyped pedigree, genotypes have to be phased statistically, where switch errors occur at an appreciable frequency (Supplementary Figure S4). Examination of only haplotypes in the presence of switch errors is known to reduce power to detect IBD, especially for long segments 21, since they are likely to harbor more switch errors than short segments. Thus, GERMLINE (and many other IBD detection methods) matches IBD segments between individual diplotypes, trying to allow for a moderate number of switches between individuals’ haplotypes. In practice, this is achieved by allowing haplotype match seeds to extend until an opposite homozygous site is met. There are two potential issues with this approach that could lead to inconsistent segment reporting between parent and child and are explored further below.
Detection of child-other segments with a truncated or absent corresponding parent-other segment could arise from the haplotype matching between the child and the other individual, but a switch error in the parent causing the corresponding haplotype to not match between the parent and the other individual. To investigate this potential error source, all 2,952 trios were trio-phased using the laws of Mendelian inheritance and then IBD detection was performed as before. Trio-phasing ensures that children and parents are phased essentially perfectly (i.e., up to recombination events), eliminating haplotype discrepancies between parent and child as a source of segment discrepancies. The number and accuracy of child-other segments using trio-phased data is nearly identical to that of BEAGLE-phased data, showing that parent-child haplotype discrepancies contribute a negligible amount toward discrepant segments (Supplementary Figure S5).
Alternatively, child-other segments with no corresponding parent-other segment could be false reported IBD between the child and the other individual due to overly permissive diplotype matching. To examine this possibility, each full 100-site window in all 13,307,562 child-other segments was analyzed (63,542,380 total windows) to see whether the window satisfied the diplotype match criterion and the haplotype match criterion between the child and the other individual and between the parent and the other individual. The analysis was segregated by windows contained within corresponding parent-other segments (likely true IBD) and windows that are not contained within corresponding parent-other segments (false IBD). The diplotype match criterion is satisfied in the child in 97.6% of windows contained within parent-other segments (Table 1A) and in 97.5% of windows not contained within parent-other segments (Table 1B). Roughly 67.7% of windows contained within both child-other and parent-other segments satisfy the haplotype match criterion for IBD in the child (Table 1A), consistent with true IBD given the window size and empirical switch error rate (Supplementary Figure S4). In contrast, only 44.2% of windows not contained within a parent-other segment satisfy the haplotype match criterion for IBD in the child (Table 1B), a substantial reduction (binomial ).
The poor precision in short segments is thus due to the allowance of diplotype-only matches within the IBD detection algorithm. However, allowing diplotype-only matches is necessary for detection of long segments due to imperfect haplotype phasing 9. The substantial reduction in windows matching haplotypes in regions of false IBD suggests a haplotype-based metric that is robust to switch errors could improve precision of reported IBD without the loss of recall incurred by haplotype-only IBD detection mechanisms.
A haplotype-based metric to identify true IBD segments
IBD is fundamentally a property of haplotypes, not diplotypes. Consequently, true IBD should appear consistent with haplotype matches, modulo expected genotyping and switch errors. We introduce HaploScore as a measure of haplotype IBD likelihood: given a genotyping error rate per site and a switch error rate per site , the HaploScore for a candidate IBD segment is
where is the number of genotyped sites in and and are the number of genotyping and switch errors, respectively, that together minimize the score while reconciling the segment as matching across a single haplotype in both individuals. Conceptually, HaploScore is a measure of the ratio of observed and expected genotyping and switch errors. In segments falsely reported as IBD, a larger-than-expected number of genotyping and switch errors may be required to reconcile the segments as matching across individual haplotypes, and their HaploScores will be large.
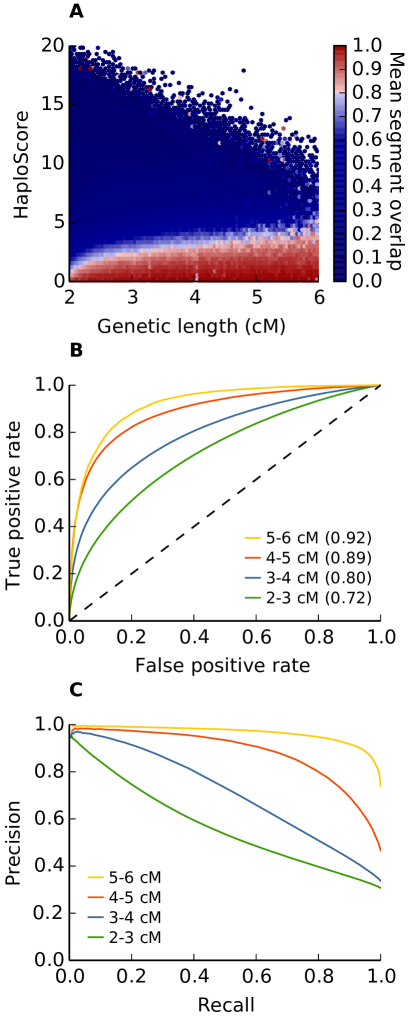
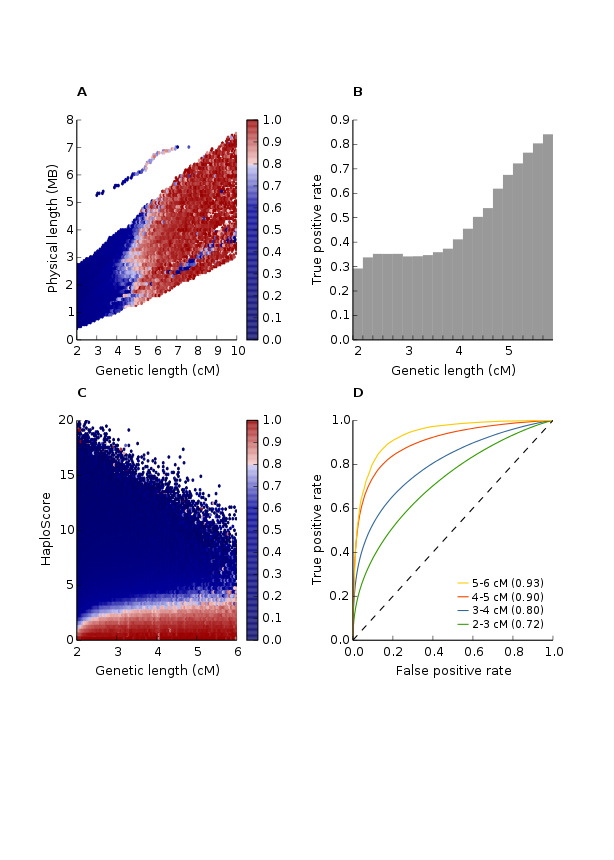
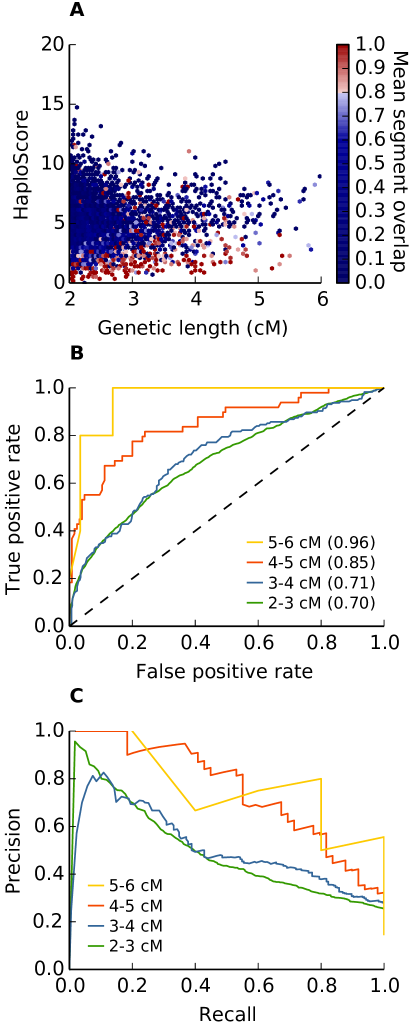
Genotyping and switch error rates per site were estimated from the data to be and (Material and Methods). Using those parameters, HaploScore was calculated on all segments shorter than 6 cM. To investigate whether HaploScore behaves differently between true and false IBD, we plotted a heat map of IBD segment overlap as a function of segment genetic length and HaploScore values. HaploScore effectively discriminates true and false IBD segments at all lengths (Figure 3A). Indeed, the relationship between HaploScore and mean segment overlap is nearly monotonic, drawing a clear boundary between segments with at least 80% overlap and others at all genetic lengths.
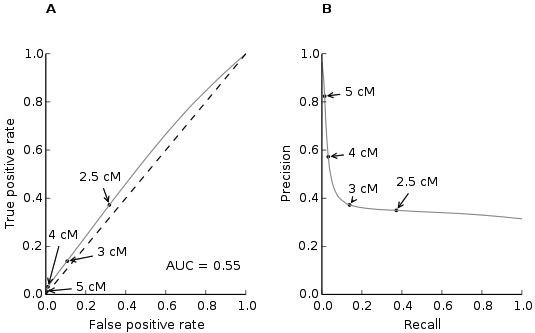
In addition, we assessed the power of HaploScore as a binary classifier to decide if an IBD segment is true. We varied a HaploScore threshold from 0 to 22 (the maximum observed HaploScore value on chromosome 21), and classified segments with a HaploScore value smaller than the threshold as true IBD. We then computed the true positive and false positive rates at each HaploScore threshold. HaploScore performed well as a binary classifier at all genetic lengths, achieving an area under the receiver operating characteristic curve (AUC) greater than for segments longer than 3 cM (Figure 3B). At all levels of precision, power increased as segment length increased, owing at least in part to the general positive correlation between segment length and number of sites in the segment. Importantly, and in sharp contrast with length-based filtering (Supplementary Figure S2), HaploScore-based filtering retains many segments shorter than 5 cM at a precision of (Figure 3C). Recall of HaploScore-based filtering at precision is , a 13-fold increase compared to length-based filtering.
Robustness of results to HaploScore parameter variation
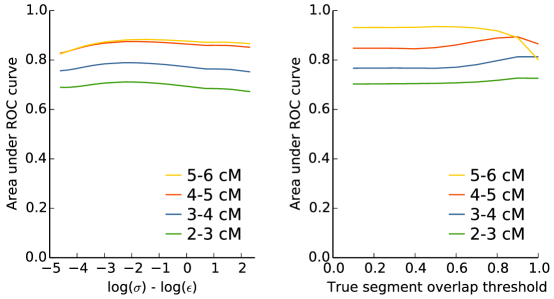
HaploScore is a function of two parameters: the genotyping error rate and the switch error rate . However, only the ratio of the two parameters affects the behavior of the score. In order to assess the robustness of HaploScore to varying parameters, a grid search was performed in which was fixed at , was varied three orders of magnitude from to , and the AUC was computed at each grid point (Figure 4A). As expected, performance was strongest when the ratio of the parameters was near its true value. However, the performance degradation was modest across the wide range of parameter ratio values examined, with the AUC dropping by less than 2% at worst.
Robustness of results to true IBD definition
In all analyses above, true IBD segments were defined as child-other segments that have at least 80% parent-other segment overlap. To assess the robustness of HaploScore to different true IBD definitions, a grid search was performed in which the definition of true IBD was varied from 10% to 100% parent-other segment overlap in increments of 10%. The AUC was computed at each grid point (Figure 4B). Performance was generally stable for all segment lengths and true IBD definitions, with the exception of 5–6 cM segments at 100% overlap, where performance degraded appreciably. This is likely due at least in part to the inherent bias for longer segments to have more sites at which premature truncation of detected IBD segments can arise from genotyping or switch errors.
Robustness of results to genome-wide IBD identification
To confirm that the results presented are not due to particular genomic features of chromosome 21, chromosome 10 was analyzed on the full cohort using the same parameters (, , 80% segment overlap defined true IBD). The results were qualitatively similar to chromosome 21, showing that the HaploScore methodology is extensible genome-wide (Supplementary Figure S6). In addition, IBD segments were examined on all autosomes in the subset of all individuals comprising the 2,952 unrelated trios. No substantial deviations in performance were observed (not shown).
Filtering spurious reported IBD segments using HaploScore
HaploScore can be used to filter out spurious segments reported by an IBD detection algorithm as an efficient post-processing step. The reduced power to detect short segments requires more stringent HaploScore threshold values for shorter segments to achieve a similar precision value as for longer segments (Figure 3). Since HaploScore provides a way to rank segments, the trade-off between precision and recall can be tuned to the needs of the particular downstream application.
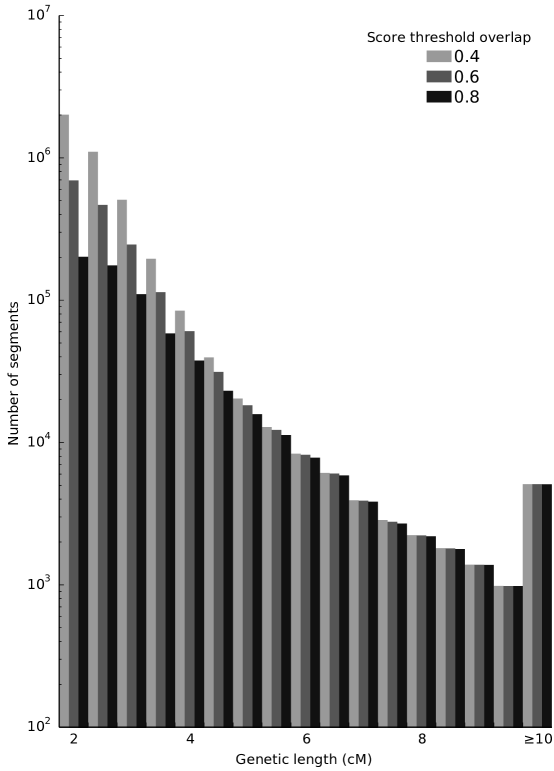
HaploScore threshold values to ensure particular average overlap values of resultant segments were generated (see Material and Methods) and three separate filtering results are shown in Figure 5. Notably, more stringent filtering parameters have the largest effect on short segments and have nearly the same effect as lenient filtering parameters for segments over 5 cM (Figure 5). This result is intuitive, as the short reported segments are enriched for false positives (Figure 2C–F).
Robustness of results to alternate individuals and genotyping platforms
To assess the robustness of the findings in an alternative population, a cohort of 555 European individuals including 52 father-mother-child trios genotyped as part of the 1000 Genomes project 25 were analyzed (the “1000 Genomes cohort”, Supplementary Table S1). Individuals in the 1000 Genomes cohort were genotyped on the Illumina HumanOmni2.5-Quad v1-0 B SNP array and as such provide an independent sample set from which to assess the generalizability of our results to additional individuals and alternative genotyping platforms.
GERMLINE reported a total of 6,585 child-other segments on chromosome 21 in the 1000 Genomes cohort. After filtering artifactual IBD segments reported in regions of low site density, 5,770 child-other segments were retained for analysis. The number of child-other segments detected in the 1000 Genomes cohort is much smaller than in the 23andMe cohort (5,770 versus 13,307,562 candidate segments) since the 1000 Genomes cohort is much smaller. However, the rate of candidate segment detection is similar: in the 1000 Genomes cohort, there are 5,770 segments for child-other pairs, resulting in an average of child-other segments per trio. In the 23andMe cohort, the corresponding rate is child-other segments per trio.
Analyses of child-other segments detected in the 1000 Genomes cohort were performed analogously to those in the 23andMe cohort. Only 12% of child-other segments were encompassed by a parent-other segment, 20% of child-other segments have a partial parent-other segment in which at least one segment end is truncated, and the remaining 68% of child-other segments have no corresponding parent-other segment (Supplementary Figure S7A). Analysis of truncated segments in the 1000 Genomes cohort also strongly suggests that false child-other IBD accounts for most discrepant segments, as 92% of opposite homozygote sites that truncate the 1,174 truncated segments have confident genotype calls in both the parent and other individual (Supplementary Figure S7B). Finally, in the 68% of child-other segments that have no corresponding parent-other segment, over 99% contain at least one opposite homozygote site in the parent (Supplementary Figure S7C). Taken together, these results show that the 1000 Genomes cohort is also rife with false positive IBD, and despite the different genotyping platform used, the error profile in the 1000 Genomes cohort is qualitatively very similar to that in the 23andMe cohort (Figure 1).
Examination of the relationship between segment length and segment overlap in the 1000 Genomes cohort indicates similar general trends as those discovered in the 23andMe cohort (compare Supplementary Figure S8 and Figure 2), though the smaller number of segments makes the results more noisy. Comparison of all 44,542 full 100-site windows in the 5,770 child-other segments shows that overly permissive diplotype matching causes false reported IBD segments: the diplotype match criterion is satisfied in 97.1% of windows contained within parent-other segments and in 96.5% of windows not contained within parent-other segments, whereas the haplotype match criterion is satisfied in 68.7% of windows contained within parent-other segments but in only 51.1% of windows not contained within parent-other segments (Supplementary Table S2), a substantial reduction (binomial ).
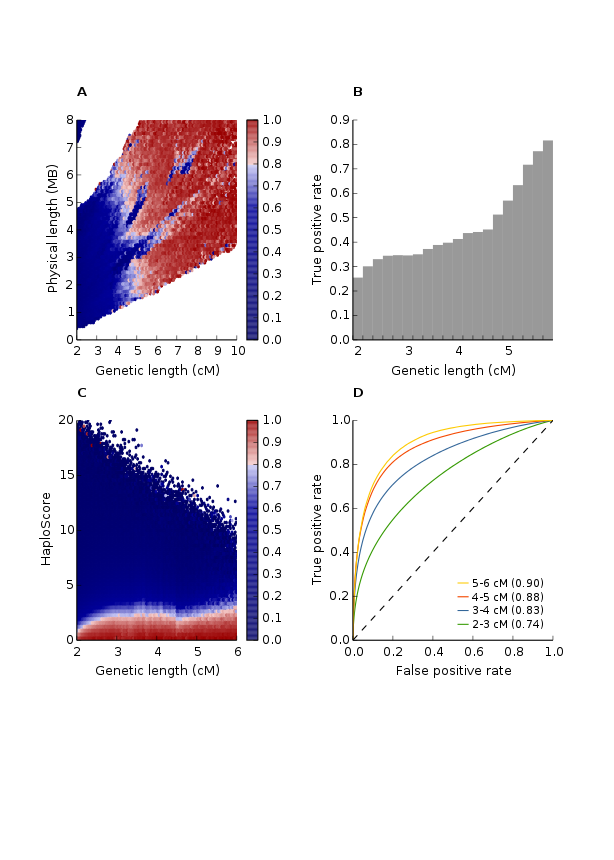
Finally, the performance of HaploScore in segregating true and false reported IBD was analyzed in the 1000 Genomes cohort. The switch error rate was estimated from the data to be and the genotyping error rate was estimated to be . Similar trends are present in the 1000 Genomes cohort as are in the 23andMe cohort (compare Supplementary Figure S9 and Figure 3). The small number of child-other segments analyzed in the 1000 Genomes cohort causes somewhat noisy results, but the effectiveness of HaploScore as a discriminator between true and false positive IBD is readily apparent.
Discussion
The usage of IBD segments in genetic analyses will become increasingly common as the number of individuals with their genetic composition known increases. Due to the inherently quadratic nature of IBD detection between all pairs of individuals in a cohort, non-probabilistic methods are required to keep the computational burden as low as possible. However, effective filtering methods are required to ensure reported IBD segments are accurate.
Using the laws of Mendelian inheritance is an effective way to avoid modeling complex demographic history when evaluating the accuracy of population genetics methods including IBD detection and local ancestry inference 26. By using known familial relationships in a large set of trios, we were able to analyze the accuracy of IBD segments reported by GERMLINE on non-simulated data. We found a surprisingly large number of false positive short segments and showed that these false positives arose due to the diplotype-based IBD detection mechanism introduced to detect long IBD segments in the presence of phasing switch errors 9. We introduced a haplotype-based metric, HaploScore, that effectively discriminates between true and false reported IBD segments. We also investigated a likelihood-ratio-based metric, but found it less effective than HaploScore (Supplementary Text).
Importantly, HaploScore can be computed efficiently using dynamic programming (in O time per segment, see Material and Methods). This suggests a strategy for accurate IBD detection in population-scale datasets: detect candidate segments using a non-probabilistic IBD detection method with relatively permissive parameters and then cull true segments using HaploScore filtering. In addition, HaploScore can be applied as a post-processing step to existing genotyping- and sequencing-based IBD segments, provided that an estimate of the switch error rate and the genotyping error rate are available.
Achieving optimal HaploScore performance in a different population cohort or when using an alternative genotyping platform depends on being able to accurately estimate the genotyping and switch error rates of the data. Genotyping error rates can be estimated in any cohort by methods such as repeat genotyping 27. While accurate determination of switch error rates currently requires trios or orthogonal analysis methods such as phased sequencing 28, the robustness of HaploScore to substantial variations in the parameter ratio indicates that it should be extensible to non-European populations, genotyping platforms of different marker density, or even sequencing-based assays. Indeed, we demonstrated the robustness and generalizability of HaploScore by analyzing an independent cohort of 555 European individuals from the 1000 Genomes project who were genotyped on a chip nearly twice as dense as the 23andMe chip. While the smaller sample size of the 1000 Genomes cohort produced noisier results, all major findings of the analysis of the 23andMe cohort were replicated in the 1000 Genomes cohort.
Python code implementing HaploScore filtering is freely available (https://github.com/23andMe/ibd).
Material and Methods
Cohort description
The 23andMe cohort analyzed comprises 25,432 customers of 23andMe, Inc., a personal genetics company, who were genotyped on the Illumina HumanOmniExpress+ BeadChip as part of the 23andMe Personal Genome Service. The chip contains roughly 1,000,000 sites genome-wide 29. Individuals were selected for having European ancestry as described previously 29. The 23andMe cohort includes 2,952 distinct father-mother-child trios identified by IBD sharing 30. Parent-child relationships were defined as having at least 85% of the genetic length of the genome shared on at least one haplotype and no more than 10% of the genetic length of the genome shared on both haplotypes. Parent-parent relationships were defined as having at most 20% of the genetic length of the genome shared on at least one haplotype.
The 1000 Genomes cohort analyzed comprises 555 individuals from five European populations who were genotyped on the Illumina HumanOmni2.5-Quad v1-0 B SNP array as described previously 25 (samples available at ftp://ftp-trace.ncbi.nih.gov/1000genomes/ftp/technical/working/20120131_omni_genotypes_and_intensities/Omni25_genotypes_2141_samples.b37.vcf.gz). The 1000 Genomes cohort includes 52 distinct father-mother-child trios identified within the 1000 Genomes project (metadata available at ftp://ftp-trace.ncbi.nih.gov/1000genomes/ftp/technical/working/20130606_sample_info/20130606_sample_info.txt) and which we validated independently by IBD sharing (Supplementary Table S1). All members of the 1000 Genomes cohort were verified to not be present in the 23andMe cohort.
IBD detection
The 23andMe cohort
Genotypes of all individuals included in the 23andMe cohort were phased using BEAGLE 31 version 3.3.1 in batches of 8,000–9,000 individuals as described previously 29. In each batch, we excluded sites with minor allele frequency , Hardy-Weinberg equilibrium , call rate , or large allele frequency discrepancies compared to the 1000 Genomes Project reference data. Input haplotypes were restricted to sites present in the intersection of all batch-filtered sites, and resulted in 12,881 sites on chromosome 21 and 48,372 sites on chromosome 10.
For each of the 2,952 trio children, candidate IBD segments were calculated between the child and all 25,429 other individuals who were not the parents of that child. For each of the 5,904 () trio parents, candidate IBD segments were calculated between the parent and all 25,430 other individuals who were not the child of that parent. All candidate IBD segments were calculated using the GERMLINE 19 algorithm with the parameters -bits 100 -err_hom 2 -err_het 0 -w_extend -min_m 2 -map <geneticmap>, corresponding to the empirical genotyping and switch error rates of the data (see HaploScore parameter estimation below). The genetic map used was generated by the Phase II HapMap 32 and lifted over to NCBI Build GRCh37 coordinates using the UCSC Genome Browser 33 liftOver tool (available at http://hapmap.ncbi.nlm.nih.gov/downloads/recombination/2011-01_phaseII_B37/genetic_map_HapMapII_GRCh37.tar.gz). To omit clearly artifactual candidate IBD segments arising from sequence assembly gaps and platform effects, candidate segments were filtered by site density 34. Segments with a site density (measured in sites/cM) in the lowest 10% of all 1 cM windows on the chromosome were omitted. All remaining candidate IBD segments were retained.
The 1000 Genomes cohort
Genotypes of all 555 individuals in the 1000 Genomes cohort were phased using BEAGLE 31 version 3.3.1 in a single batch. Windows of 3,000 sites that overlapped by 100 sites were stitched together as described previously 29. Sites that were not polymorphic in the 555 individuals examined, had a 1000-Genomes-reported Hardy-Weinberg equilibrium , or a call rate within the 555 individuals examined were excluded, resulting in 23,142 sites on chromosome 21. GenCall genotype scores were set to 0 for all sites not called in each individual.
Candidate IBD segments were identified and filtered identically to those found in the 23andMe cohort described above.
HaploScore description and computational complexity
HaploScore provides a metric by which to rank the likelihood that a stretch of DNA is inherited IBD between two individuals or not. Let and denote the probability of a genotyping error and a switch error at any given site, respectively. The HaploScore for a candidate IBD segment is
| (1) |
where is the number of genotyped sites in and and are the number of genotyping and switch errors, respectively, that together minimize the score while reconciling the segment as matching across a single haplotype in both individuals.
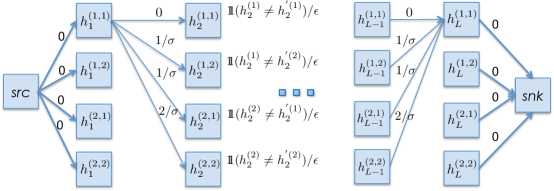
Finding the HaploScore (i.e. the optimal values of and subject to the constraints) can be viewed as finding the minimum-cost path through the directed acyclic graph (DAG) described below (Supplementary Figure S10).
Let be a DAG with a single source node and a single sink node. Between the source and the sink, the graph has levels, one per genotyped site in segment . Each of these levels has four nodes, one for each possible haplotype configuration. Each node in level has four outgoing directed edges, one to each node in level . Below, we use the same notation for nodes and their weights.
At any level , let , denote the four possible haplotype configurations of an IBD match. The nodes are weighted as follows:
| (2) |
Let denote the weight of the edge between nodes and . Edges are weighted as follows:
| (3) |
The weights of the four edges from the source node to the nodes in the first level, as well as the weights from the nodes in level to the sink node, are set to 0. The cost of a path in is defined as the sum of the weights of the edges and nodes it traverses.
HaploScore is equal to the smallest of all path costs from the source to the sink. It can be efficiently computed using dynamic programming by noting that the smallest cost from the source to level in the graph can easily be inferred from the smallest cost from the source to level . Let denote the smallest cost from the source to haplotype configuration at level . Then,
| (4) |
The minimum cost to reach level , , is then
| (5) |
The above equations clearly show that computing HaploScore involves 16 comparisons at each genotyped site in . Thus, the complexity of computing HaploScore is at most . Performance can be further improved when filtering by HaploScore by terminating computation as soon as a segment’s HaploScore becomes too high to satisfy the maximum value threshold.
HaploScore parameter estimation
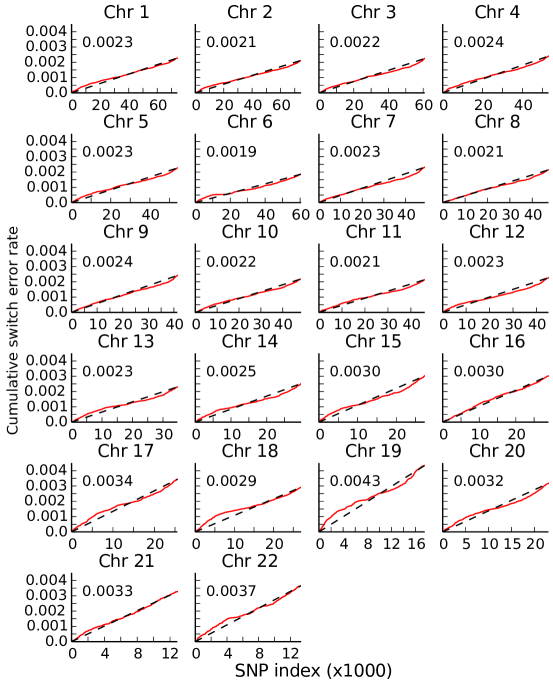
HaploScore uses two parameters, the genotyping error rate per site and the switch error rate per site . Analyses of genotyping chip accuracy 35 and internal comparisons between genotype and whole-genome sequencing data verify that the genotyping error rate is (not shown). To estimate the empirical switch error rate per site, all 2,952 trios in the 23andMe cohort were trio-phased using the laws of Mendelian inheritance and the results for all children were compared to their BEAGLE-phased haplotypes, assuming that the trio-phased haplotypes represented the true phase. The average per-site switch error rate ranged from (on chromosome 6) to (on chromosome 19) but deviated only modestly from a constant rate on each chromosome (Supplementary Figure S4).
The switch error rate calculation process described above was performed independently on the 1000 Genomes cohort. A total of 3,629 switch errors were detected in the 52 trio children over 23,142 sites. This corresponds to an individual switch error rate per site of .
HaploScore threshold matrix generation
A matrix of HaploScore thresholds was generated in the following manner: all segments were binned by genetic length in cM increments from cM to cM. In each length bin, segments were segregated by their segment overlap into equally-sized overlap bins. The score threshold in each overlap bin was initially set to be the average HaploScore of all segments within the bin. To ensure monotonicity, the score threshold was then taken to be the maximum of the scores in all bins of equal or higher overlap at that segment length. A file containing the maximum HaploScore value thresholds calculated for all genetic lengths and mean overlap values in the 23andMe cohort is available (Supplementary File 1).
Acknowledgments
We thank the customers of 23andMe who contributed the genetic data that made this research possible and are grateful to the employees of 23andMe for creating and supporting the resources necessary for this research. We also thank members of the 23andMe research team for insightful comments. This work was supported by the National Human Genome Research Institute of the National Institutes of Health (grant number R44HG006981).
References
- Browning & Browning 2012 Browning, S. R. & Browning, B. L. Identity by descent between distant relatives: detection and applications. Annual Review of Genetics 46, 617–633 (2012).
- Kong et al. 2008 Kong, A. et al. Detection of sharing by descent, long-range phasing and haplotype imputation. Nature Genetics 40, 1068–1075 (2008).
- Krawitz et al. 2010 Krawitz, P. M. et al. Identity-by-descent filtering of exome sequence data identifies PIGV mutations in hyperphosphatasia mental retardation syndrome. Nature Genetics 42, 827–829 (2010).
- Gusev et al. 2011 Gusev, A. et al. DASH: a method for identical-by-descent haplotype mapping uncovers association with recent variation. The American Journal of Human Genetics 88, 706–717 (2011).
- Jonsson et al. 2012 Jonsson, T. et al. A mutation in APP protects against Alzheimer’s disease and age-related cognitive decline. Nature 488, 96–99 (2012).
- Visscher et al. 2006 Visscher, P. M. et al. Assumption-free estimation of heritability from genome-wide identity-by-descent sharing between full siblings. PLOS Genetics 2, e41 (2006).
- Zuk et al. 2012 Zuk, O., Hechter, E., Sunyaev, S. R. & Lander, E. S. The mystery of missing heritability: genetic interactions create phantom heritability. Proceedings of the National Academy of Sciences of the United States of America 109, 1193–1198 (2012).
- Palamara et al. 2012 Palamara, P. F., Lencz, T., Darvasi, A. & Pe’er, I. Length distributions of identity by descent reveal fine-scale demographic history. The American Journal of Human Genetics 91, 809–822 (2012).
- Gusev et al. 2012 Gusev, A. et al. The architecture of long-range haplotypes shared within and across populations. Molecular Biology and Evolution 29, 473–486 (2012).
- Ralph & Coop 2013 Ralph, P. & Coop, G. The geography of recent genetic ancestry across Europe. PLOS Biology 11, e1001555 (2013).
- Albrechtsen et al. 2009 Albrechtsen, A. et al. Relatedness mapping and tracts of relatedness for genome-wide data in the presence of linkage disequilibrium. Genetic Epidemiology 33, 266–274 (2009).
- Han & Abney 2013 Han, L. & Abney, M. Using identity by descent estimation with dense genotype data to detect positive selection. European Journal of Human Genetics 21, 205–211 (2013).
- Purcell et al. 2007 Purcell, S. et al. PLINK: a tool set for whole-genome association and population-based linkage analyses. The American Journal of Human Genetics 81, 559–575 (2007).
- Browning & Browning 2010 Browning, S. R. & Browning, B. L. High-resolution detection of identity by descent in unrelated individuals. The American Journal of Human Genetics 86, 526–539 (2010).
- Han & Abney 2011 Han, L. & Abney, M. Identity by descent estimation with dense genome-wide genotype data. Genetic Epidemiology 35, 557–567 (2011).
- Palin et al. 2011 Palin, K., Campbell, H., Wright, A. F., Wilson, J. F. & Durbin, R. Identity-by-descent-based phasing and imputation in founder populations using graphical models. Genetic Epidemiology 35, 853–860 (2011).
- Brown et al. 2012 Brown, M. D., Glazner, C. G., Zheng, C. & Thompson, E. A. Inferring coancestry in population samples in the presence of linkage disequilibrium. Genetics 190, 1447–1460 (2012).
- Altschul et al. 1990 Altschul, S. F., Gish, W., Miller, W., Myers, E. W. & Lipman, D. J. Basic local alignment search tool. Journal of Molecular Biology 215, 403–410 (1990).
- Gusev et al. 2009 Gusev, A. et al. Whole population, genome-wide mapping of hidden relatedness. Genome Research 19, 318–326 (2009).
- Browning & Browning 2011 Browning, B. L. & Browning, S. R. A fast, powerful method for detecting identity by descent. The American Journal of Human Genetics 88, 173–182 (2011).
- Browning & Browning 2013 Browning, B. L. & Browning, S. R. Improving the accuracy and efficiency of identity-by-descent detection in population data. Genetics 194, 459–471 (2013).
- Williams et al. 2012 Williams, A. L., Patterson, N., Glessner, J., Hakonarson, H. & Reich, D. Phasing of many thousands of genotyped samples. The American Journal of Human Genetics 91, 238–251 (2012).
- Browning & Browning 2007a Browning, B. L. & Browning, S. R. Efficient multilocus association testing for whole genome association studies using localized haplotype clustering. Genetic Epidemiology 31, 365–375 (2007a).
- Fan et al. 2003 Fan, J.-B. et al. Highly parallel SNP genotyping. In Cold Spring Harbor Symposia on Quantitative Biology, vol. 68, 69–78 (Cold Spring Harbor Laboratory Press, 2003).
- 1000 Genomes Project Consortium 2012 1000 Genomes Project Consortium. An integrated map of genetic variation from 1,092 human genomes. Nature 491, 56–65 (2012).
- Pasaniuc et al. 2013 Pasaniuc, B. et al. Analysis of Latino populations from GALA and MEC studies reveals genomic loci with biased local ancestry estimation. Bioinformatics 29, 1407–1415 (2013).
- Pompanon et al. 2005 Pompanon, F., Bonin, A., Bellemain, E. & Taberlet, P. Genotyping errors: causes, consequences and solutions. Nature Reviews Genetics 6, 847–846 (2005).
- Voskoboynik et al. 2013 Voskoboynik, A. et al. The genome sequence of the colonial chordate, Botryllus schlosseri. Elife 2, e00569 (2013).
- Hinds et al. 2013 Hinds, D. A. et al. A genome-wide association meta-analysis of self-reported allergy identifies shared and allergy-specific susceptibility loci. Nature Genetics 45, 907–911 (2013).
- Henn et al. 2012 Henn, B. M. et al. Cryptic distant relatives are common in both isolated and cosmopolitan genetic samples. PLOS ONE 7, e34267 (2012).
- Browning & Browning 2007b Browning, S. R. & Browning, B. L. Rapid and accurate haplotype phasing and missing-data inference for whole-genome association studies by use of localized haplotype clustering. The American Journal of Human Genetics 81, 1084–1097 (2007b).
- Frazer et al. 2007 Frazer, K. A. et al. A second generation human haplotype map of over 3.1 million SNPs. Nature 449, 851–861 (2007).
- Kent et al. 2002 Kent, W. J. et al. The human genome browser at UCSC. Genome Research 12, 996–1006 (2002).
- Zhuang et al. 2012 Zhuang, Z., Gusev, A., Cho, J. & Pe’er, I. Detecting Identity by Descent and Homozygosity Mapping in Whole-Exome Sequencing Data. PLOS ONE 7, e47618 (2012).
- Paynter et al. 2006 Paynter, R. A. et al. Accuracy of multiplexed Illumina platform-based single-nucleotide polymorphism genotyping compared between genomic and whole genome amplified DNA collected from multiple sources. Cancer Epidemiology Biomarkers & Prevention 15, 2533–2536 (2006).
Figures
Tables
A
Child Diplo
Child Haplo
Child Both
Total
Par None
0
0
0
0
Par Diplo
6,283,300
56,393
1,045,425
7,385,118
Par Haplo
57,353
243,447
236,157
536,957
Par Both
1,098,359
243,490
13,733,586
15,075,435
Total
7,439,012
543,330
15,015,168
22,997,510
B
Child Diplo
Child Haplo
Child Both
Total
Par None
14,055,602
483,921
5,853,193
20,392,716
Par Diplo
7,574,059
77,905
2,068,399
9,720,363
Par Haplo
82,378
243,698
372,885
698,961
Par Both
931,599
222,127
8,579,104
9,732,830
Total
22,643,638
1,027,651
16,873,581
40,544,870
Par, parent; Diplo, diplotype match only; Haplo, haplotype match only.
Supplementary Note
Logarithm of Odds (LOD) segment scoring
In this section, we describe an alternative scoring for potential IBD segments that is similar in spirit to the LOD score used in RefinedIBD 21. Specifically, for a given segment shared between two individuals and , we compute its LODscore as follows:
| (6) |
where (resp. ) is the observed genotype of individual (resp. ) over segment , and (resp. ) is the pseudo-likelihood of observing and conditioned on individuals and being IBD over segment (resp. not being IBD).
The pseudo-likelihood is computed as follows:
where is the genotyping error rate, is the number of markers in the IBD segment, and is the true genotype of individual j at position . The probability of genotypes as a function of the IBD state (0, 1 or 2 alleles shared IBD at position ) is given in Supplementary Table S3. We note that Supplementary Table S3 was derived elsewhere 11. The probability of observing a genotype given the true genotype and the genotyping error rate is given in Supplementary Table S4. Two genotypes are considered IBD if they either share one or two alleles IBD (IBD1 and IBD2 in Supplementary Table S4), and we give equal prior probabilities to the two configurations.
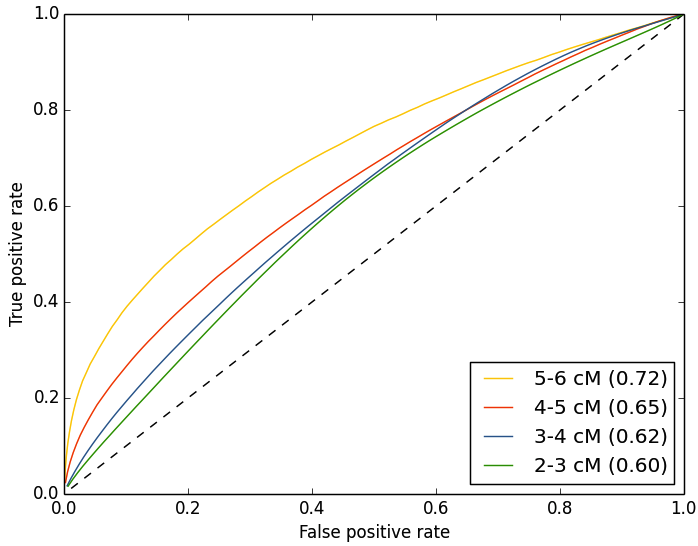
We assessed the performance of LODscore by computing its AUC for various segment sizes. We note that even though the LODscore has power to filter out false IBD segments, its AUC is generally lower than the HaploScore detailed in the main text (Supplementary Figure S11). Reasons for the lower power of LODscore may arise in part from two issues: 1) LODscore assumes each site is independent and thus ignores correlation between adjacent markers, and 2) LODscore ignores available phase information. Both issues could be alleviated by explicitly incorporating linkage disequilibrium between adjacent sites and switch errors into the model. However, because of the strong performance of HaploScore, we did not explore these research avenues further.
Supplementary Figures

Supplementary Tables
| Populationa | Total trios | Total individuals | Reported relationships |
|---|---|---|---|
| IBS | 50 | 150 | All trios |
| CEU | 2 | 104 | Two trios, 98 unrelatedb |
| GBR | 0 | 101 | One mother-daughter pair, one unknown |
| second order relationship, 97 unrelated | |||
| TSI | 0 | 100 | One sibling pair, 98 unrelated |
| FIN | 0 | 100 | All unrelated |
a IBS, Iberian populations from Spain; CEU, Utah residents with ancestry from northern and western Europe; GBR, British from England and Scotland; TSI, Toscans from Italy; FIN, Finnish from Finland.
b Reportedly unrelated NA06989 and NA12155 share 35 cM on chromosome 21.
A
Child Diplo
Child Haplo
Child Both
Total
Par None
0
0
0
0
Par Diplo
3,257
53
798
4,108
Par Haplo
50
167
170
387
Par Both
817
169
7,702
8,688
Total
4,124
389
8,670
13,183
B
Child Diplo
Child Haplo
Child Both
Total
Par None
7,955
424
4,397
12,776
Par Diplo
6,037
102
1,914
8,053
Par Haplo
90
281
387
758
Par Both
1,267
278
8,227
9,772
Total
15,349
1,085
14,925
31,359
Par, parent; Diplo, diplotype match only; Haplo, haplotype match only.
| IBD0 | IBD1 | IBD2 | |
|---|---|---|---|
| AA, BB | 0 | 0 | |
| AA, AA | |||
| AA, AB | 0 | ||
| AB, AB |
represents the allele frequency of allele A and represents the allele frequency of allele B.