Possible very high transition temperatures in the infinite-layer ACuO2 cuprate superconductor for A={Mg, Ca, Sr, Ba}: A DFT study
Abstract
We show from a bond valence sum correlation that very high superconducting values should be found in optimally hole-doped infinite-layer ACuO2 cuprates - up to 160 K for A = Ba. The projected increase in across the series arises from “internal pressure” effects as A runs from Mg to Ba. We then use density functional theory to investigate these pressure effects on the band structure in an attempt to understand this progressive increase in . Where these materials have been synthesised we find good agreement between our calculated structural parameters and the experimental ones. We find that internal pressure associated with increasing ion size does indeed enhance the superconducting energy gap, as observed, via modifications to the electronic dispersion. Furthermore, in our calculations, pressure alters the dispersion independently of how it is applied (internal or external) so that the superconducting energy gap correlates with the unit-cell volume and a Fermi-surface shape-parameter describing ratio of next-nearest-neighbor to nearest-neighbor hopping integrals. We infer an energy scale for the pairing interaction of the order of 1 eV, well above the magnetic energy scale.
pacs:
71.20.-b, 74.20.PqI introduction
Ion-size is a concept for the volume of space occupied by an ion’s bound electrons. It is an important consideration in the synthesis of novel materials or in predicting structural stability and can play an analogous role to external-pressure by altering orbital overlap. The associated “effective pressure” is called chemical- or internal-pressure.Marezio et al. (2000); Khosroabadi et al. (2004) Here, we refer to the chemical-pressure from altering ion-size as ‘internal-pressure’ and mechanically applied pressure as ‘external-pressure’. Isovalent ion-substitution can thus be utilized to alter the structural and electronic properties of a material, and this can be achieved in a systematic manner where the ion-size progressively changes, as in the rare-earth series R={Lu, …, La}, or column II ions A={Mg,Ca,Sr,Ba,Ra}. For example, in the R(Ba2-xSrx)Cu3O7 family of cuprate high-temperature superconductors the lattice and structural parameters systematically change with ion-size, demonstrating internal-pressure effects.Guillaume et al. (1994); Licci et al. (1998); Gilioli et al. (2000) Concurrently, as the ion-size is increased, the maximum superconducting transition temperature, , increases from 70 K for YSr2Cu3O7-δ,Gilioli et al. (2000) to nearly 100 K for LaBa2Cu3O7.Lindemer et al. (1994)
Relating in a systematic way to crystallographic and electronic structure is undoubtedly complicated by the competing correlations that exist in the cuprates.Keimer et al. (2015) The presence of a pseudogap as a separate competing entity, charge-ordering and their respective Fermi-surface reconstructions, is now well established.Tallon and Loram (2001); Comin and Damascelli (2016) Despite this, for all cuprates the maximum superconducting transition temperature, , in the phase curve at optimal doping does correlate exceptionally well with a structural bond valence sum (BVS) parameter, , which combines both the planar copper and oxygen BVS as a measure of the distribution of doped charge between copper and oxygen orbitals.Tallon (1990) also reflects the in-plane stretch and the displacement of the apical oxygen. Its correlation with is shown in Fig. 1 for the above-mentioned RBa2-xSrxCu3O7, where the red symbols are for different R across the lanthanide series when while blue symbols are for increasing when R=Y.Mallett et al. (2013) The systematic trend reflects the progressive increase in ion size and it is part of a more general trend, shown by the green symbols, across all cuprates.Tallon (1990) By any measure the correlation is exceptionally good. This surely gives some hope that underlying the complex soup of electronic interactions which are present in the cuprates there does exist a common and systematic relationship between and structure. This paper aims to identify and clarify the details of this relationship in another model cuprate system, the so-called infinite-layer cuprate ACuO2.
But first we comment further on why, despite the competition of compound electronic order, such a relationship might yet exist. To begin with, charge ordering, whether short- or long-range, seems to be confined to the underdoped regionKeimer et al. (2015); Comin and Damascelli (2016) and is responsible for the plateau or dip in around a hole concentration, , of about holes/Cu.Chang et al. (2012) It therefore likely has little or no influence on the magnitude of on the gross scale of values ranging from 7 K to 134 K. And while the pseudogap is already present at optimal doping it closes not far beyond,Tallon and Loram (2001) where the scale of is already set. Typically, with increasing hole doping the value of falls just 7% from its maximal value when the pseudogap closes. Indeed the pseudogap is responsible for the decrease in on the underdoped sideLoram et al. (1994) since the magnitude of the gap amplitude, , remains essentially constant across the underdoped regime.Yu et al. (2008); Tallon et al. (2011) Evidently it would be more appropriate to seek a relationship between and structure since the magnitude of the order parameter is a more fundamental quantity than . This is underscored by the fact that in the cuprates strong fluctuations reduce significantly below the mean field value (thus accounting for the large observed values of ).Tallon et al. (2011) So we embark on our enterprise with the clear understanding that is only a proxy for the overall scale of , but it is a consistent proxy little affected by charge ordering, the pseudogap and their associated Fermi surface reconstructions.
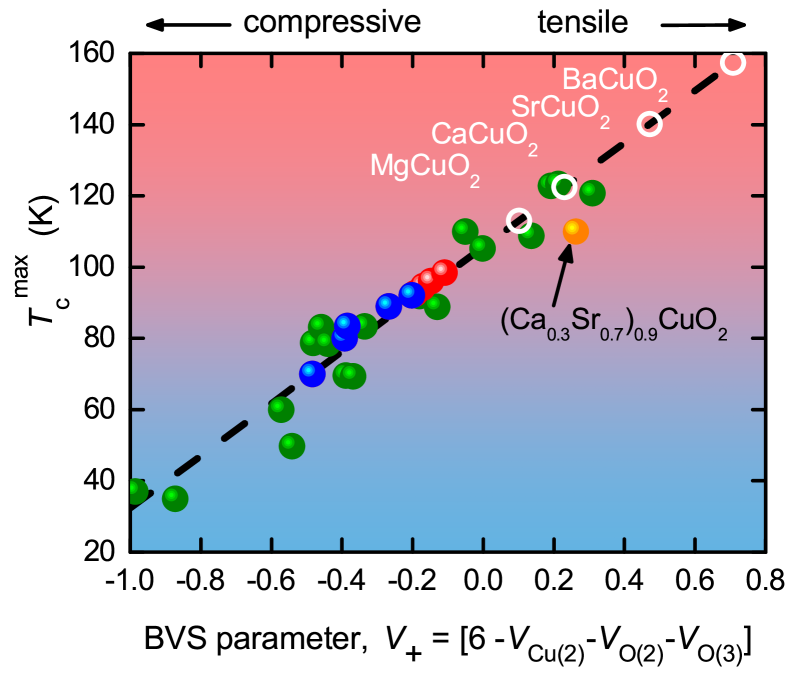
The clear implication of Fig. 1 is that expanding the lattice by substituting larger ions increases . And so we ask what would be the equivalent effect in the ideal infinite layer compounds ACuO2 with increasing ion size as A progresses down column 2 of the periodic table: A Mg Ca Sr Ba? To anticipate, we use the energy-minimized structural parameters found below to calculate for this series. The simplicity of the structure is such that only the - and -axis lattice parameters are needed for the calculation. The calculated values of are comparatively high and the black symbols in Fig. 1 show the model values if the correlation is preserved in this idealized system. The predicted , ranging up to 160 K for A=Ba represent our first key result. The challenge is to synthesise these materials and dope them up to optimal doping holes/Cu, but this prediction provides strong motivation for deeper study of this generic system. As a comparison, we do have one data point (orange) for (Ca0.3Sr0.7)0.9CuO2 where is reported at 110 K.Azuma et al. (1992); Karpinski et al. (1994, 1997) The stoichiometry here suggests a doping level of and indeed we can estimate the doping level using a second BVS parameter , which we find to take the value 0.098, in agreement with the stoichiometry. So this system is somewhat underdoped and we expect to exceed 110 K, perhaps more in keeping with the correlation in Fig. 1.
We may view the data of Fig. 1 as generally indicating a decrease in due to internal- or chemical-pressure arising from chemical substitution of smaller ions. These internal-pressure effects on contradict the universal increase of under external-pressure that is observed in the cuprates.Schilling (2007) This presents a central paradox in cuprate physics and its resolution may well reveal the underlying pairing mechanism. It is difficult to understand in a simple magnetic pairing scenario where both internal and external pressure equally increase the magnitude of the anti-ferromagnetic exchange energy, . Instead we have argued that ion polarizabilities play a key role in resolving this paradox in an alternative dielectric pairing scenario.Mallett et al. (2013) Of course both might be operative.
This sets the scene for the present studies. There is a clear correlation between structural parameters and which can be tuned by changing ion size. On the other hand, internal pressure arising from ion-size effects has the opposite effect of external pressure. We choose the infinite-layer cuprate, ACuO2, as the ideal model system to explore, and possibly reconcile, these effects. We use density functional theory (DFT) calculations where internal-pressure is implemented by altering the A-site ion from Mg to Ba. We then compare these results with the simulated effect of external pressure. ACuO2 was chosen because it has the simplest realisable chemical structure that still displays essential aspects of cuprate physics. It has a P4/mmm tetragonal unit-cell with the Cu ion at , O at and and A at . The undoped material is insulating due to strong electronic correlations.Freelon et al. (2010) As noted, superconductivity is observed in (Ca0.3Sr0.7)0.9CuO2 with K for hole-doping (due to A vacancies) Azuma et al. (1992); Karpinski et al. (1994) or K under electron-doping (by R substitution for A).Jung et al. (2001) More recently, high-quality multilayer thin films of CaCuO2 and SrTiO3 have been grown with up to 50 KDi Castro et al. (2012); Minola et al. (2012); Salvato et al. (2013) where the CuO2 layer is hole-doped via excess oxygen at the SrTiO3-CaCuO2 interfaceAruta et al. (2013); Di Castro et al. (2015) and CaCuO2-(Ba1-xNdx)CuO2+δ multilayers have been grown with up to 80 K.Balestrino et al. (1998); De Caro et al. (1999); Balestrino and Tebano (2003); Orgiani et al. (2007)
DFT has been used extensively to study the electronic properties of the cuprates. Early calculations accurately reproduced phonon spectra and intensities observable by Raman spectroscopy.Cardona (1999) More recently Pavarini et al.Pavarini et al. (2001) and Sakakibara et al. Sakakibara et al. (2012, 2014) used DFT methods to identify electronic parameters that might play a role in governing . As a model cuprate there have been numerous DFT studies on CaCuO2.Anisimov et al. (1991); Hatta et al. (1992); Agrawal and Agrawal (1993); Andersen et al. (1996); Massidda et al. (1997); Wu et al. (1999); Singh (2010) These studies found that the experimental lattice parameters were reproduced to within a few percent. The calculated band-structure had similar features to other cuprates, such as YBa2Cu3O7-δ. Other than a shift in the Fermi-Energy, , the band-structure changed little with hole-doping, , up to 10% (Ref. Andersen et al., 1996) - a so-called rigid band shift. In the DOS there is a van-Hove-singularity feature eV below and its position is pressure dependent.Agrawal and Agrawal (1995) In addition, various methods have been employed to try to reproduce strong-correlation features of the undoped cuprates, such as the charge-transfer band-gap and the anti-ferromagnetic order on the CuO2 plane.Anisimov et al. (1991); Wu et al. (1999) There have also been several reported DFT studies of SrCuO2.Nagasako et al. (1997); Wu et al. (1999) Prepared under ambient pressure, stoichiometric SrCuO2 forms 1D chains Kim et al. (1996) whilst the electron-doped Sr0.9R0.1CuO2 forms the P4/mmm tetragonal structure.Jung et al. (2001) A recent DFT study investigated the propensity of ACuO2 thin-films lattice matched to their SrTiO3 substrate to form an alternative chain-like structure.Zhong et al. (2012)
In distinction to these previous studies, we present here a comparative study of ACuO2 across the alkaline earth series to investigate internal- and external-pressure effects on the electronic properties in this family of cuprate materials.
II Computational details
The DFT calculations were performed using the Vienna Ab-Initio Simulation Package Payne et al. (2013); Kresse and Hafner (1993, 1994); Kresse and Furthmüller (1996, 1996) (VASP) with Projector Augmented Wave (PAW) pseudopotentials from the VASP5.2 library.Blöchl (1994); Kresse and Joubert (1999) We used the GGA-PW91 Generalised Gradient Approximation scheme developed by Perdew et al. Perdew et al. (1992, 1993) to derive the form of the exchange-correlation potential and kinetic energy in the single-electron Hamiltonian.
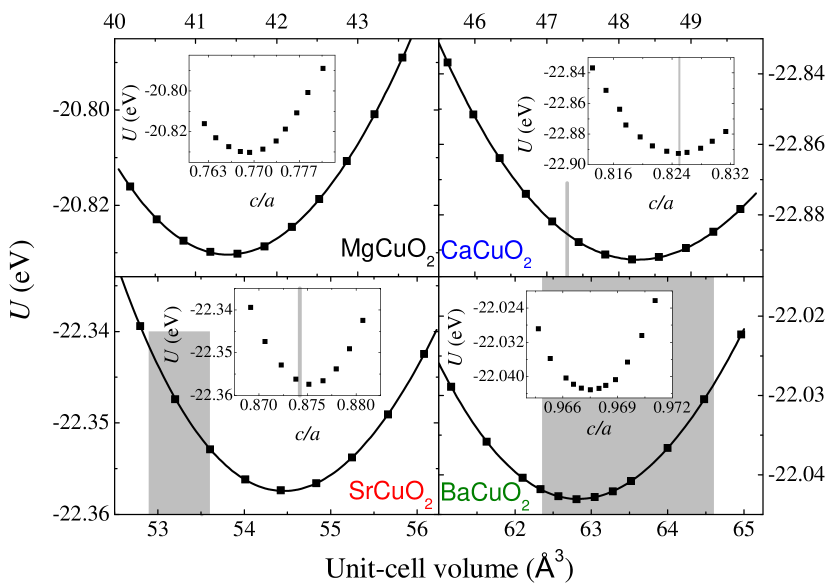
To calculate the equilibrium structural parameters for ACuO2, we determined the internal-energy, , (the ‘free-energy’ in VASP nomenclature) for fixed unit-cell volume, , with a -space, -centred mesh. For each , the ion positions and lattice parameters were first relaxed, using a conjugate-gradient algorithm Press et al. (1986) in VASP, and this was followed by an accurate calculation of with fixed ion positions and lattice parameters. The results of this procedure are shown in Fig. 2a). The lattice parameters with the lowest free-energy are; , 3.880, 3.962, Å and , 3.201, 3.467, Å for A=Mg, Ca, Sr and Ba respectively. These correspond to unit-cell volumes of , 48.19, 54.42, Å3. The ratio scales with unit-cell volume as with Å-3, which is similar to what is found experimentally Qin et al. (2005a). We do not observe any buckling of the CuO2 layers, as expected on symmetry grounds.
For calculations of the electronic dispersion we use structures with the lowest and a -space mesh. Band-structure calculations involve a non-self-consistent calculation using a high-quality self-consistently calculated charge-density as an input.
a)
b)
c)
The grey shaded regions in Fig. 2a) indicate experimentally determined structural parameters at room-temperature where they are available.Takano et al. (1989); Karpinski et al. (1994); De Caro et al. (1999); Jung et al. (2001); Qin et al. (2005b) To our knowledge there are no reports that MgCuO2 has been synthesized. Neither has the synthesis of pure bulk BaCuO2 been reported, suggesting this compound is also unstable. For example de Caro et al. De Caro et al. (1999) report up to 30% vacancies on the Cu site with lattice parameters Å and Å assumed from lattice matching to the SrTiO3 substrate. Here we find a reversed ratio compared with these experimental results. Super-lattices of intercalated Ba-, and Ca- infinite layer compounds have been reported to be superconducting up to 80 K De Caro et al. (1999); Balestrino and Tebano (2003); Orgiani et al. (2007). Note that the ion-size dependent lattice-parameter ratio indicates anisotropic stress under ion-substitution so that the internal-pressure effect is not simply hydrostatic.
To calculate the bulk moduli, , we fit the data presented in Fig. 2a) to the Murnaghan equation of state Khosroabadi et al. (2004) (in SI units);
| (1) |
where is generally taken to be constant. The fits are shown as lines in Fig. 2a) from which we find , 106, 111 and 127 GPa for A = Ba, Sr, Ca and Mg respectively. As expected, these materials become more compressible as the ion-size increases. By comparison Qin et al. Qin et al. (2005a) experimentally determine the bulk moduli of CaCuO2 to be GPa for GPa and GPa for GPa, where denotes (external) pressure. (For comparison with other cuprates, GPa for YBa2Cu3O7 and GPa for YBa2Cu3O6.Jorgensen et al. (1990)) We thus find reasonable agreement between our calculated stable structural parameters and experimental results.
To simulate external pressure we used relaxed structures at fixed where is not at the minimum. For example, CaCuO2 with a unit-cell volume of Å3 corresponds to an external pressure of GPa when using the experimental bulk modulus of 186 GPa (Ref. Qin et al., 2005a) and has the ratio . This simulated external pressure has a similar effect on the ratio as that of internal pressure.
III Results - electronic structure
Here we are interested in the internal-pressure induced modification of the electronic dispersion, , close to () and how this compares with that caused by external pressure.
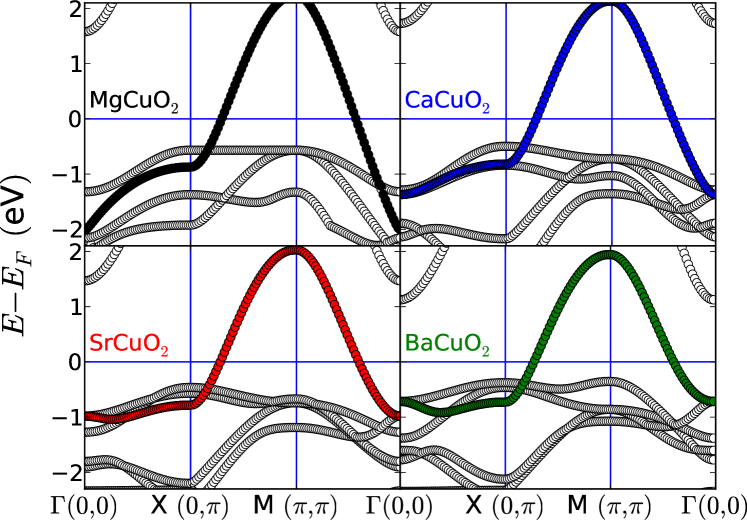
In Fig. 2b) we show the band-structure along the path --- with for ACuO2 at . Between and there is a strongly dispersive band crossing close to and . This band, shown colored, is associated with states in the CuO2 plane and is the only band that contributes to the DOS within eV of . Between eV and eV there are several other bands that move closer to as the A-site ion-size increases (and as concurrently increases).
It is well known that the undoped cuprates, including CaCuO2, have a charge transfer gap of approximately 2 eV,Lee et al. (2006); Freelon et al. (2010) in contrast to these calculations which imply undoped ACuO2 is metallic. In fact, this is to be expected from GGA calculations on the undoped system because they do not account for the strong-correlation physics of the undoped cuprates. This deficiency could be addressed by the use of LSDA+U calculations to correct the band gap by the introduction of a Coulomb repulsion term. However, this would cause some difficulties in comparison of ion-size effects, since itself should be ion-size dependent due to the effect of ionic polarizability Shannon (1993) on screening.van den Brink et al. (1995); Sawatzky et al. (2009)
However, the dispersion reflects the rigidly shifted band structure observed using angle-resolved photoemission spectroscopy (ARPES) at finite doping where the strong-correlations are screened out by mobile carriers. Further, the saddle-point vHs is known to reside below and is crossed in the overdoped region leading to a change in the Fermi-surface topology.Kaminski et al. (2006); Storey et al. (2007) So these calculations do reveal the features of the dispersion that are known to exist when correlations are suppressed and it is therefore plausible that the systematic changes with ion-size shown here reflect real band-structure evolution.
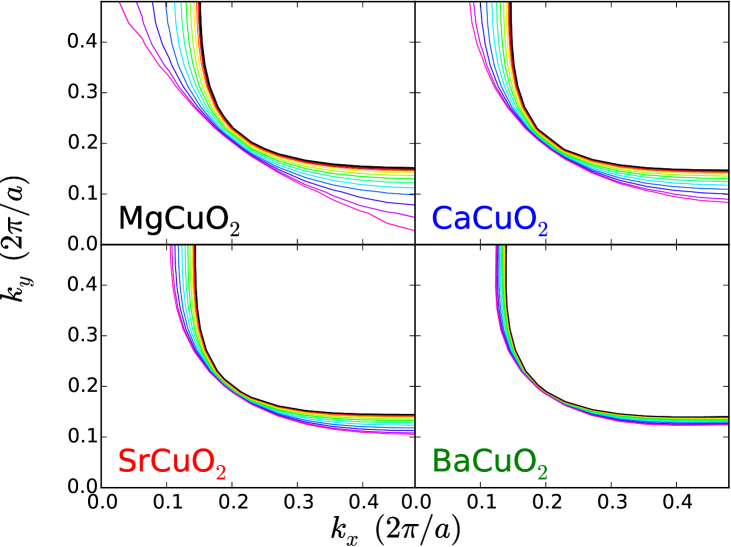
The calculated band structure also reveals that the dimensionality of the dispersion is affected by internal- and external-pressure. To illustrate this, in Fig. 2c we plot Fermi-contours ( in the (-plane) for momenta from 0 to in steps of . The dispersion is smaller for larger A ion-size because these decouple the CuO2 layers resulting in the more 2-dimensional-like Fermi-surface. When A=Ba there is little change in the Fermi-contours for different . Only when this dispersion is considered is the Luttinger sum rule satisfied for these undoped materials.
In Fig. 3 we show the total DOS as a function of internal-pressure (i.e. as the A-site ion-size progressively increases). Starting at eV, there is a peak in the DOS that progressively moves closer to as the internal-pressure increases. The multiple bands in this energy region and the significant dispersion (particularly for the materials with small unit-cell volume, ) complicate the interpretation of this feature. There is a secondary peak in the DOS between eV for MgCuO2 and eV for BaCuO2 that derives in part from the saddle-point in the dispersion of the colored band in Fig. 2b. In materials with smaller this peak is significantly broadened by the large dispersion.
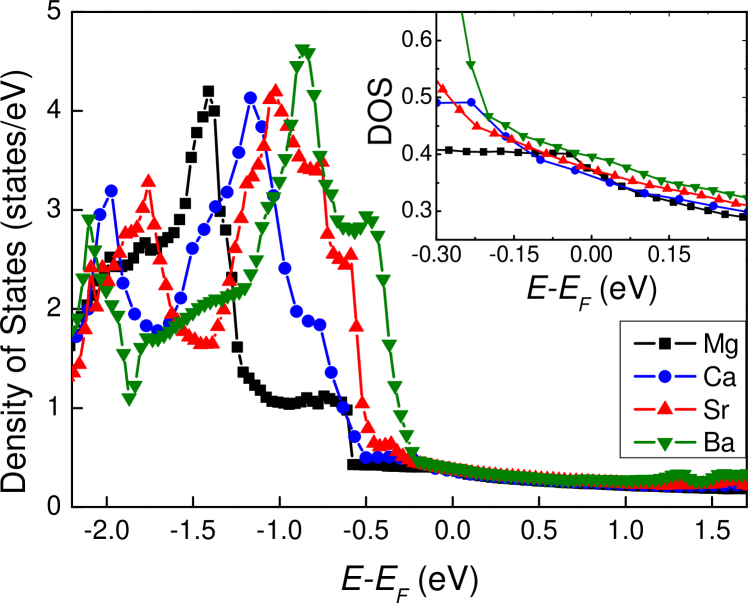
However, the states directly relevant to superconductivity most likely lie within eV of . This region of the DOS is shown in the inset to Fig. 3 and shows that the DOS at is similar, but with a slight increase in the DOS with increasing ion size. The band contributing to the DOS in this region, shown colored in Fig. 2b, can be interpolated using the tight-binding expression;
| (2) | ||||
The term in Eq. 2 accounts for the dispersion Markiewicz et al. (2005); Pavarini et al. (2001) illustrated in Fig. 2c. The tight-binding coefficients, , extracted from fitting the DFT-derived dispersion, , are plotted in Fig. 4a. Closed (open) symbols are for internal- (external-) pressure effects and show that the dispersion, , alters with internal- and external-pressure in a similar fashion. The errors for each tight-binding fit, defined as where is the number of data points, are shown in the lower panel. Typical errors are eV with larger volumes better described by the tight-binding dispersion of Eq. 2. Eq. 2 best describes the band close to and deviates most from the DFT values around the top and bottom of the band. Parameterizing the dispersion thus is justified if one’s interest is restricted to within eV of the , as is indeed the case for our calculations of the superconducting energy gap (described below). Importantly, this allows us to sample the dispersion over a much finer -space mesh of points (which is not practically possible using VASP alone) for calculations of the DOS and the superconducting energy gap.
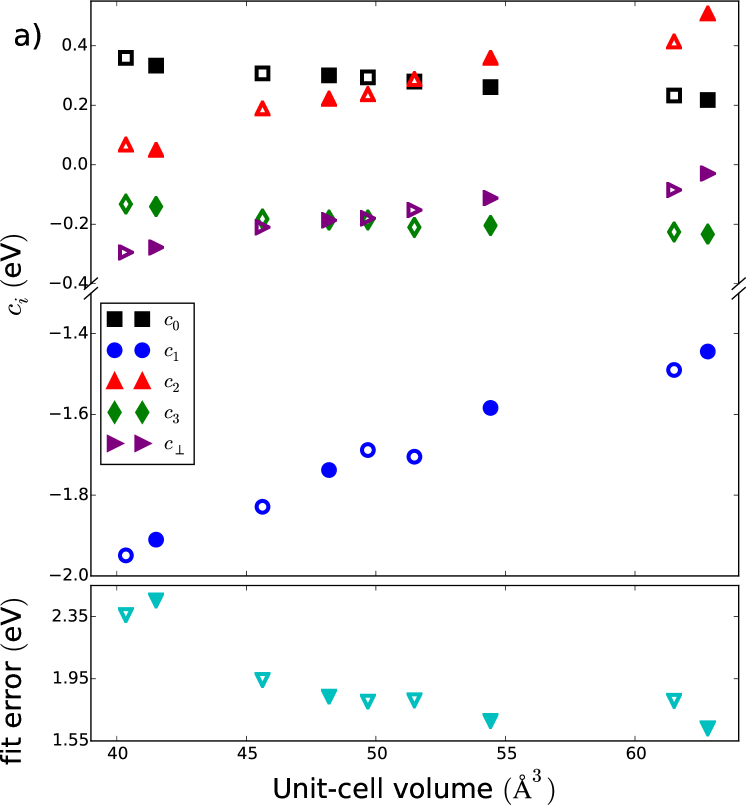
The nearest-neighbor hopping term, , shows the largest pressure-induced variation, increasing from to eV from the smallest to largest . Concurrently, the next-nearest-neighbor term, increases from to eV resulting in the more ‘rounded’ Fermi-contours of BaCuO2 seen in Fig. 2c. We describe later in the paper how these pressure-induced changes in Fermi-surface shape relate to the superconducting energy gap. vanishes as increases reflecting the weaker -axis coupling between CuO2 planes at larger and a more 2-dimensional-like Fermi-surface.
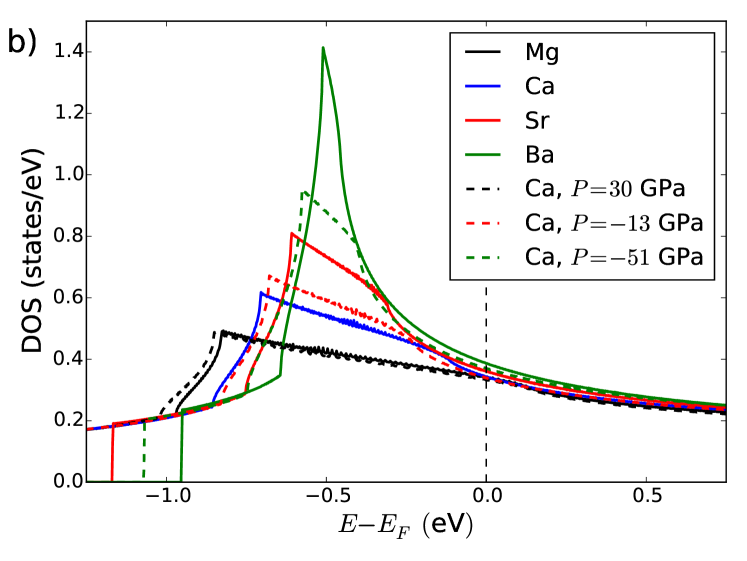
The DOS calculated from the parameterized dispersion, , is shown in Fig. 4b. Full solid lines represent internal-pressure effects (ACuO2 with A indicated in the legend) and dashed lines represent external-pressure effects (CaCuO2 with the effective pressure indicated in the legend). Fig. 4b reveals similar features to the DOS calculated with VASP where materials with larger have higher DOS at . Fig. 4b also shows the vHs at eV originating from the saddle-point in the band around (and symmetry related points). The vHs is significantly broadened by the dispersion for materials with smaller .
IV Superconducting energy gap calculations
What bearing might these internal- and external-pressure induced changes in the dispersion and DOS have on superconductivity in these systems? To approach this question we solve the self-consistent BCS gap-equation Zhou and Schulz (1992); Storey et al. (2007) to obtain the superconducting energy gap, ;
| (3) |
Here is the pairing potential of the form where to reflect -wave symmetry, and the -wave superconducting gap is given by . Note that in the absence of competing order parameters, such as the pseudogap, one can expect that is proportional to . We take from the tight-binding fits, , discussed above.
We solve Eq. 3 self-consistently assuming a pressure and ion-size independent meV and summing over states within meV of . The resulting values are plotted as a function of unit-cell volume in Fig. 5. Closed symbols represent volume changes induced by internal-pressure, while the open symbols represent volume changes induced by external-pressure. There is a 30-fold increase in the magnitude of for an approximately % increase in the unit-cell volume. The sensitivity of on the unit-cell volume shown in these calculations demonstrates that these internal- and external-pressure effects can potentially have a dominant effect on the superconducting properties via the electronic dispersion, .

Although there is some scatter in the internal-pressure data which ultimately results from the detailed shape of the Fermi-surface, it appears that correlates with the unit-cell volume independent of the mechanism altering the volume. This means that the character of the band crossing derives from the CuO2-layer and not the A-site ion. This correlation is independent of the choice of or energy cut-off. We also checked this correlation for different doping levels of the CuO2-layer, , where is varied by setting so that integrating the DOS (derived from Eq. 2) up to gives the desired number of electrons, e.g. if is desired. This method of varying can only be valid within a rigid-band scenario. At , is shifted down in energy by up to 280 meV in Fig. 2b so that there is still only one relevant band for the calculation of . With we find a similar correlation between and the unit-cell volume yet more clearly demonstrated.
We note that the relative magnitudes of for SrCuO2 and BaCuO2 (filled squares at and Å3 respectively) are at odds with the general trend in and with CaCuO2 at equivalent (open squares) and also at odds with the general trends in Fig. 1. Recall that the tight-binding parameters determining alter under internal- and external-pressure in a similar fashion so that one might expect similar from Eq. 3. Furthermore, the DOS at the Fermi-level, , scales only with and so, in light of the weak-coupling BCS result for -wave superconductivity:
| (4) |
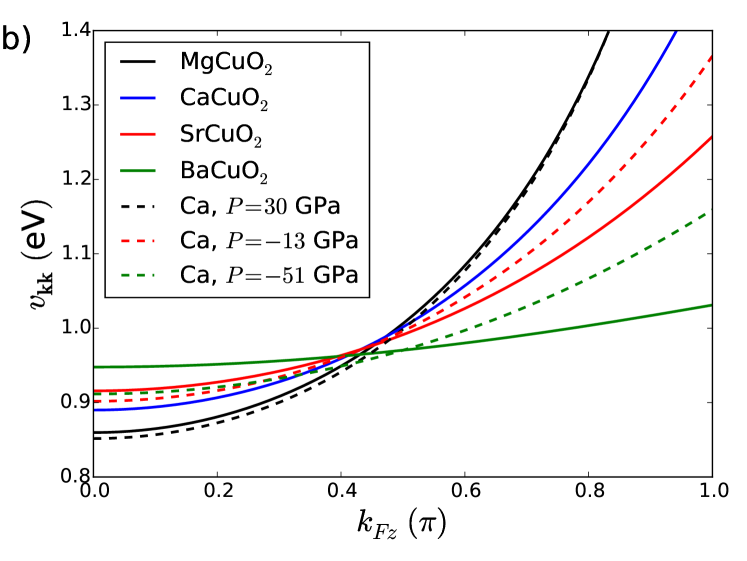
the distinct magnitudes for SrCuO2 and BaCuO2 are especially surprising. In this equation is the pairing-boson energy scale. However, one can understand these disparate as resulting from the difference in the average pairing potential close to the anti-nodes, where is largest. This is in turn due to the detailed shape of the Fermi-surface. By way of illustration we plot in Fig. 5b corresponding to the points where the Fermi contours touch the zone boundary at as a function of (we append the subscript to denote a value of at the Fermi-energy). Combined, Fig. 2c and Fig. 5b show that the Fermi-surface of BaCuO2 spans regions of lower pairing-potential than SrCuO2 which results in the comparatively small . This result highlights how sensitive can be to the precise shape of the Fermi-surface.
V Discussion
While Fig. 5a shows that correlates with somewhat independently of how the pressure is applied, because of the near linear relationship between , and (see Fig. 4), the same correlation between and the composite parameter or holds. The ratio is the Fermi-surface-shape parameter which Pavarini et al., and more recently Sakakibara et al., showed correlates with across a wide range of cuprates Pavarini et al. (2001); Sakakibara et al. (2012, 2014) and this is consistent with the correlation between and that we find here.
It is interesting to relate this relation between Fermi-surface-shape and or to that between and shown in Fig. 1. The large values of in Fig. 1 which lead to large projected values of arise mostly because of the absence of the apical oxygen in the infinite-layer system. It is this which also yields the high values of the three-layer cuprates.Haines and Tallon (1992) The physical reason is likely related to the distribution of charge on the (planar) oxygen orbitals relative to the copperOhta et al. (1991), which was what the parameter was first introduced as a measure ofTallon (1990) (we note that our DFT calculations here can confirm that the fraction of charge on oxygen orbitals grows concurrently with in ACuO2). Such ideas continue to find support in recent experimental work. Peng et al. Peng (2016) highlight the role of the apical oxygen on the ‘range’ of electronic interactions and where they found that, in general, as the apical oxygen is moved away from the CuO2 layer the long-range Heisenberg interaction terms become more important for an accurate description the experimentally measured magnon dispersion. Also, Rybicki et al. have recently made a similar prediction for very high values in the electron-doped systems based on their NQR measurements of charge distribution between oxygen and copper orbitals.Rybicki et al. (2016) Presumably they would find the same for the infinite layer compounds and an important challenge in this regard is doping these compounds. In heterostructure superlattices of these compounds the significantly doped CuO2 layers are found at the interface and are effectively bonded to an apical oxygen that is part of the adjacent layer.Balestrino et al. (1998); Aruta et al. (2013); Di Castro et al. (2015) This changes the local structure of the infinite-layer compound. Only a modest transfer of charge, over the range Å,Di Castro et al. (2015) dopes the CuO2 layers beneath the interface, with the innermost layers remaining undoped and non-superconducting or heavily underdoped. It remains to be seen whether alternate approaches to doping the infinite layer compounds, such as liquid ion-gating, are viable.
In conclusion, we draw three main inferences: firstly, we expect from BVS correlations that values for optimally-doped infinite-layer compounds ACuO2 are rather high, rising to K as A ranges from Mg to Ba (and possibly higher still for A=Ra) due to internal pressure effects. Secondly, we show from DFT calculations that such marked changes in superconducting properties are indeed plausible via the systematic changes in the dispersion, . Thirdly however, leaving aside Ba, these effects prove to be essentially the same for both internal- and external-pressure in contrast with the opposing effects of internal- and external-pressure on observed experimentally, for example in the RBa2Cu3O7-δ (Refs. Guillaume et al., 1994; Licci et al., 1998; Gilioli et al., 2000; Schilling, 2007) and (La1-xCax)(Ba1.75-xLa0.25+x)Cu3Oy (Refs. Ofer et al., 2006; Sanna et al., 2009) systems. This work suggests that the pressure-induced modification of alone is insufficient to account for the observed pressure-induced variation in , and that the disparate effects of internal and external pressure are to be found in the pairing potential, , or the pairing-boson energy-scale. As we showed previously, a dielectric pairing model seems to account for this disparity better than a magnetic model.Mallett et al. (2013) Moreover, we find from these calculations that in order to achieve realistic gap values of the order of 30 meV, as observed, one needs a bosonic energy scale of the order of 1 eV, substantially larger than the magnetic energy scale and perhaps more consistent, for example, with a dielectric model where pairing is mediated by exchange of virtual polarisation waves.Atwal and Ashcroft (2004) Clearly there is a delicate interplay between the structural, electronic and superconducting properties in the cuprates and a deeper understanding of this is necessary to elucidate the dramatic material specificity of . Complementary internal- and external-pressure effects offer a powerful approach to advance this project.
Acknowledgements.
The authors would like to thank D. Schebarchov and D. Mollenhauer for helpful discussions. This work was supported by the Marsden Fund of New Zealand.References
- Marezio et al. (2000) M. Marezio, E. Gilioli, P. Radaelli, A. Gauzzi, and F. Licci, Physica C: Superconductivity 341, 375 (2000).
- Khosroabadi et al. (2004) H. Khosroabadi, B. Mossalla, and M. Akhavan, Phys. Rev. B 70, 134509 (2004).
- Guillaume et al. (1994) M. Guillaume, P. Allenspach, W. Henggeler, J. Mesot, B. Roessli, U. Staub, P. Fischer, A. Furrer, and V. Trounov, Journal of Physics: Condensed Matter 6, 7963 (1994).
- Licci et al. (1998) F. Licci, A. Gauzzi, M. Marezio, G. P. Radaelli, R. Masini, and C. Chaillout-Bougerol, Phys. Rev. B 58, 15208 (1998).
- Gilioli et al. (2000) E. Gilioli, P. Radaelli, A. Gauzzi, F. Licci, and M. Marezio, Physica C: Superconductivity 341, 605 (2000).
- Lindemer et al. (1994) T. Lindemer, B. Chakoumakos, E. Specht, R. Williams, and Y. Chen, Physica C: Superconductivity 231, 80 (1994).
- Keimer et al. (2015) B. Keimer, S. Kivelson, M. Norman, S. Uchida, and J. Zaanen, Nature 518, 179 (2015).
- Tallon and Loram (2001) J. Tallon and J. Loram, Physica C: Superconductivity 349, 53 (2001).
- Comin and Damascelli (2016) R. Comin and A. Damascelli, Annual Review of Condensed Matter Physics 7, 369 (2016), http://dx.doi.org/10.1146/annurev-conmatphys-031115-011401 .
- Tallon (1990) J. L. Tallon, Physica C: Superconductivity 168, 85 (1990).
- Mallett et al. (2013) B. P. P. Mallett, T. Wolf, E. Gilioli, F. Licci, G. V. M. Williams, A. B. Kaiser, N. W. Ashcroft, N. Suresh, and J. L. Tallon, Phys. Rev. Lett. 111, 237001 (2013).
- Chang et al. (2012) J. Chang, N. Doiron-Leyraud, O. Cyr-Choinière, G. Grissonnanche, F. Laliberté, E. Hassinger, J.-P. Reid, R. Daou, S. Pyon, T. Takayama, et al., Nature Physics 8, 751 (2012).
- Loram et al. (1994) J. Loram, K. Mirza, J. Cooper, W. Liang, and J. Wade, Journal of superconductivity 7, 243 (1994).
- Yu et al. (2008) L. Yu, D. Munzar, A. V. Boris, P. Yordanov, J. Chaloupka, T. Wolf, C. T. Lin, B. Keimer, and C. Bernhard, Phys. Rev. Lett. 100, 177004 (2008).
- Tallon et al. (2011) J. L. Tallon, J. G. Storey, and J. W. Loram, Phys. Rev. B 83, 092502 (2011).
- Azuma et al. (1992) M. Azuma, Z. Hiroi, M. Takano, Y. Bando, and Y. Takeda, Nature 356, 775 (1992).
- Karpinski et al. (1994) J. Karpinski, H. Schwer, I. Mangelschots, K. Conder, A. Morawski, T. Lada, and A. Paszewin, Physica C 234, 10 (1994).
- Karpinski et al. (1997) J. Karpinski, H. Schwer, E. Kopnin, R. Molinski, G. Meijer, and K. Conder, Physica C: Superconductivity 282, 77 (1997).
- Schilling (2007) J. Schilling, in Handbook of High-Temperature Superconductivity, edited by J. Schrieffer and J. Brooks (Springer New York, 2007) pp. 427–46s2.
- Freelon et al. (2010) B. Freelon, A. Augustsson, J.-H. Guo, P. Medaglia, A. Tebano, G. Balestrino, C. Dong, C. Chang, P. Glans, T. Learmonth, et al., Physica C: Superconductivity 470, 187 (2010).
- Jung et al. (2001) C. Jung, J. Kim, M.-S. Kim, S. Lee, S.-I. Lee, and D. Ha, Current Applied Physics 1, 157 (2001).
- Di Castro et al. (2012) D. Di Castro, M. Salvato, A. Tebano, D. Innocenti, C. Aruta, W. Prellier, O. I. Lebedev, I. Ottaviani, N. B. Brookes, M. Minola, M. Moretti Sala, C. Mazzoli, P. G. Medaglia, G. Ghiringhelli, L. Braicovich, M. Cirillo, and G. Balestrino, Phys. Rev. B 86, 134524 (2012).
- Minola et al. (2012) M. Minola, D. Di Castro, L. Braicovich, N. B. Brookes, D. Innocenti, M. Moretti Sala, A. Tebano, G. Balestrino, and G. Ghiringhelli, Phys. Rev. B 85, 235138 (2012).
- Salvato et al. (2013) M. Salvato, I. Ottaviani, M. Lucci, M. Cirillo, D. Di Castro, D. Innocenti, A. Tebano, and G. Balestrino, Journal of Physics: Condensed Matter 25, 335702 (2013).
- Aruta et al. (2013) C. Aruta, C. Schlueter, T.-L. Lee, D. Di Castro, D. Innocenti, A. Tebano, J. Zegenhagen, and G. Balestrino, Phys. Rev. B 87, 155145 (2013).
- Di Castro et al. (2015) D. Di Castro, C. Cantoni, F. Ridolfi, C. Aruta, A. Tebano, N. Yang, and G. Balestrino, Phys. Rev. Lett. 115, 147001 (2015).
- Balestrino et al. (1998) G. Balestrino, S. Martellucci, P. G. Medaglia, A. Paoletti, G. Petrocelli, and A. A. Varlamov, Phys. Rev. B 58, R8925 (1998).
- De Caro et al. (1999) L. De Caro, C. Giannini, M. Nacucchi, L. Tapfer, G. Balestrino, P. G. Medaglia, and G. Petrocelli, Phys. Rev. B 59, 14074 (1999).
- Balestrino and Tebano (2003) G. Balestrino and A. Tebano, Superconductor Science and Technology 16, R29 (2003).
- Orgiani et al. (2007) P. Orgiani, C. Aruta, G. Balestrino, D. Born, L. Maritato, P. G. Medaglia, D. Stornaiuolo, F. Tafuri, and A. Tebano, Phys. Rev. Lett. 98, 036401 (2007).
- Cardona (1999) M. Cardona, Physica C: Superconductivity 317, 30 (1999).
- Pavarini et al. (2001) E. Pavarini, I. Dasgupta, T. Saha-Dasgupta, O. Jepsen, and O. K. Andersen, Phys. Rev. Lett. 87, 047003 (2001).
- Sakakibara et al. (2012) H. Sakakibara, H. Usui, K. Kuroki, R. Arita, and H. Aoki, Physical Review B 85, 064501 (2012).
- Sakakibara et al. (2014) H. Sakakibara, K. Suzuki, H. Usui, S. Miyao, I. Maruyama, K. Kusakabe, R. Arita, H. Aoki, and K. Kuroki, Phys. Rev. B 89, 224505 (2014).
- Anisimov et al. (1991) V. I. Anisimov, J. Zaanen, and O. K. Andersen, Phys. Rev. B 44, 943 (1991).
- Hatta et al. (1992) S. Hatta, R. Kasowski, and W. Hsu, Applied Physics A 55, 508 (1992).
- Agrawal and Agrawal (1993) B. K. Agrawal and S. Agrawal, Physical Review B 48, 6451 (1993).
- Andersen et al. (1996) O. Andersen, S. Savrasov, O. Jepsen, and A. Liechtenstein, Journal of Low Temperature Physics 105, 285 (1996).
- Massidda et al. (1997) S. Massidda, A. Continenza, M. Posternak, and A. Baldereschi, Phys. Rev. B 55, 13494 (1997).
- Wu et al. (1999) H. Wu, Q. Zheng, X. Gong, and H. Lin, Journal of Physics: Condensed Matter 11, 4637 (1999).
- Singh (2010) D. J. Singh, Physical Review B 82, 205102 (2010).
- Agrawal and Agrawal (1995) B. K. Agrawal and S. Agrawal, Physical Review B 52, 12556 (1995).
- Nagasako et al. (1997) N. Nagasako, T. Oguchi, H. Fujisawa, O. Akaki, T. Yokoya, T. Takahashi, M. Tanaka, M. Hasegawa, and H. Takei, Journal of the Physical Society of Japan 66, 1756 (1997).
- Kim et al. (1996) C. Kim, A. Y. Matsuura, Z.-X. Shen, N. Motoyama, H. Eisaki, S. Uchida, T. Tohyama, and S. Maekawa, Phys. Rev. Lett. 77, 4054 (1996).
- Zhong et al. (2012) Z. Zhong, G. Koster, and P. J. Kelly, Phys. Rev. B 85, 121411 (2012).
- Payne et al. (2013) M. Payne, J. Hafner, J. Furthmüller, J. Holender, G. Kresse, and et al., “Vienna ab-initial Simulation Package,” http://cms.mpi.univie.ac.at/VASP (2013).
- Kresse and Hafner (1993) G. Kresse and J. Hafner, Phys. Rev. B 47, 558 (1993).
- Kresse and Hafner (1994) G. Kresse and J. Hafner, Phys. Rev. B 49, 14251 (1994).
- Kresse and Furthmüller (1996) G. Kresse and J. Furthmüller, Comput. Mat. Sci. 6 (1996).
- Kresse and Furthmüller (1996) G. Kresse and J. Furthmüller, Phys. Rev. B 54, 11169 (1996).
- Blöchl (1994) P. E. Blöchl, Phys. Rev. B 50, 17953 (1994).
- Kresse and Joubert (1999) G. Kresse and D. Joubert, Phys. Rev. B 59, 1758 (1999).
- Perdew et al. (1992) J. P. Perdew, J. A. Chevary, S. H. Vosko, K. A. Jackson, M. R. Pederson, D. J. Singh, and C. Fiolhais, Phys. Rev. B 46, 6671 (1992).
- Perdew et al. (1993) J. P. Perdew, J. A. Chevary, S. H. Vosko, K. A. Jackson, M. R. Pederson, D. J. Singh, and C. Fiolhais, Phys. Rev. B 48, 4978 (1993).
- Press et al. (1986) W. H. Press, S. A. Teukolsky, W. T. Vetterling, and B. P. Flannery, Numerical Recipes (Cambridge University Press, New York, 1986).
- Qin et al. (2005a) X. Qin, Q. Liu, Y. Yu, Z. Bao, F. Li, R. Yu, J. Liu, and C. Jin, Science and Technology of Advanced Materials 6, 828 (2005a).
- Takano et al. (1989) M. Takano, Y. Takeda, H. Okada, M. Miyamoto, and T. Kusaka, Physica C: Superconductivity 159, 375 (1989).
- Qin et al. (2005b) X. Qin, Q. Liu, Y. Yu, L. Yang, J. Liu, and C. Jin, Physica C: Superconductivity 426, 510 (2005b).
- Jorgensen et al. (1990) J. Jorgensen, S. Pei, P. Lightfoot, D. Hinks, B. Veal, B. Dabrowski, A. Paulikas, R. Kleb, and I. Brown, Physica C 171, 93 (1990).
- Lee et al. (2006) P. A. Lee, N. Nagaosa, and X.-G. Wen, Rev. Mod. Phys. 78, 17 (2006).
- Shannon (1993) R. Shannon, Journal of Applied physics 73, 348 (1993).
- van den Brink et al. (1995) J. van den Brink, M. B. J. Meinders, J. Lorenzana, R. Eder, and G. A. Sawatzky, Phys. Rev. Lett. 75, 4658 (1995).
- Sawatzky et al. (2009) G. A. Sawatzky, I. S. Elfimov, J. van den Brink, and J. Zaanen, EPL (Europhysics Letters) 86, 17006 (2009).
- Kaminski et al. (2006) A. Kaminski, S. Rosenkranz, H. M. Fretwell, M. R. Norman, M. Randeria, J. C. Campuzano, J.-M. Park, Z. Z. Li, and H. Raffy, Phys. Rev. B 73, 174511 (2006).
- Storey et al. (2007) J. G. Storey, J. L. Tallon, and G. V. M. Williams, Phys. Rev. B 76, 174522 (2007).
- Markiewicz et al. (2005) R. S. Markiewicz, S. Sahrakorpi, M. Lindroos, H. Lin, and A. Bansil, Phys. Rev. B 72, 054519 (2005).
- Zhou and Schulz (1992) C. Zhou and H. J. Schulz, Phys. Rev. B 45, 7397 (1992).
- Haines and Tallon (1992) E. M. Haines and J. L. Tallon, Phys. Rev. B 45, 3172 (1992).
- Ohta et al. (1991) Y. Ohta, T. Tohyama, and S. Maekawa, Phys. Rev. B 43, 2968 (1991).
- Peng (2016) Y. Peng, arXiv:1609.05405 (2016).
- Rybicki et al. (2016) D. Rybicki, M. Jurkutat, S. Reichardt, C. Kapusta, and J. Haase, Nature communications 7 (2016).
- Ofer et al. (2006) R. Ofer, G. Bazalitsky, A. Kanigel, A. Keren, A. Auerbach, J. S. Lord, and A. Amato, Phys. Rev. B 74, 220508 (2006).
- Sanna et al. (2009) S. Sanna, S. Agrestini, K. Zheng, R. de Renzi, and N. Saini, EPL 86, 67007 (2009).
- Atwal and Ashcroft (2004) G. S. Atwal and N. W. Ashcroft, Phys. Rev. B 70, 104513 (2004).