Morphotropic Phase Boundaries in Ferromagnets: Tb1-xDyxFe2 Alloys
Abstract
The structure and properties of the ferromagnet Tb1-xDyxFe2 are explored through the morphotropic phase boundary (MPB) separating ferroic phases of differing symmetry. Our synchrotron data support a first order structural transition, with a broadening MPB width at higher temperatures. The optimal point for magnetomechanical applications is not centered on the MPB but lies on the rhombohedral side, where the high striction of the rhombohedral majority phase combines with the softened anisotropy of the MPB. We compare our findings with single ion crystal field theory and with ferroelectric MPBs, where the controlling energies are different.
pacs:
81.30.-t, 75.80.+q, 75.30.Kz, 75.10.DgThe functional response of ferroelectrics with compositions in the vicinity of a morphotropic phase boundary (MPB) is significantly enhanced. At the MPB composition PbZr.52Ti.48O3, lead zirconate-titanate (PZT) has long been a material of choice for actuator applications Jaffe1954 . New Pb-free piezoelectrics such as Ba(Zr.2Ti.8)O3–(Ba.7Ca.3)TiO3 also utilize the enhanced piezoelectric response near the MPB Ehmke2012andLiu2009 . The MPB separates two phases of distinct symmetry, typically rhombohedral and tetragonal, resulting in elastic boundaries between phases. PZT, for example, is a pseudo-binary alloy of tetragonal PbTiO3 and rhombohedral PbZrO3 with spontaneous ferroelectric polarizations oriented along and respectively in the two phases Jaffe1971etc ; Noheda2000andSolanki2011 ; Schonau2007 . At the atomic scale, two scenarios describing the ferroelectric MPB have been proposed. Both scenarios try to minimize the elastic and electric depolarization energies, and appear very similar when probed by bulk diffraction techniques Schonau2007 ; Wang2006and2007 . In the first, supercells incorporating local monoclinic distortions form along the MPB, as suggested by synchrotron X-ray diffraction (XRD) from PZT showing peak splittings typical of a low crystal symmetry Noheda2000andSolanki2011 . In the second, adaptive nanodomains form from orientational variants of the parent phases. This scenario explains the relations observed between the lattice parameters of the component phases Wang2006and2007 ; Rossetti2008andKhachaturyan2010 , and is supported by recent high-resolution microscopy studies Borisevich2012etc .
There are at least three types of MPBs distinguished by ferroic order: ferroelectric, ferromagnetic, and ferroelastic. Hybrid MPBs between ferroics of different nature should also exist KhachaturyanTBP . Information as to intrinsic MPB behavior can be revealed from studies of ferromagnetic MPBs, since in ferromagnets, the ferroic order and local atomic displacements are readily separated. A previous XRD study examined the MPB in the Tb1-yDyyCo2 ferromagnet Yang2010 . As in ferroelectrics, in Tb1-yDyyCo2 the MPB separates rhombohedral and tetragonal structures of the parent compounds TbCo2 and DyCo2, and coincides with an enhancement in a ‘figure of merit’ of magnetoelastic properties.
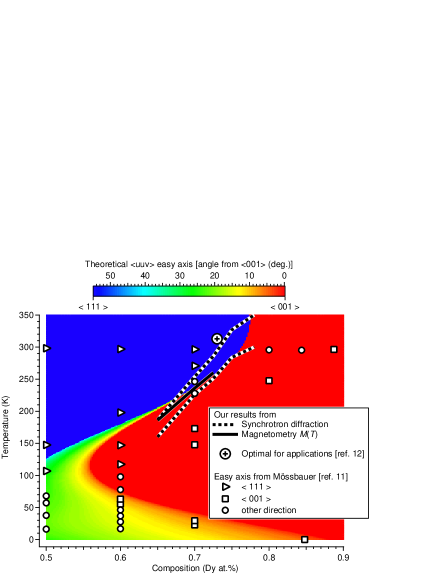
Here we report on magnetometry, neutron diffraction and synchrotron XRD experiments on the pseudo-binary alloy Tb1-xDyxFe2 (TDF). We show that the ferromagnetic MPB consists of a coexistence of the two crystallographic structures of the parent compounds TbFe2 and DyFe2. The volume fractions of these components vary continuously across the boundary. Our measurements are summarized in the phase diagram of Fig. 1 and compared with previous measurements Atzmony1977 ; Clark1985 plus the results of single ion crystal field theory. We find that the MPB region, across which phases coexist, widens with increasing temperature. This reflects entropy-driven microstructural changes that lie largely beyond the scope of single ion (mean field) theory.
Alloys of Tb1-xDyxFe2 (TDF) with , .675, .700, .725, .750, .765, .780 and .800 at. % were prepared at the Metals Preparation Center at Ames Laboratory by arc melting the constituent elements on a water-cooled copper hearth plate in a high-purity argon atmosphere. To ensure homogeneity each alloy was melted three times before being ground into a powder in an argon atmosphere. The starting metals were Ames Lab 99.99% Dy and Tb, and 99.95% pure electrolytic Fe. Magnetization was measured using a Quantum Design SQUID.
Zero-field synchrotron XRD experiments were performed at Argonne National Laboratory beamline 11-BM. The samples for XRD measurements were further ball-milled in an argon atmosphere before being sealed in 0.3 mm diameter quartz capillaries. During the XRD measurement, the sample temperature was controlled by a Cryostream N2 gas blower (range 100 K to 450 K) and the sample rotated continuously to reduce preferred orientation effects. Twelve silicon (111) crystal analyzers positioned in front of the LaCl3 scintillation detectors facilitated an instrument resolution of . Rietveld refinements of XRD data were performed using GSAS XRDrefinement . Neutron time-of-flight diffraction profiles in the range 12 K to 320 K were collected at the POWGEN instrument at the Spallation Neutron Source at Oak Ridge National Laboratory. For these measurements, samples were loaded into 8 mm dia. vanadium cans, and the data refined using the FullProf package neutronrefinement .
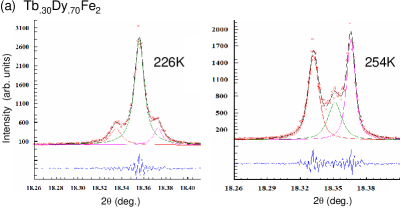
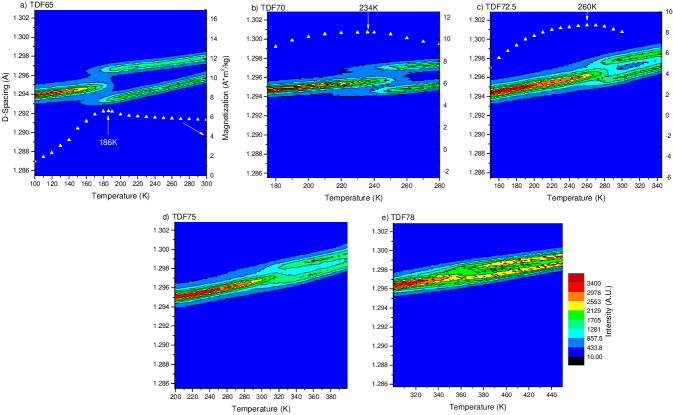
In Fig. 2 we show XRD data as a function of temperature across a series of Tb1-xDyxFe2 (TDF) alloys with in the range .65 to .78 at. %. We focus on the Bragg reflection (cubic or pseudo-cubic notation is used throughout this Letter), compiling contour plots from the powder XRD patterns taken in steps of K. Across the entire TDF series, these contour plots (Fig. 2) show wide temperature regions over which two phases coexist. At high temperatures, the XRD pattern can be fitted with rhombohedral Rm symmetry Yang2008 . The low temperature phase was anticipated to be tetragonal I4amd, but is fitted with cubic Fdm symmetry, as the synchrotron XRD instrument resolution is unable to resolve the small tetragonal distortion even in the parent DyFe2 Barbara1977 . In the transition region, the reflection is clearly split into three [Fig. 3(a)] corresponding to a coexistence of two peaks from the high-temperature rhombohedral phase and a single peak from the low-temperature phase. Systematic profile fitting reveals that the width of the two-phase region increases as the DyFe2 concentration increases, or equivalently as the MPB transition temperature increases. This is summarized graphically in the phase diagram (Fig. 1) where dotted lines delineate the two-phase region in which both phase fractions are %.
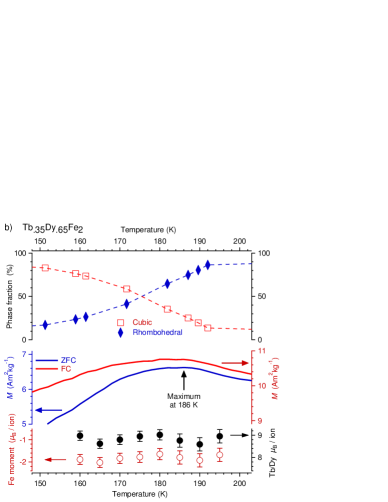
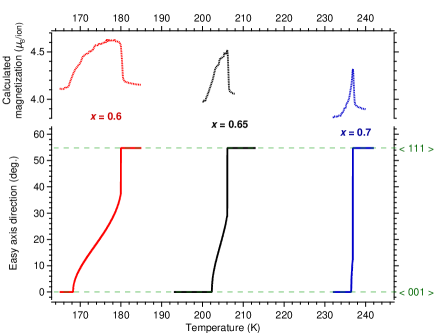
Rietveld refinement of synchrotron powder XRD patterns has become a standard tool for exploring the structural changes around the MPB Schonau2007 ; Noheda2000andSolanki2011 . Motivated by the reports of an intermediate monoclinic phase in ferroelectrics Noheda2000andSolanki2011 , a third phase was trialed in the MPB region of TDF. For TDF65 at 175 K, for example, we found that the goodness-of-fit and Rietveld indices and improve to some extent from to 1.25 and from to 0.0509 if a second cubic phase with a different lattice constant is added. The refined strains of all the phases are then reduced. On inspection, however, the peaks do not appear visibly split in support of a third phase [c.f. Fig. 3(a)]. We surmise that two highly-strained phases coexist across the MPB. The relative populations of the two phases as measured by the integrated diffracted intensities are plotted for TDF65 in Fig. 3(b) along with our magnetometry and neutron diffraction results. The magnetization measured in a low applied field (here we show results for 7.96 kAm-1) shows a peak at 186 K after both zero field-cooling (ZFC) and field-cooling. We shall see that this peak corresponds to a reduced magnetic anisotropy at the MPB. Our data for TDF70 and TDF72.5 reveal peaks at 236 K and 260 K respectively, as highlighted for the ZFC data overlayed on Fig. 2. Like the structural coexistence region, the maximum in broadens as the MPB transition temperature increases. We note that analogous behavior has not been reported in ferroelectrics.
A neutron powder diffraction study was carried out to probe possible changes in the local magnetization. The resolution of the neutron instrument is lower than that of a synchrotron diffractometer and proved insufficient to distinguish either the directions of the magnetic moments or the rhombohedral splitting. All neutron data were accordingly refined in a cubic setting. Profiles were collected over the MPB in TDF65. In the refinements, thermal broadening parameters coupling to the peak widths were found to climb rapidly with increasing temperature as the MPB region is entered, before resuming a normal slow rise with temperature above the coexistence region. This is consistent with enhanced accommodation strain in the MPB region. Magnetic moments were refined for the rare earth and iron sites simultaneously, yielding values of at the rare earth site and for the iron. These remain invariant within experimental error across the MPB [Fig. 3(b)].
In Fig. 1 we compare the phase boundary determined from our synchrotron XRD and DC magnetometry measurements with previous results on the magnetic moment directions deduced from Mössbauer spectra Atzmony1977 . The agreement between the three datasets is excellent. It is revealing to see to what extent these observations can be explained by single ion crystal field theory Callen1965and1966 ; Koon1978 ; Martin2006 ; Bowden2004 . In Fig. 1 we plot, as background shading, the magnetic easy-axis direction determined by minimizing the free energy consisting of magnetocrystalline anisotropy terms , , , , including a phenomenological correction to model the leading-order magnetostrictive effects Koon1978 . The magnetostriction and ’s are temperature dependent, and are presumed to vary linearly with composition, following relations of the form . The ’s for the parent compounds TbFe2 and DyFe2 were calculated in Ref. Martin2006, . At temperatures K, the observed location of the MPB is coincident with the model predictions (Fig. 1), though elsewhere the agreement is not as good.
The single ion model explains the extended nature of the transition in easy axis from to at the MPB. However we will see that the temperature dependence of the transition width is not accounted for. In the model, the spin reorientation occurs in two steps as illustrated by cuts at constant composition (Fig. 4). Throughout, the easy axis is found to be of -type. The first step is a second-order transition out of the phase with the easy axis rotating continuously with either temperature or composition. This step is linked to the first-order magnetocrystalline term transiting from positive to negative. Continuous reorientations are permitted since and are non-zero, accounting for the easy-axis directions away from principal crystal axes observed at low temperatures Atzmony1977 ; Atzmony1976 . The second step in the reorientation is a first-order transition to , exhibiting a discontinuity in the easy-axis direction.
The softening anisotropy at the phase boundary is anticipated to yield a maximum in the susceptibility, and indeed this is seen by adding a term in the free energy that couples to the applied field . The calculated polycrystalline is maximal at the first-order transition rather than at the second-order transition (Fig. 4), consistent with the proposition that a discontinuity in the ferroic order at the MPB is prerequisite for enhanced properties LiuLi2011 . This can be borne in mind when comparing the experimental with the structural data [Fig. 3(b)], in particular noting that the optimal point for magnetomechanical device applications lies in the higher temperature part of the MPB region (Fig. 1) Clark1985 . In this part of the phase diagram, two ideal effects coincide: the high striction of the rhombohedral majority phase combined with the softened anisotropy of the MPB region.
With increasing MPB temperature, the single ion model predicts a diminishing width of the reorientation region following the shrinking of the second-order region (Fig. 4). This is in sharp contrast with experiment, where an increasing width of the structural coexistence region is observed. We find that atomic diffusion, which might be anticipated to be significant at elevated temperatures, provides a negligible contribution in accounting for the broadened MPB character. At 500 K in TDF the Fe diffusion rate cm2s-1 based on the reported Co diffusion in Co69Nb31 which also exhibits a C15 Laves phase structure Denkinger2000 . Taking a scenario of 3 hours at 500 K, the average diffusion distance nm, a negligible value compared to the TDF lattice constant of 0.73 nm.
To understand the differences between MPBs in ferromagnets and ferroelectrics, one must consider the governing energies. The MPBs in ferroelectrics are thought to consist of nano-twinned meso-structures in which the polarization changes continuously as a function of the twin concentration as the boundary is traversed Wang2006and2007 ; Rossetti2008andKhachaturyan2010 . In other words, their structure is elastically controlled and not expected to be strongly temperature dependent. For MPBs in ferromagnets the situation is rather different. Here the magnetic polarization is determined by a balance of exchange and magnetocrystalline anisotropy energies. The latter has two components: atomic shape (crystal field) and magnetoelastic anisotropies. The atomic shape component from single ion theory Callen1965and1966 and dominates at low temperatures. The magnetoelastic component can be estimated by single ion theory, yielding reasonable descriptions of the temperature dependences observed in TbFe2 Clark1977 , DyFe2 Bowden2004 , and in TDF (see e.g. Ref. Clark1985, for ). is seen to fall off more slowly with temperature Callen1965and1966 ; Clark1985 ; Clark1977 , becoming dominant at high temperatures. With these contrasting dependences in mind, it is not surprising that the MPB behavior is temperature dependent. In terms of a free energy functional of the magnetic easy-axis direction, the wider phase coexistence region can be understood in terms of a flatter energy landscape at higher MPB temperatures CullenUnpub . There the magnetocrystalline anisotropies evanesce such that the free energy wells of the and easy axes become more shallow; orientational entropy will then co-populate these minima over a broader thermal region.
In conclusion, we have performed magnetometry, synchrotron XRD and neutron diffraction on Tb1-xDyxFe2 alloys, focusing on the MPB region in the temperature range 200 K to 350 K pertinent to applications. We have compared our observations with single ion crystal field theory. The latter indicates that there are two distinct transition regions: the first, at lower temperatures, consists of a continuous rotation of the magnetic easy axis stabilized by higher order anisotropy terms and . The second is a first-order region that increasingly dominates the MPB at elevated temperatures (Fig. 4). Our synchrotron XRD profiles are consistent with a first-order transition with continously varying volume fractions between two structural phases. The coexistence region broadens as the MPB moves to higher temperatures (Fig. 1). This contrasts with expectations from single ion theory and furthermore with the MPB character in ferroelectrics. The high-temperature broadening of ferromagnetic MPBs can be understood in terms of diminishing magnetocrystalline anisotropies and associated entropic effects. More advanced theory and experimental studies are called for to complete the microstructural picture.
The authors would like to thank Denis Sheptyakov and Lukas Keller for assistance in obtaining preliminary diffraction patterns at the Swiss Spallation Neutron Source SINQ. ML acknowledges support from DanScatt. Use of the Advanced Photon Source at Argonne National Laboratory was supported by the U.S. Department of Energy, Office of Science, Office of Basic Energy Sciences, under Contract No. DE-AC02-06CH11357. A portion of this research at ORNL’s Spallation Neutron Source was sponsored by the Scientific User Facilities Division, Office of Basic Energy Sciences, U.S. Department of Energy. This work was sponsored by NSF under grant DMR D 1206397 and benefited from DOE grant DESC0005448.
References
- (1) B. Jaffe, R. S. Roth, and S. Marzullo, J. Appl. Phys. 25, 809 (1954).
- (2) W. Liu and X. Ren, Phys. Rev. Lett. 103, 257602 (2009); M. C. Ehmke, S. N. Ehrlich, J. E. Blendell, and K. J. Bowman, J. Appl. Phys. 111, 124110 (2012).
- (3) B. Jaffe, W. R. Cook, and H. Jaffe, Piezoelectric Ceramics (Academic Press, London, 1971); S. Gorfman, D. S. Keeble, A. M. Glazer, X. Long, Y. Xie, Z.-G. Ye, S. Collins, and P. A. Thomas, Phys. Rev. B 84, 020102(R) (2011); R. G. Burkovsky et al., Phys. Rev. Lett. 109, 097603 (2012).
- (4) B. Noheda, J. A. Gonzalo, L. E. Cross, R. Guo, S.-E. Park, D. E. Cox, and G. Shirane, Phys. Rev. B 61, 8687 (2000); R. S. Solanki, A. K. Singh, S. K. Mishra, S. J. Kennedy, T. Suzuki, Y. Kuroiwa, C. Moriyoshi, and D. Pandey, Phys. Rev. B. 84, 144116 (2011).
- (5) K. A. Schönau, L. A. Schmitt, M. Knapp, H. Fuess, R.-A. Eichel, H. Kungl, and M. J. Hoffmann, Phys. Rev. B 75, 184117 (2007).
- (6) Y. U. Wang, Phys. Rev. B 76, 024108 (2007); ibid. 73, 014113 (2006).
- (7) Y. M. Jin, Y. U. Wang, A. G. Khachaturyan, J. F. Li, and D. Viehland, Phys. Rev. Lett. 91, 197601 (2003); G. A. Rossetti, A. G. Khachaturyan, G. Akcay, and Y. Ni, J. Appl. Phys. 103, 114113 (2008); A. G. Khachaturyan, Philos. Mag. 90, 37 (2010).
- (8) A. Y. Borisevich et al., Nature Comm. 3, 775 (2012); H. Wu et al., J. Appl. Phys. 112, 052004 (2012).
- (9) A. Khachaturyan and S. Priya, in Proceedings of the MRS Spring Meeting, San Francisco, 2013 (to be published).
- (10) S. Yang et al., Phys. Rev. Lett. 104, 197201 (2010).
- (11) U. Atzmony, M. P. Dariel, and G. Dublon, Phys. Rev. B 15, 3565 (1977).
- (12) A. E. Clark and D. N. Crowder, IEEE Trans. Mag. 21, 1945 (1985).
- (13) A. C. Larson and R. B. Von Dreele, Los Alamos National Laboratory, Report No. LAUR 86-748 (2000); B. H. Toby, J. Appl. Cryst 34, 210 (2001).
- (14) J. Rodriguez-Carvajal, Physica B 192, 55 (1993); T. Roisnel and J. Rodriguez-Carvajal, Materials Science Forum 378–381, 118 (2001).
- (15) S. Yang and X. Ren, Phys. Rev. B 77, 014407 (2008).
- (16) B. Barbara, J. P. Giraud, J. Laforest, R. Lemaire, E. Siaud, and J. Schweizer, Physica B 86, 155 (1977).
- (17) E. Callen and H. B. Callen, Phys. Rev. 139, A455 (1965); H. B. Callen and E. Callen, J. Phys. Chem. Solids 27, 1271 (1966).
- (18) N. C. Koon and C. M. Williams, J. Appl. Phys. 49, 1948 (1978).
- (19) K. N. Martin, P. A. J. de Groot, B. D. Rainford, K. Wang, G. J. Bowden, J. P. Zimmermann, and H. Fangohr, J. Phys. Condens. Matter 18, 459 (2006).
- (20) G. J. Bowden, P. A. J. de Groot, J. D. O’Neil, B D. Rainford, and A. A. Zhukov, J. Phys. Condens. Matter 16, 2437 (2004)
- (21) U. Atzmony and M. P. Dariel, Phys. Rev. B 13, 4006 (1976).
- (22) Y. Y. Liu and J. Y. Li, Phys. Rev. B 84, 132104 (2011).
- (23) M. Denkinger and H. Mehrer, Phil. Mag. A80, 1245 (2000).
- (24) A. E. Clark, R. Abbundi, H. T. Savage, and O. D. McMasters, Physica B 86–88, 73 (1977).
- (25) J. Cullen (to be published).