Optical Spectrum of MoS2: Many-body Effects and Diversity of Exciton States
Abstract
We present first-principles calculations of the optical response of monolayer molybdenum disulfide employing the GW-Bethe Salpeter equation (GW-BSE) approach including self-energy, excitonic, and electron-phonon effects. We show that monolayer MoS2 possesses a large and diverse number of strongly bound excitonic states with novel k-space characteristics that were not previously seen experimentally or theoretically. The absorption spectrum is shown to be dominated by excitonic states with binding energy close to eV and by strong electron-phonon broadening in the visible to ultra-violet range. Our results explain recent experimental measurements and resolve inconsistencies between previous GW-BSE calculations.
pacs:
73.22.-f, 71.35.-y, 78.67.-nAtomically thin structures of layered materials, such as graphene and transition-metal dichalcogenides, are of great interest in condensed matter physics due to their remarkable electronic properties and applicability in nanoscale devicesMak et al. (2010); Splendiani et al. (2010); Radisavljevic et al. (2011); Yoon et al. (2011). In this category of two-dimensional (2D) systems, monolayer molybdenum disulfide (MoS2) has recently gained attention for combining an electron mobility comparable to graphene with a finite energy gapRadisavljevic et al. (2011). Unlike its bulk form, which is an indirect gap semiconductor, monolayer MoS2 has a direct gap at the and points in the Brillouin zone, as a result of inversion symmetry breaking in its honeycomb lattice structureMak et al. (2010); Splendiani et al. (2010).
As a 2D material, MoS2 is expected to have strong excitonic effects, which will influence its optical properties. Thus, it is important to accurately calculate and understand the many-electron properties of MoS2. One common approach to compute quasiparticle band structure and optical response including electron-electron interactions and excitonic contributions is the GW plus Bethe Salpeter equation (GW-BSE) approachHybertsen and Louie (1986); Rohlfing and Louie (1998); Benedict et al. (1998); Albrecht et al. (1998). This method has been applied with success to a wide variety of materialsLouie (2006), including systems with reduced dimensionality such as grapheneYang et al. (2009) and nanotubesSpataru et al. (2004); Deslippe et al. (2007). Recent GW calculations of the quasiparticle band structure of MoS2, however, have reported conflicting findings. Previous work based on the quasiparticle self-consistent GW (QSGW)Cheiwchanchamnangij and Lambrecht (2012) and one-shot G0W0Ramasubramaniam (2012) methods conclude that MoS2 has a direct band gap, as also deduced from optical absorption and photoluminescence experimentsMak et al. (2010); Splendiani et al. (2010). On the other hand, a more recent work using the self-consistent (sc) GW0 approach claims that MoS2 has an indirect gap at the G0W0 level, while self-consistently updating the Green’s function changes it to a direct gapShi et al. (2013). There is also significant disagreement on the optical excitations calculated at the GW-BSE level, with the BSE results based on the previous G0W0 calculationRamasubramaniam (2012) reporting only two bound exciton peaks while the results based on the sc-GW0 work find one extra peak at eV, with the positions of all the peaks being quite sensitive to the sampling of the Brillouin zoneShi et al. (2013).
Since the same GW-BSE formalism was used, these disagreements are not a shortcoming of the GW-BSE method itself, but rather an indication of a computationally challenging system. For instance, it was shown that a large number of bands () and a high energy cutoff () for the dielectric matrix are required whenever the quasiparticle wave functions involve localized states or when there is a significant difference between the characters of the valence band maximum (VBM) and the conduction band minimum (CBM) statesShih et al. (2010). These features are precisely present in MoS2, since the VBM at and have localized Mo and S and characters, while the CBM has a Mo character with a small contribution from S and Cao et al. (2012). Another issue is that accurate description of excitonic states requires fine k-space sampling, since the excitonic states are correlated bound states in real space.
| QP Gap at K | Effective Masses | Convergence Parameters | ||||
|---|---|---|---|---|---|---|
| E (eV) | m | m | k-grid | (eV) | ||
| Present Work (G1W0) | 2.84 | 0.37 | 0.21 | 12x12x1 | 476 | 6000 |
| QSGWCheiwchanchamnangij and Lambrecht (2012) | 2.76 | 0.35 | 0.44 | 8x8x2 | – | – |
| G0W0Ramasubramaniam (2012) | 2.82 | 0.60 | 0.54 | 6x6x1 | 272 | 96 |
| sc-GW0Shi et al. (2013) | 2.80 | 0.36 | 0.39 | 12x12x1 | 300 | 197 |
In this work, we calculate the quasiparticle band structure and optical spectrum of MoS2 from first principles, taking special care to obtain well-converged results to within 0.1 eV. We predict that the absorption spectrum of MoS2 has very rich additional physics in the region between the energies of the first two bound exciton states and energies close to the quasiparticle gap. To explore this region, we perform a comprehensive analysis of the effect of k-space sampling on the existence and convergence of bound exciton solutions to the BSE. In particular, we discovered a series of optically active exciton states with novel characteristics (e.g., annular k-space wave functions) not seen in previous calculations, and we identify multiple excited states of the first set of bound excitons and their respective intra-exciton transition energies. These new states of diverse character are necessary for a conceptual and quantitative understanding of experimental absorption spectraMak et al. (2010) and recent time-resolved photoluminescence spectraLagarde et al. (2013). Furthermore, the unusually large number and diverse character of bound excitons in MoS2 suggest that it could be an excellent candidate for exploring inter- and intra-excitonic processes.
In this study, we first perform mean-field calculations of MoS2 using density functional theory (DFT) in the local density approximation (LDA) using the Quantum Espresso codeGiannozzi et al. (2009). The GW calculations are performed with the BerkeleyGW packageDeslippe et al. (2012). We calculate the dielectric matrix and the self-energy with a truncated Coulomb interactionIsmail-Beigi (2006) on a 12x12x1 k-grid to converge our quasiparticle gap to within eV.
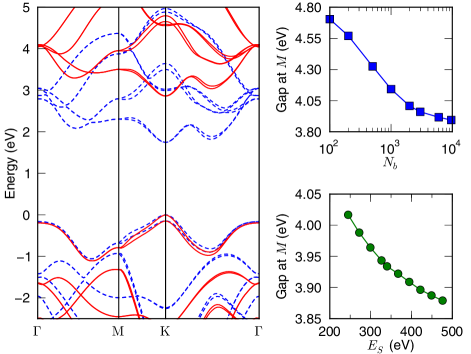
We find it necessary to employ a significantly higher energy cutoff of eV for the dielectric matrix than those values reported in previous calculations. We also need to include bands111Throughout this paper, the number of bands will always refer to the number of spin-orbit bands, i.e., the number of bands in our spin-unpolarized calculation., which is more than an order of magnitude more than any previous calculation, in calculating both and the self-energy . With these parameters, we converge the valence and conduction bands to within better than eV of accuracy. We also stress that and are not two independent convergence parameters. Thus, attempting to converge with an unconverged may lead to false convergence behaviorShih et al. (2010). In Fig. 1, we show the convergence behavior of the quasiparticle band gap at M, illustrating the importance of having adequate values for both and . In Table 1 we compare our convergence parameters and results with those in the literature.
In Fig. 1, we compare our DFT-LDA and GW band structures. We find that MoS2 is a direct gap semiconductor at both the LDA and G0W0 levels. The LDA gap is 1.74 eV and the G0W0 gap is 2.78 eV at both the and points. Performing one self-consistent update for G increases the gap to 2.84 eV. An additional self-consistent step changes the gap by less than 20 meV, so we stop at at the G1W0 level. Spin-orbit (S-O) coupling splits the valence band at the point by 146 meV. These S-O and band gap values at K are in good agreement with a previous QSGWCheiwchanchamnangij and Lambrecht (2012) and G0W0Ramasubramaniam (2012) calculations. However, we find different values for the effective mass of the charge carriers at K. Values for quasiparticle gap and effective masses from our calculation and previous calculations are reported in Table 1. Values for the DFT-LDA gap and S-O splitting are reported in the Supplemental Material222See Supplemental Material at [url] for additional details on the computational details, convergence parameters, inclusion of S-O coupling, and quasiparticle lifetimes..
| Optical Transition Energies (eV) | Convergence Parameters | ||||||||
| A | B | A’ | B’ | C | Eb | k-grid | Nv | Nc | |
| Present Work (G1W0) | 1.88 | 2.02 | 2.20 | 2.32 | 2.54 | 0.96 | 72x72x1 | 7 | 8 |
| Absorp. Exp.Mak et al. (2010) | 1.88 | 2.03 | – | – | – | – | – | – | – |
| PL Exp. Splendiani et al. (2010) | 1.85 | 1.98 | – | – | – | – | – | – | – |
| G0W0-BSERamasubramaniam (2012) | 1.78 | 1.96 | – | – | – | 1.04 | 6x6x1 | 2 | 4 |
| sc-GW0-BSEShi et al. (2013) | 2.22 | 2.22 | 2.5 | 2.5 | – | 0.63 | 15x15x1 | 6 | 8 |
Next, we consider the absorption spectrum of MoS2. In order to calculate the excitation spectrum including electron-hole interactions, we solve the Bethe-Salpeter equation for the electron-hole amplitudeRohlfing and Louie (1998, 2000). The matrix elements of the BSE Hamiltonian are first calculated on a 12x12x1 k-grid and subsequently interpolated onto a much finer 72x72x1 k-grid, which is then diagonalized to yield the exciton states and the resulting absorption spectrum.
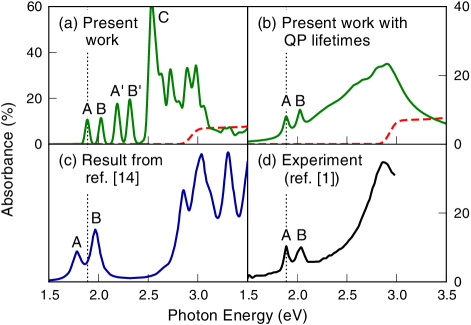
The absorption spectra for MoS2 with and without electron-hole interactions are displayed in Fig. 2 (a). We find that there is a large exciton binding energy of 0.96 eV for the lowest energy exciton, and the first peak in the absorption spectrum is split into two peaks by spin-orbit coupling. We will follow the notation used in the experiment paperMak et al. (2010) and refer to these two peaks as A and B and the next three lowest energy peaks we label as A’, B’, and C respectively. In our calculation, peaks A and B are located at 1.88 and 2.02 eV. This is in good agreement with experimental absorption peaks at 1.88 and 2.03 eVMak et al. (2010). A previous G0W0-BSE calculationRamasubramaniam (2012) also obtains agreement with experimental results for the positions of peaks A and B. However, we see multiple additional peaks in the absorption spectrum at photon energies between the energy of peak B at 2 eV and the quasiparticle gap at 2.8 eV, which were not seen before.
In order to obtain accurate absorption spectra, it is important to pay attention to the converge properties of the Bethe-Salpeter equation. There are two important factors that come into the BSE Hamiltonian: the number of Bloch bands and the number of k-points. We find that the spectrum converges quickly with the number of bands included, with just the 2 highest valence and 4 lowest conduction bands being sufficient. Going up to 7 valence and 8 conduction bands does not affect the optical spectrum up to eV. However, we find that the accurate position of peaks A and B and the existence of higher energy peaks are very sensitive to the number of k-points used in the BSE. As the number of k-points increases, there are numerous qualitative changes in the absorption spectrum (see Fig. 3 (a) and the Supplemental Material for details).
We sample up to 120x120 k-points and find that the peak positions and features are converged to better than eV only on a 72x72 k-grid, as shown in Fig. 3 (a). If we coarsen our k-grid from 72x72x1 to 12x12x1, the spectrum changes qualitatively, and we observe only one additional peak between 2.0 and 2.8 eV. Further decreasing k-point sampling to a 6x6x1 k-grid red-shifts the spectrum by as much as 1 eV. Thus, we believe that previous calculationsRamasubramaniam (2012); Shi et al. (2013) are not converged with respect to k-point sampling, and the agreement between peak position for A and B and experimental results found in Ref. Ramasubramaniam (2012) is likely accidental. In Fig. 2, we emphasize that the additional bound exciton peaks that arise in the converged calculation are necessary to reproduce features in the experimental absorption spectrum above 2 eV.
Next, we show that the apparent discrepancy in the fine features between our calculated absorbance spectrum in Fig. 2 (a) and experimentMak et al. (2010) in Fig. 2 (d) is actually a signature of lifetime effects due to electron-phonon interactions, which we can take into account. It was shown that the quasiparticle scattering rate in MoS2 due to electron-phonon interactions is highly dependent on the quasiparticle energies, exhibiting a sudden increase when the quasi-electrons have enough energy to emit an optical phonon ( meV)Li et al. (2013). We incorporate this quasiparticle lifetime broadening in our absorption spectrum following Ref. Marini (2008), and the result is plotted in Fig. 2 (b). We consider both emission and absorption of phonons at K, and we extrapolate the scattering rate for quasiparticle energies larger than those computed in Ref. Li et al. (2013) (see Supplemental Material). With this approach, it is quite remarkable that the first two peaks (A, B) in Fig. 2 (b) remain relatively sharp, while the higher-energy peaks coalesce into a much broader blob, in good agreement with experiment, which shows large absorption in the energy range above 2 eV 333We found this procedure to be robust and it is not much dependent on our approximation to extrapolate the scattering rate, as discussed in the Supplemental Material.. This feature cannot be explained by the existence of just the A and B states only. This also suggests that the optical properties of MoS2 may be altered by tuning the electron-phonon interactions, such as by employing mechanical strain or dielectric screening.
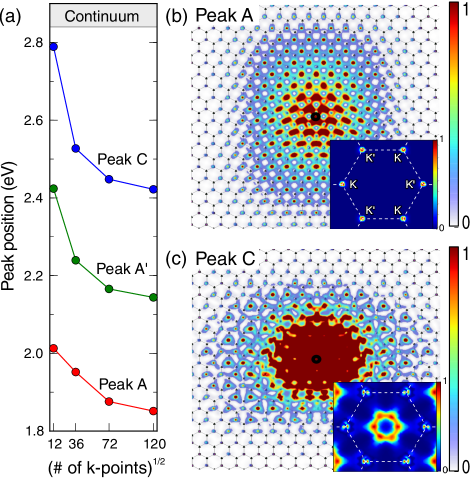
We look now at the character of the excitons giving rise to the low-energy peaks (A, B, A’,B’, and C) in the absorption spectrum. Peak A is made up of two energetically degenerate excitons formed, respectively, from free electron-hole transitons at the and valleys (Fig. 3 (b) inset). The wave functions of these two excitons look identical in real space. In Fig. 3 (b), we show the modulus squared of the real-space exciton wave function when the hole is fixed near a Mo atom. The character of the exciton corresponding to peak A reflects the Mo d orbitals of the states in the lowest MoS2 conduction band. The envelope of the exciton wave function is nearly azimuthally symmetric, resembling the state in a 2D hydrogenic model. The root mean square radius of the exciton in real space is 1 nm. Since spin is a good quantum number at and Xiao et al. (2012), the spatial components of the spinor wave functions for the spin-orbit split bands are identical at and . Thus, since peaks A and B are made up of transitions between the spin-orbit split valence band and the lowest conduction band at and , the exciton wave functions corresponding to peak B is identical to that of peak A. The two next lowest energy peaks, near 2.2 eV, which we refer to as peaks A’ and B’, are also spin-orbit split states of excitons localized near the and valleys in momentum space. These excitons have wave functions with a single node structure in k-space and are excited states of the exciton states forming peaks A and B (not shown). The excitons forming peaks A’ and B’ are six-fold degenerate, corresponding to the three degenerate 2s and 2p states in a 2D hydrogen model, multiplied by the two valleys of K and K’. There is also a cluster of six nearly-dark excitons near 2.35 eV (referred to as A”, not shown), which are the second excited states of the excitons forming peak A, and a third set of excited states at 2.60 eV, which hybridizes slightly with the excitons forming peak C. We emphasize here that although we use the notations (e.g. “2s”) of the 2D hydrogen model to refer to the states, our GW-BSE exciton spectrum is completely different from that of a standard 2D hydrogen model (see Fig. 3 in the Supplemental Material).
Next, we look at the character of the states forming the large peak C near 2.5 eV in Fig. 2 (a), which is plotted in Fig. 3 (c). We emphasize that this is the first time this peak has been seen in a theoretical or experimental study. The peak comes from six nearly-degenerate exciton states made from transitions between the highest valence band and the first three lowest conduction bands near, but not directly at , reflecting the fact that the lowest transitions are degenerate at multiple points near (Fig. 1). When the sum of the k-space modulus squared of the six excitons is plotted (inset Fig. 3 (c), we see that it is indeed located in a ring with six-fold symmetry around the point, with some small contributions from points near and . This set of excitons has finely structured contributions from different parts of momentum space, which explains the need for a fine k-point sampling to converge the optical absorption spectrum, and may also explain why previous studies with coarse k-point sampling did not observe this peak. When these excitons are plotted in real space, with the hole fixed near a Mo atom, the electron has both Mo and S and character, with more S character near the hole. The real-space envelope of the C peak excitons has near azimuthal symmetry and a mean squared radius of 0.5 nm.
In conclusion, we have performed first-principles calculations of the quasiparticle band structure and excitonic properties of MoS2 with many-body effects included. We identify and analyze the character of exciton peaks in the optical spectrum, many of which have not been experimentally or theoretically observed, and predict that the region in the optical spectrum between 2.2 and 2.8 eV is not featureless, but contains many bright and dark excitonic states which are broadened by electron-phonon interactions. This suggests that variations in temperature, dielectric screening, and mechanical strain could affect the optical absorption in this region of the spectrum. Also, the predicted features associated with the higher energy excitonic states may be enhanced and thus observed in experiment at reduced temperature and/or through modulation techniques such as electro-modulation spectroscopy. The large number and diverse character of excitons in the energy window between 2.2 and 2.8 eV suggests that MoS2 is an ideal system for probing both inter-exciton transitions (e.g. between A and C) and intra-exciton transitions (e.g. between A, A’, and A”), using methods such as pump-probe spectroscopy and two-photon experiments.
We thank M. Jain, A. Ramasubramaniam, and T. Cao for discussions. D. Y. Q. acknowledges support from the NSF Graduate Research Fellowship Grant No. DGE 1106400. F. H. J. acknowledges partial support from the Office of Naval Research under the MURI program. Structural study and the work on calculating the electron-phonon interaction effects on the optical spectra were supported by NSF Grant No. DMR10-1006184. The GW-BSE calculations were supported by the Theory Program at the Lawrence Berkeley National Lab through the Office of Basic Energy Sciences, U.S. Department of Energy under Contract No. DE-AC02-05CH11231. S. G. L. acknowledges support of a Simons Foundation Fellowship in Theoretical Physics. This research used resources of the National Energy Research Scientific Computing Center, which is supported by the Office of Science of the U.S. Department of Energy.
References
- Mak et al. (2010) K. F. Mak, C. Lee, J. Hone, J. Shan, and T. F. Heinz, Phys. Rev. Lett. 105, 136805 (2010).
- Splendiani et al. (2010) A. Splendiani, L. Sun, Y. Zhang, T. Li, J. Kim, C.-Y. Chim, G. Galli, and F. Wang, Nano Lett. 10, 1271 (2010).
- Radisavljevic et al. (2011) B. Radisavljevic, A. Radenovic, J. Brivio, V. Giacometti, and A. Kis, Nat. Nanotechnol. 6, 147 (2011).
- Yoon et al. (2011) Y. Yoon, K. Ganapathi, and S. Salahuddin, Nano Lett. 11, 3768 (2011).
- Hybertsen and Louie (1986) M. S. Hybertsen and S. G. Louie, Phys. Rev. B 34, 5390 (1986).
- Rohlfing and Louie (1998) M. Rohlfing and S. G. Louie, Phys. Rev. Lett. 81, 2312 (1998).
- Benedict et al. (1998) L. X. Benedict, E. L. Shirley, and R. B. Bohn, Phys. Rev. Lett. 80, 4514 (1998).
- Albrecht et al. (1998) S. Albrecht, L. Reining, R. Del Sole, and G. Onida, Phys. Rev. Lett. 80, 4510 (1998).
- Louie (2006) S. G. Louie, in Conceptual Foundations of Materials: A Standard Model for Ground- and Excited-State Properties, Contemporary Concepts of Condensed Matter Science, edited by S. G. Louie and M. L. Cohen (Elsevier, Amsterdam, 2006) p. 9.
- Yang et al. (2009) L. Yang, J. Deslippe, C.-H. Park, M. L. Cohen, and S. G. Louie, Phys. Rev. Lett. 103, 186802 (2009).
- Spataru et al. (2004) C. D. Spataru, S. Ismail-Beigi, L. X. Benedict, and S. G. Louie, Phys. Rev. Lett. 92, 077402 (2004).
- Deslippe et al. (2007) J. Deslippe, C. D. Spataru, D. Prendergast, and S. G. Louie, Nano Lett. 7, 1626 (2007).
- Cheiwchanchamnangij and Lambrecht (2012) T. Cheiwchanchamnangij and W. R. L. Lambrecht, Phys. Rev. B 85, 205302 (2012).
- Ramasubramaniam (2012) A. Ramasubramaniam, Phys. Rev. B 86, 115409 (2012).
- Shi et al. (2013) H. Shi, H. Pan, Y.-W. Zhang, and B. I. Yakobson, Phys. Rev. B 87, 155304 (2013).
- Shih et al. (2010) B.-C. Shih, Y. Xue, P. Zhang, M. L. Cohen, and S. G. Louie, Phys. Rev. Lett. 105, 146401 (2010).
- Cao et al. (2012) T. Cao, G. Wang, W. Han, H. Y. C. Zhu, J. Shi, Q. Niu, P. Tan, E. Wang, B. Liu, and J. Feng, Nature Commun. 3, 887 (2012).
- Lagarde et al. (2013) D. Lagarde, L. Bouet, X. Marie, C. Zhu, B. Liu, T. Amand, and B. Urbaszek, arXiv:1308.0696 (2013).
- Giannozzi et al. (2009) P. Giannozzi, S. Baroni, N. Bonini, M. Calandra, R. Car, C. Cavazzoni, D. Ceresoli, G. L. Chiarotti, M. Cococcioni, I. Dabo, A. D. Corso, S. de Gironcoli, S. Fabris, G. Fratesi, R. Gebauer, U. Gerstmann, C. Gougoussis, A. Kokalj, M. Lazzeri, L. Martin-Samos, N. Marzari, F. Mauri, R. Mazzarello, S. Paolini, A. Pasquarello, L. Paulatto, C. Sbraccia, S. Scandolo, G. Sclauzero, A. P. Seitsonen, A. Smogunov, P. Umari, and R. M. Wentzcovitch, J. Phys.: Condens. Matt. 21, 395502 (2009).
- Deslippe et al. (2012) J. Deslippe, G. Samsonidze, D. Strubbe, M. Jain, M. L. Cohen, and S. G. Louie, Comput. Phys. Commun. 183, 1269 (2012).
- Ismail-Beigi (2006) S. Ismail-Beigi, Phys. Rev. B 73, 233103 (2006).
- Note (1) Throughout this paper, the number of bands will always refer to the number of spin-orbit bands, i.e., the number of bands in our spin-unpolarized calculation.
- Note (2) See Supplemental Material at [url] for additional details on the computational details, convergence parameters, inclusion of S-O coupling, and quasiparticle lifetimes.
- Rohlfing and Louie (2000) M. Rohlfing and S. G. Louie, Phys. Rev. B 62, 4927 (2000).
- Marini (2008) A. Marini, Phys. Rev. Lett. 101, 106405 (2008).
- Li et al. (2013) X. Li, J. T. Mullen, Z. Jin, K. M. Borysenko, M. Buongiorno Nardelli, and K. W. Kim, Phys. Rev. B 87, 115418 (2013).
- Note (3) We found this procedure to be robust and it is not much dependent on our approximation to extrapolate the scattering rate, as discussed in the Supplemental Material.
- Xiao et al. (2012) D. Xiao, G.-B. Liu, W. Feng, X. Xu, and W. Yao, Phys. Rev. Lett. 108, 196802 (2012).