Multi-Wavelength Observations of PKS 214275 during Active and Quiescent Gamma-Ray States
Abstract
PKS 214275 (a.k.a. 2FGL J2147.47534) is a flat-spectrum radio quasar that was observed quasi-simultaneously by a suite of instruments across the electromagnetic spectrum during two flaring states in April 2010 and August 2011 as well as a quiescent state in December 2011 through January 2012. The results of these campaigns and model spectral energy distributions (SEDs) from the active and quiescent states are presented. The SED model parameters of PKS 214275 indicate that the two flares of the source are created by unique physical conditions. SED studies of flat spectrum radio quasars are beginning to indicate that there might be two types of flares, those that can be described purely by changes in the electron distribution and those that require changes in other parameters, such as the magnetic field strength or the size of the emitting region.
1 Introduction
Active galactic nuclei (AGN) are the brightest persistent sources of electromagnetic radiation in the Universe. They radiate intensely from low-energy radio waves to very-high-energy -rays and are known to be highly variable at all frequencies. Blazars are the most luminous and violently variable subclass of AGN. High and highly variable polarization has been detected in the radio and optical emission of blazars, and they are the most common type of AGN detected at GeV energies (Abdo et al., 2010a). Blazars have extended plasma jets, which can be detected at radio and, in a growing number of cases, at optical and X-ray frequencies as well111Lists of X-ray detected and optically-detected jets can be found at http://hea-www.harvard.edu/XJET/ and http://astro.fit.edu/jets/, respectively.. Observational data suggest that blazars are those radio-loud AGN whose jets are aligned at small angles with respect to the line of sight. In this scenario, the bulk relativistic motion of the emitting material results in “relativistic beaming”, i.e. both the luminosity and the variability of emission appear to be enhanced compared to what would be measured in the rest frame of the blazar (e.g., Urry & Padovani, 1995). The jets can show apparent superluminal motion in high resolution very long baseline interferometric (VLBI) radio images, a consequence of the jets pointing at a small angle to the line of sight. Blazars can be subdivided, based on their spectral features, into BL Lacertae (BL Lac) objects and flat spectrum radio quasars (FSRQs). BL Lac objects exhibit weak or no emission lines, while FSRQs show strong, broad emission lines (Urry & Padovani, 1995).
The SEDs of blazars show a characteristic “double-bumped” structure, with the lower frequency bump almost certainly originating from beamed electron synchrotron emission from the jet (Urry & Padovani, 1995). Aside from their classification based on their optical spectra, blazars are also classified based on their frequencies of peak synchrotron emission in a representation. Low-synchrotron peaked (LSP) blazars have at Hz; high-synchrotron peaked (HSP) blazars have Hz; and intermediate-synchrotron peaked (ISP) blazars have between and Hz (Abdo et al., 2010c). BL Lac objects can be any of the three classes; however almost all FSRQs are LSP blazars.
The origin of the higher frequency bump, peaking in rays, is less well understood. Two families of models attempt to describe them: leptonic and hadronic models (Böttcher, 2007). Leptonic models invoke a source of soft seed photons being Compton up-scattered to higher energies by relativistic electrons within the jet. The seed photon source could be synchrotron emission from the same electrons which scatter them (known as synchrotron self-Compton or SSC), or could be external to the jet (external Compton or EC). The accretion disk (Dermer et al., 1992), the broad line region (BLR; e.g., Sikora et al., 1994), the dust torus (Błażejowski et al., 2000), or even the cosmic microwave background (Böttcher et al., 2008) have all been considered as seed photon sources for EC processes. Hadronic models assume that a significant fraction of the jet power is converted into the acceleration of protons, so that the protons reach the threshold for pion production. The pions and their secondaries can thus create the -ray emission (Mannheim & Biermann, 1992). Protons at these high energies can also emit rays through synchrotron emission (e.g., Mücke et al., 2003).
Simultaneous flux density measurements of blazars at multiple wavelengths across the electromagnetic spectrum can allow us to distinguish among the many different high-energy emission models proposed (Böttcher, 2007). The launch of the Fermi Gamma Ray Space Telescope (Atwood et al., 2009) has created new opportunities for studying blazars at high energies. The Fermi/LAT (Large Area Telescope) is more sensitive and has better energy and spatial resolution than any previous telescope in the MeV–GeV energy range (Atwood et al., 2009). The LAT has put better constraints on blazar variability within its observing window and has shown that it is not unusual for blazars to exhibit fast variability on timescales of days or even hours at GeV energies (e.g., Saito et al., 2013). The LAT observes the entire sky every three hours, which makes it an ideal instrument on which to support multi-instrument observing campaigns on sources in response to their changing -ray state.
PKS 214275 is an FSRQ at a redshift of z1.139222At this redshift, using a cosmology with km s-1 Mpc-3, , and , PKS 214275 has a luminosity distance of Gpc. We use this for the source in this paper. (Jauncey et al., 1978). It is in the Second Fermi LAT Catalog as 2FGL J 2147.47534 (Nolan et al., 2012) with a flux of ph cm-2 s-1 in the 100 MeV to 100 GeV range, although it is not found in the First Fermi LAT Catalog (Abdo et al., 2010b).
The LAT first detected a flare from PKS 214275 on 2010 April 4 (MJD 55290), when the source reached a daily averaged flux of ph cm-2 s-1 (Wallace, 2010) in the 100 MeV to 300 GeV range. This flux represented an almost 3 order of magnitude increase over the average flux reported in the 2FGL catalog (Nolan et al., 2012). After the initial flare, this source was detected in a flaring state by the LAT in 2010 October to November and again in 2011 July to August.
During the latest flaring period in 2011, a multi-wavelength observing campaign was carried out using the Ceduna radio telescope, the Australia Telescope Compact Array (ATCA), Swift, the Rapid Eye Mount Telescope (REM), and LAT. These quasi-simultaneous data were complemented with simultaneous data from the ongoing SMARTS blazar monitoring program (Bonning et al., 2012). The data were used to construct a broadband SED of this object in its active state. We organized another quasi-simultaneous multi-wavelength campaign using the same instruments (except for the REM) during a quiescent -ray state in 2011 December - 2012 January. This is a particular strength of this work, as quiescent SEDs are often constructed with non-simultaneous data, which can compromise their utility. The simultaneous quiescent SED allowed us to determine which components of the SED were at elevated levels during the active state and provided insight into the dominant physical processes occurring at different wavelengths. We present these observations and the resulting SEDs from the active and quiescent states supplemented by a broadband SED constructed using archival data coincident with an earlier flare in 2010 April. All three SEDs were fit with physical models and the results and their implications for high-energy blazar emission are discussed. Throughout this paper we will refer to the 2010 April flare as flare A and the 2011 July-August flare as flare B. The luminosity of this source during flare A is ergs s-1 in the 100 MeV to 300 GeV energy range, which is comparable to the luminosity of some of the brightest flares detected by Fermi (Nalewajko, 2013). During the quiescent period the 100 MeV to 300 GeV luminosity is ergs s-1, which places PKS 214275 among the most luminous 2FGL FSRQs (Nolan et al., 2012).
2 LAT Observations
The LAT, on the Fermi spacecraft is a high-energy -ray detector with a wide field of view (% of the sky) covering the energy band from 20 MeV to greater than 300 GeV. It primarily operates in an all sky scanning mode, observing the entire sky every three hours. All LAT results presented here were obtained using the Fermi science tools (version 09-27-00) and the P7SOURCE_V6 instrument response functions (IRFs).
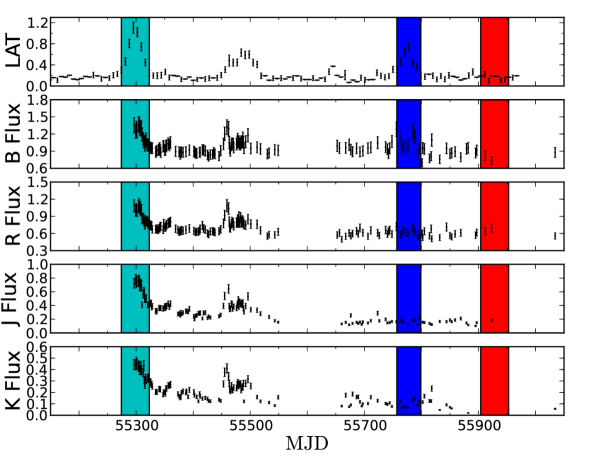
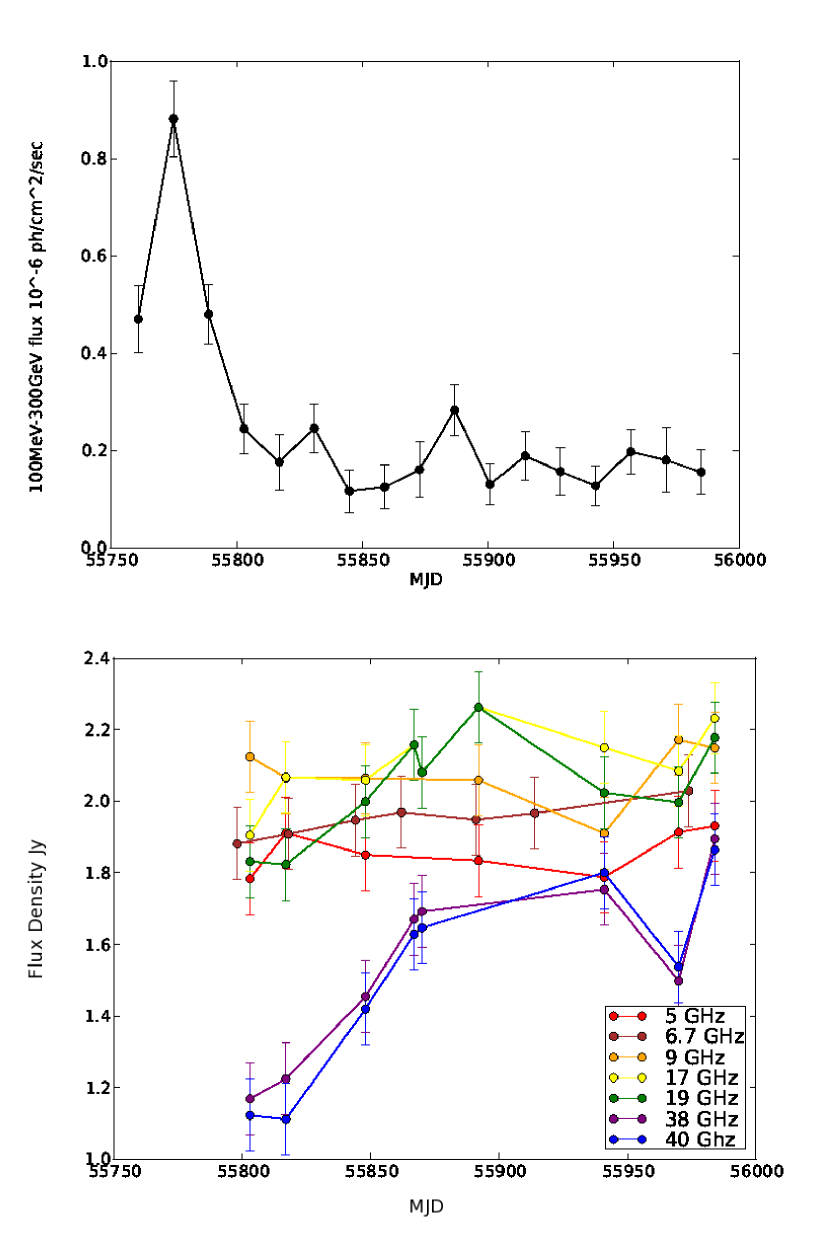
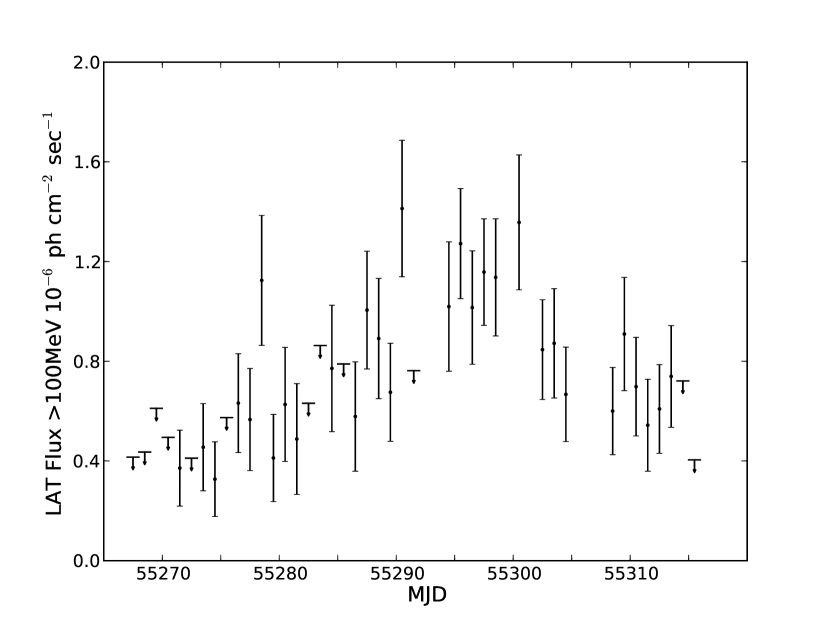
The light curve in the top panel of Figure. 1 shows the -ray flux of PKS 214275 in the 100 MeV to 300 GeV energy range averaged into weekly time bins; it was created as follows. A circular region of interest (ROI) of radius and “source” class events were selected for event reconstruction. Events above a zenith angle of were removed in order to minimize the contamination from photons produced by cosmic rays interacting with the Earth’s atmosphere. A rocking angle cut of was applied. The spectral index of the source was fixed to , the value computed in the 2FGL catalog (Nolan et al., 2012). Fitting of the spectral index with the low photon statistics present in 1 week of data proved to be unreliable. Sources within the 10 ROI in the XML model had fixed indices and free normalizations and sources that were outside the ROI had all spectral parameters fixed. Sources in the 2FGL catalog were used to define the model. The background model includes a Galactic diffuse emission component and an isotropic component, which are provided by the publicly available files gll_iem_v02_P7SOURCE.fit and isotropic iem_v02_P7SOURCE.txt333http://fermi.gsfc.nasa.gov/ssc/data/access/lat/BackgroundModels.html. The isotropic component accounts for the extragalactic diffuse emission and the residual charged-particle background. A power law correction to the Galactic diffuse background was not applied and the normalizations of the isotropic and Galactic diffuse backgrounds were fixed to one. This method yielded reasonable residuals for the fits in each individual time bin. The light curve begins on 2008 June 26 (MJD 54643) and ends on 2012 February 14 (MJD 55971). Upper limits on the source’s flux were calculated when the test statistic (TS; Mattox et al., 1996) for a given week was found to be less than 10. The light curve in Figure 2 was made using the same cuts on the data and the same model for the sources in and near the ROI, although the binning was changed to 2 weeks. The upper limit threshold is the same and the time range plotted is 2011 July 19 (MJD 55761) to 2012 March 13 (MJD 55999).
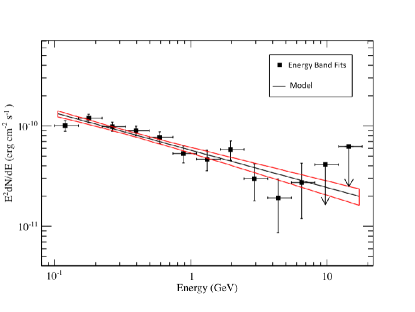
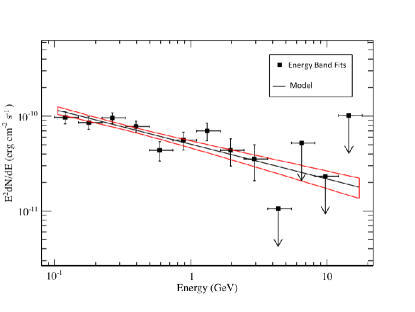
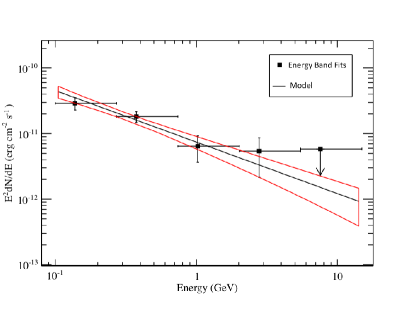
During flare A the source was observed by the Wide Field Infrared Survey Explorer (WISE) and SMARTS. We organized our first multi-wavelength campaign during flare B. Our second set of observations was carried out in 2011 December-2012 January in order to observe the source in a non-flaring state and obtain the quiescent SED. A LAT spectrum was created for each of these three periods by averaging and using the same cuts on the data and the same initial model parameters used for the light curve. The time ranges extending from 2010 March 10 (MJD 55265) to 2010 April 30 (MJD 55316) and 2011 July 21 (MJD 55763) to 2011 August 18 (MJD 55791) were chosen to define the flare A and flare B states because the source’s daily TS was above 25. The quiescent state was defined to be 2011 December 08 (MJD 55903) to 2012 January 26 (MJD 55952) because the source was not significantly detected in the 100 MeV to 300 GeV energy range on daily time scales, and this time range coincides with our observations at other wavelengths. For all time ranges an initial likelihood analysis was run over the full energy spectrum to evaluate the parameters for a power-law spectral model for the -ray emission. For the initial likelihood analysis the spectral index was left free so we could determine whether the spectrum changed during the different -ray states. The spectral index of the source in the 100 MeV to 300 GeV energy range was found to be during flare A, during flare B and during the quiescent state. Using the initial power law as a starting point, likelihood analysis was run again within each individual logarithmic energy bin fixing the spectral index to the value determined from the initial fit to the whole energy range. The bin sizes are different in the active state and quiescent state because significantly fewer photons are available during the quiescent state, which also limited the number of energy bins that could be computed. Upper limits on the target source’s flux were calculated when the TS within the energy bin was below 10. The -ray spectra are shown in Figure 3.
In order to estimate the variability timescale of PKS 214275, a light curve with 1 day bins for flare A was generated and can be found in Figure 4. On 2010 April 3-4 (MJD 55289-55290) the flux appears to double. Thus a variability timescale of the order of a day is justified. A similar variability timescale for flare B was found on 2011 July 29-30 (MJD 55771-55772).
3 Swift Observations
Swift is a multi-wavelength space-based observatory (Gehrels et al., 2004) that has three instruments: the Burst Alert Telescope (BAT), the UltraViolet and Optical Telescope (UVOT) and the X-Ray Telescope (XRT). Swift uses momentum wheels to rapidly change the direction in which it is pointing. The observatory’s primary objective is to observe -ray bursts, making its ability to slew rapidly a necessity; however this ability has become extremely useful for studying blazars due to their rapid variability.
Two observing campaigns with the UVOT and XRT instruments on board Swift were conducted on this object (which was too faint to be detected by BAT). The first series of observations ran from 2011 August 10 (MJD 55783) through 2011 August 23 (MJD 55796; flare B) while the second series ran from 2011 December 08 (MJD 55903) through 2011 December 21 (MJD 55916; quiescent state). Swift did not observe the source during flare A. The latest versions of the Swift data reduction software (07Jun2011_V6.11) and calibration data (caldb.indx20110725) were used in our analysis.
Ultraviolet and optical data were taken in the ‘filter of the day’ mode. During the first series of observations, the source was imaged with the , and filters with central wavelengths of 3465 Å, 2600 Å and 1928 Å respectively. During the second, the , and (center wavelength: 2246 Å) filters were used. Aperture photometry and coincidence loss corrections were made using the standard UVOT data reduction task UVOTSOURCE. Circular source and background regions of radius 10″ were used for the calibration. Magnitudes have been corrected for Galactic extinction using the method described in Fitzpatrick (1999). The extinction parameter was calculated from the column density using the method described in Predehl & Schmitt (1995). Uncertainties in the UV fluxes are predominantly determined by the de-reddening correction. For the , and filters we estimate a fairly conservative uncertainty of in final calculation of the flux. For the , and filters a higher uncertainty of is used because they overlap with a UV “bump” in the extinction curve, which is highly dependent on the line of sight and is therefore difficult to model.
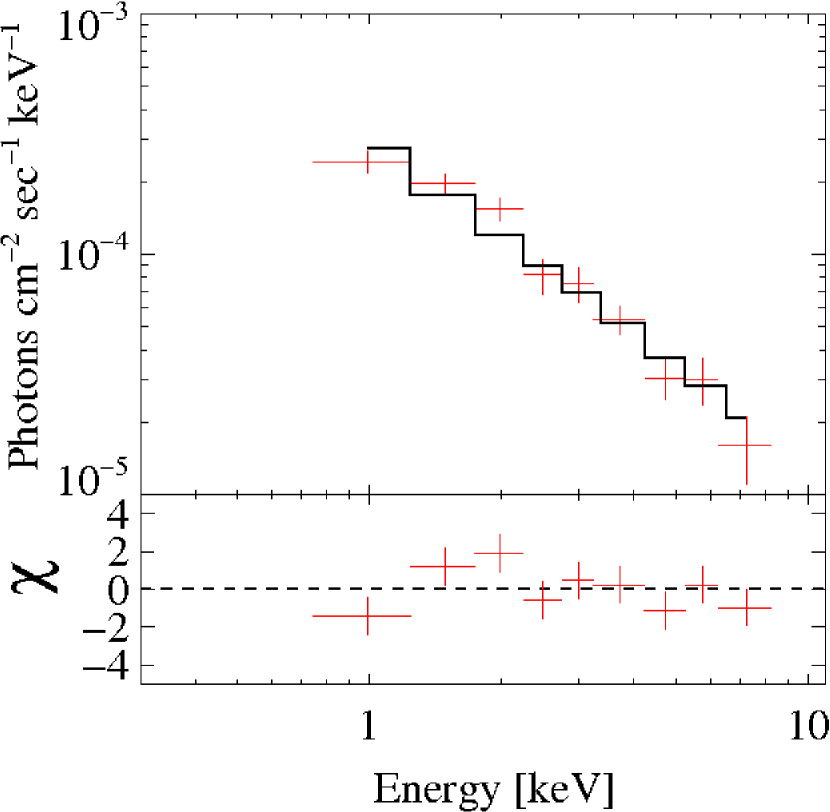
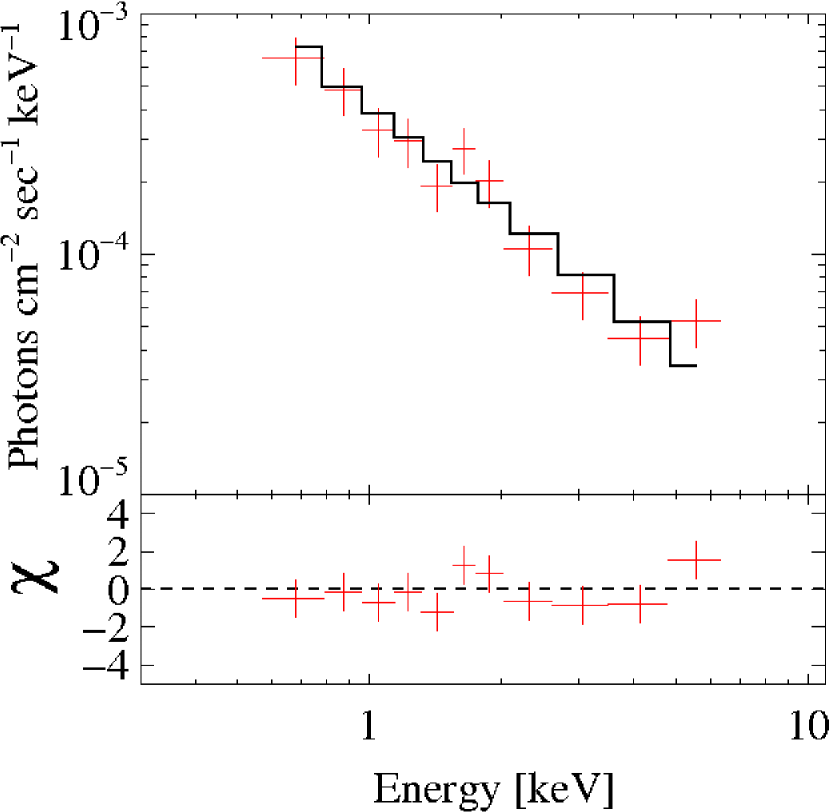
The XRT exposures from each series of observations were binned together resulting in total exposure times of 12 ks during flare B and 5 ks during the quiescent state (Figure 5). Circular source and background extraction regions of radii 60″ and 119″ were used for all pointings. For both observations the spectrum was determined using data in the keV range. The source emission was fit by an absorbed power law during both epochs using an column density of cm-2 from Galactic HI (Kalberla et al., 2005). We measured an X-ray spectral index of during flare B and during the quiescent state. The flux in the keV range during flare B is ( ergs cm-2 sec-1 and during the quiescent state the flux is ( ergs cm-2 sec-1. Therefore the variation observed between the two states is insignificant.
4 SMARTS Observations
The Small and Moderate Aperture Research Telescope System (SMARTS) carries out regular photometric monitoring of LAT sources of interest at optical and IR frequencies (Bonning et al., 2012)444http://www.astro.yale.edu/smarts/glast/home.php. PKS 214275 was regularly observed by the ANDICAM instrument mounted on the SMARTS 1.3 m telescope from 2010 April 10 (MJD 55296) to 2012 September 15 (MJD 56185). The results of the SMARTS monitoring of this source are displayed in Fig 1. ANDICAM is able to take optical and infrared data simultaneously with dichroic filters. A moveable mirror allows dithering in the IR while the optical exposure is in progress. The details of the data reduction are described in Bonning et al. (2012). The magnitudes are corrected for Galactic extinction using the extinction parameters derived from the recalibration (Schlafly & Finkbeiner, 2011) of the infrared-based dust maps reported in Schlegel et al. (1998). Magnitudes are converted into fluxes using the photometric zero points found in Frogel et al. (1978), Bessell et al. (1998) and Elias et al. (1982). Simultaneous photometric data points at , , and bands observed on 2010 April 13 (MJD 55299, flare A), 2011 August 12 (MJD 55785, flare B) and 2011 December 28 (MJD 55923, quiescent) are used in conjunction with our scheduled multi-wavelength observing campaigns for our SED fits.
5 Near Infrared Observations with REM
The Rapid Eye Mount (REM; Molinari et al., 2010) telescope is a 60 cm telescope observing in the infrared and optical wavebands. It is designed to react quickly to changes in the sky. It is located on the La Silla premises of the ESO Chilean Observatory making it ideal for observing highly variable southern sources (eg. Nesci et al. (2013)). Observations of PKS 214275, with an exposure time of 150 s, were made on 2011 August 10 (MJD 55923, flare B) shortly after the flare in -ray emission observed by LAT. To calibrate the data, 10 reference stars from the 2MASS catalog (Skrutskie et al., 2006) were used with magnitudes ranging from 11.10 to 14.9. The linear fit between instrumental and nominal magnitudes was always good, with a slope of nearly 1, and a dispersion of about 0.07 magnitude. Two NIR flux measurements of PKS 214275 were made, resulting in magnitudes of 15.05 0.16 in the band and 14.92 0.31 in the band. The errors reported are computed by IRAF/apphot and they are based on the Poisson statistics of the net counts and the detector noise: this method generally underestimates the actual error in the source’s magnitude. The source was rather faint for REM, so that the total net counts were rather low and the strongly structured background light leads to an additional error of 25–30% (0.3 magnitude) in the flux measurement. Our total error for the source flux is estimated to be 50% at both frequencies.
6 WISE Observations
The WISE (Wright et al., 2010) is a space based all sky infrared mapping mission. The cryogen cooled photometric survey occurred between 2009 January to 2010 October at 3.4–22 m. WISE has a 40 cm diameter mirror which sits inside a solid hydrogen cooled cryostat. WISE only made one observation of our target source, on 2010 April 13 (MJD 55299). By a fortunate coincidence, this observation occurred during a -ray flare of this object (flare A). These WISE data, at bands and , were obtained from the All-Sky Source Catalogue555http://irsa.ipac.caltech.edu/cgi-bin/Gator/nph-scan?mission=irsa&submit=Select&projshort=WISE.
7 Radio Observations
The radio data reported here were obtained from two different monitoring programs, one using the Australia Telescope Compact Array (ATCA) and the other using the Ceduna radio telescope. As part of the TANAMI (Tracking Active Galactic Nuclei with Austral Milliarcsecond Interferometry) program (Ojha et al., 2010), ATCA has been monitoring TANAMI sources at several radio frequencies (Stevens et al., 2012). ATCA data were reduced with the Miriad software package, following standard practices for continuum data. Flux densities were calibrated against PKS 1934638 for frequencies below 25 GHz, and against Uranus or PKS 1934638 for higher frequencies. One flux density measurement was made for each 2 GHz band, and represents the flux at the center frequency, assuming that the spectral index across the band does not vary. PKS 214275 was monitored roughly every three weeks by the ATCA since flare B. The results of the monitoring campaign are displayed in Fig. 2. Note the rise in the flux density at 38 and 40 GHz after flare B. For the SED fits, observations on 2011 August 30 (MJD 55803) and 2012 January 15 (MJD 55941) at frequencies of 5.5, 17, 19, 38, and 40 GHz were used for flare B and the quiescent period respectively.
The University of Tasmania operates a 30 m radio telescope at Ceduna in South Australia (e.g. McCulloch et al., 2005). This telescope has been monitoring TANAMI sources at 6.7 GHz typically once every two weeks. The data are collected in four scan blocks, two scans in right ascension and two in declination. A block is rejected if any of its scans fail a Gaussian fit. The data are corrected for gain-elevation effects, and a pointing correction is applied. PKS 1934638 is used as the primary flux density calibrator. Variation in system temperature due to ambient temperature changes over the course of 24 hours necessitates daily averaging of the data. The data used in the construction of the SEDs for flare B and the quiescent period were obtained on 2011 July 30 (MJD 55772) and 2011 December 15 (MJD 55910). No significant variation is observed at 6.7 GHz. Unfortunately we do not have radio data during flare A.
8 Results and Discussion
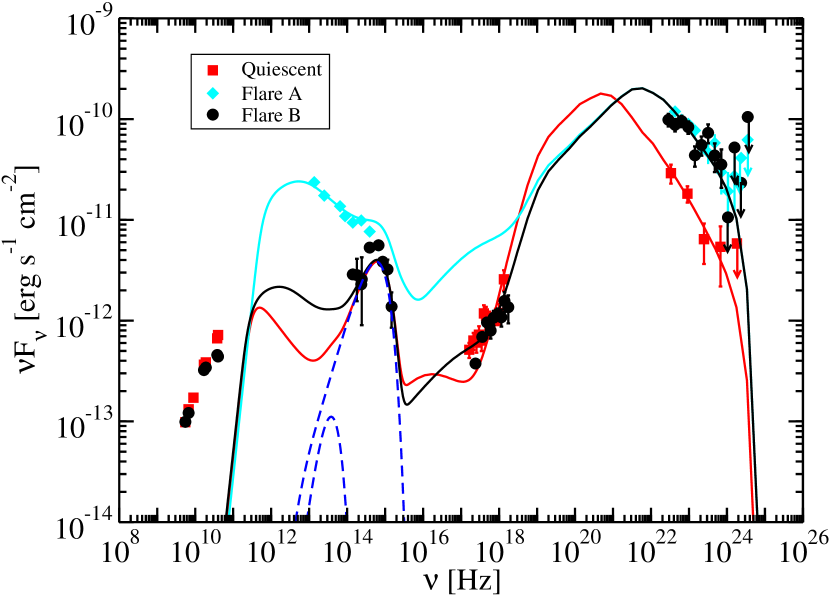
The results from each of our three data sets are plotted on the SEDs shown in Figure 6. A separate one zone leptonic model of blazar emission (Dermer et al., 2009) was fit for each distinct -ray state, and the values of the model parameters are presented in Table 1. This model assumes that the lower-frequency bump is non-thermal synchrotron radiation emitted by electrons that are isotropically oriented in the co-moving frame of the jet, in a tangled, randomly oriented magnetic field in the jet plasma. Radio emission from the core is thought to be a superposition of multiple jet components (Konigl, 1981) and is therefore treated as an upper limit for the purposes of our modeling. We consider SSC and EC processes when modeling the SED of PKS 214275, and we assume that EC scattering is the primary method by which -rays are produced. For PKS 214275, the size of the emission region is constrained by an upper limit on the variability timescale of 1 day derived from the -ray light curve displayed in Figure 4.
Correlations between -ray and optical flares with radio light curves and the rotation of optical polarization angles observed in other LSP blazars (Marscher et al., 2010) indicate that the -ray emitting region may be located outside the broad line region where the dust torus would be the dominant source of seed photons for external Compton scattering. Therefore, for PKS 214275 we assumed that inverse Compton scattering of dust torus photons is the primary method by which high-energy photons are produced. The dust torus was assumed to be a one-dimensional annulus oriented orthogonal to the jet directions. Its parameters were chosen to be consistent with the sublimation radius (Nenkova et al., 2008).
The lack of correlated variability between the -ray flux and the optical/UV flux in flare B and the quiescent state as well as the shape of the optical components of the SED during those two states is indicative of the accretion disk playing a role at those frequencies. Also a historical optical spectrum, which was used for the determination of the redshift (Jauncey et al., 1978) of this source, shows broad line emission. We assume that the accretion disk is an optically thick blackbody. The accretion disk parameters and black hole mass (Shakura & Sunyaev, 1973) were chosen to be consistent with the optical data in the flaring and quiescent states. The disk’s luminosity is =0.047 which is a fairly typical value for FSRQs (Ghisellini et al., 2011).
Flare A does exhibit correlated variability at optical wavelengths. For flare A the intensity of the magnetic field () in the model of the emitting region needs to be changed due to the more dramatic response from the synchrotron component of the spectrum. The IR fluxes measured by the SMARTS team are almost an order of magnitude greater than they were in flare B. In order to decrease the ratio of inverse Compton radiation to synchrotron radiation the magnetic field had to be increased from 0.3 G (its modeled value during flare B and the quiescent period) to 1.0 G. The magnetic jet power is an order of magnitude higher than it is during the quiescent state and flare B. This increase in the magnetic field allows the synchrotron flux to increase without having an effect on the inverse Compton spectrum. For flare A, our model predicts a significant X-ray flare from SSC emission. Unfortunately, no X-ray observations are available for that time. If no X-ray flare was observed, or if a smaller X-ray flare than predicted was observed, that would argue for a larger to reduce the SSC emission observed. The SEDs could be fit with a longer variability timescale, making the emission region less compact. This would decrease the SSC component, so that other parameters would need to be changed to fit the SEDs. For example, a combination of lower Doppler factor and higher dust luminosity should also allow a good fit in this scenario. This should also decrease the jet power in electrons, bringing the model closer to equipartition between electron and magnetic field energy density. However, this would contradict the short variability timescale found from the light curve (see Figure 4 and Section 2 above).
The electron distribution within the emitting region is described as a broken power law with indices below and above a break at and a low and high energy cutoff at a minimum and maximum Lorentz factor ( and , respectively). For our source, is not well constrained and is constrained by the -ray spectrum. During flares A and B increases from 100 (in the quiescent state) to 300, and the spectrum above hardens, with decreasing from 4.0 during quiescence to 3.7 during the active states. Somewhat counterintuitively, the jet power in electrons () decreases during the active states. This is because is lower during the quiescent state, and most of the power is below . The jet power in Poynting flux () is the same in the quiescent and flare B state, since the magnetic field, , does not change between them; however, it increases by more than a factor of 10 in the flare A state, due to the increase in .
For flare B we do not increase the magnetic field compared to the quiescent state. Only changes to the electron distribution function are needed. This is similar to results for PKS 0537441 (D’Ammando et al., 2013), where it was also found that only changes in the electron distribution were needed to describe three states of that source. That is because for the quiescent and flare B states of PKS 214275, the optical emission seems to be dominated by the accretion disk, and we have modeled it as such. This makes the synchrotron emission much less constrained. The results presented here are, therefore, much weaker than those of D’Ammando et al. (2013).
During all three states the magnetic and electron jet power are far from equipartition. This is different from other AGN that have been modeled in a similar manner (D’Ammando et al., 2012b, a, 2013). The jet power in electrons is much greater than the jet power in magnetic field during all three states. Jet powers are calculated assuming that the jet is two sided (Finke et al., 2008).
9 Conclusions
During flare A, PKS 214275 was observed with SMARTS, WISE and Fermi, which together provide strong constraints on the synchrotron component of the SED during that flare. During flare B, PKS 214275 was observed with the ATCA, the Ceduna radio telescope, REM, SMARTS, Swift and Fermi. To provide a baseline, another multi-wavelength observing campaign was mounted in 2011 December/2012 January when it was in a quiescent state. By measuring the brightness simultaneously at many wavelengths we have gained insight on some of the intrinsic parameters of this highly variable source.
We have shown that flare B can be explained by changing only the electron distribution relative to the quiescent state, while flare A requires changing an additional parameter, namely the magnetic field strength, . The two flares in PKS 214275 have very different behavior in the synchrotron component of the spectrum while showing similar behavior in the -ray component of the spectrum. Clearly, the same source can exhibit different behaviors for different flares. Referring to FSRQs in general, a picture where there are two types of flares seems to be emerging. One type of flare, like flare B in PKS 214275 and the flares in PKS 0537441 (D’Ammando et al., 2013), involves only a change in the electron distribution from the quiescent state. Another, like flare A in PKS 214275 and the flares in PKS 0208512 (Chatterjee et al., 2013), seem to require changes in other parameters, likely the magnetic field strength and perhaps also the size of the emitting region.
We have modeled the dominant physical process driving the luminosity of this source at different wavelengths. The optical and ultraviolet emission is primarily caused by thermal accretion disk emission during flare B and the quiescent state as evidenced by the shape of the optical SED, and the lack of correlated variability at optical and UV frequencies during these two different -ray states. Our model suggests the jet power in electrons is much greater than the jet power in the magnetic field. We have also seen that the synchrotron component can play a major role at optical wavelengths as is evidenced by flare A. We assumed that the primary method by which -rays are produced in PKS 214275 is by inverse Compton scattering of dust torus photons.
It should be noted that a number of the parameters in these three SED models are rather poorly constrained and observations are in progress or planned to refine the parameters and resolve some of the degeneracies in the one-zone leptonic model used in this work. As part of the TANAMI program (Ojha et al., 2010), we are currently gathering VLBI data on the source to potentially resolve the jet structure and track the kinematics of components within the jet. This may allow us to put additional constraints on the Doppler factor and resolve the degeneracy between Doppler factor and the magnetic field. Also, observations in the sub-millimeter regime (especially at the high frequency end of ALMA’s observing band Hz) will put important constraints on the emission mechanisms in this object.
10 Acknowledgements
We thank the Swift team for scheduling our Target of Opportunity requests. This research was funded in part by NASA through Fermi Guest Investigator grants NNH09ZDA001N and NNH10ZDA001N. This research was supported by an appointment to the NASA Postdoctoral Program at the Goddard Space Flight Center, administered by Oak Ridge Associated Universities through a contract with NASA. This publication makes use of data products from the Wide-field Infrared Survey Explorer, which is a joint project of the University of California, Los Angeles, and the Jet Propulsion Laboratory/California Institute of Technology, funded by the National Aeronautics and Space Administration. The Australia Telescope Compact Array is part of the Australia Telescope National Facility which is funded by the Commonwealth of Australia for operation as a National Facility managed by CSIRO. This research has made use of data from the NASA/IPAC Extragalactic Database (NED), operated by the Jet Propulsion Laboratory, California Institute of Technology, under contract with the National Aeronautics and Space Administration; and the SIMBAD database (operated at CDS, Strasbourg, France). T his research has made use of NASA’s Astrophysics Data System. This research has made use of the United States Naval Observatory (USNO) Radio Reference Frame Image Database (RRFID). This paper has made use of up-to-date SMARTS optical/near-infrared light curves that are available at www.astro.yale.edu/smarts/glast/home.php.
The Fermi LAT Collaboration acknowledges generous ongoing support from a number of agencies and institutes that have supported both the development and the operation of the LAT as well as scientific data analysis. These include the National Aeronautics and Space Administration and the Department of Energy in the United States, the Commissariat à l’Energie Atomique and the Centre National de la Recherche Scientifique / Institut National de Physique Nucléaire et de Physique des Particules in France, the Agenzia Spaziale Italiana and the Istituto Nazionale di Fisica Nucleare in Italy, the Ministry of Education, Culture, Sports, Science and Technology (MEXT), High Energy Accelerator Research Organization (KEK) and Japan Aerospace Exploration Agency (JAXA) in Japan, and the K. A. Wallenberg Foundation, the Swedish Research Council and the Swedish National Space Board in Sweden.
Additional support for science analysis during the operations phase is gratefully acknowledged from the Istituto Nazionale di Astrofisica in Italy and the Centre National d’Études Spatiales in France.
Facilities: ATCA, Ceduna Radio Observatory, Fermi, REM, Swift, SMARTS.
References
- Abdo et al. (2010a) Abdo, A. A., Ackermann, M., Ajello, M., et al. 2010a, ApJS, 188, 405
- Abdo et al. (2010b) —. 2010b, ApJS, 188, 405
- Abdo et al. (2010c) Abdo, A. A., Ackermann, M., Agudo, I., et al. 2010c, ApJ, 716, 30
- Atwood et al. (2009) Atwood, W. B., Abdo, A. A., Ackermann, M., et al. 2009, ApJ, 697, 1071
- Bessell et al. (1998) Bessell, M. S., Castelli, F., & Plez, B. 1998, A&A, 333, 231
- Błażejowski et al. (2000) Błażejowski, M., Sikora, M., Moderski, R., & Madejski, G. M. 2000, ApJ, 545, 107
- Bonning et al. (2012) Bonning, E., Urry, C. M., Bailyn, C., et al. 2012, ApJ, 756, 13
- Böttcher (2007) Böttcher, M. 2007, Ap&SS, 309, 95
- Böttcher et al. (2008) Böttcher, M., Dermer, C. D., & Finke, J. D. 2008, ApJL, 679, L9
- Chatterjee et al. (2013) Chatterjee, R., Fossati, G., Urry, C. M., et al. 2013, ApJL, 763, L11
- D’Ammando et al. (2012a) D’Ammando, F., Rau, A., Schady, P., et al. 2012a, MNRAS, 427, 893
- D’Ammando et al. (2012b) D’Ammando, F., Orienti, M., Finke, J., et al. 2012b, MNRAS, 426, 317
- D’Ammando et al. (2013) D’Ammando, F., Antolini, E., Tosti, G., et al. 2013, MNRAS, 431, 2481
- Dermer et al. (2009) Dermer, C. D., Finke, J. D., Krug, H., & Böttcher, M. 2009, ApJ, 692, 32
- Dermer et al. (1992) Dermer, C. D., Schlickeiser, R., & Mastichiadis, A. 1992, A&A, 256, L27
- Elias et al. (1982) Elias, J. H., Frogel, J. A., Matthews, K., & Neugebauer, G. 1982, AJ, 87, 1029
- Finke et al. (2008) Finke, J. D., Dermer, C. D., & Böttcher, M. 2008, ApJ, 686, 181
- Fitzpatrick (1999) Fitzpatrick, E. L. 1999, PASP, 111, 63
- Frogel et al. (1978) Frogel, J. A., Persson, S. E., Matthews, K., & Aaronson, M. 1978, ApJ, 220, 75
- Gehrels et al. (2004) Gehrels, N., Chincarini, G., Giommi, P., et al. 2004, ApJ, 611, 1005
- Ghisellini et al. (2011) Ghisellini, G., Tavecchio, F., Foschini, L., & Ghirlanda, G. 2011, MNRAS, 414, 2674
- Jauncey et al. (1978) Jauncey, D. L., Wright, A. E., Peterson, B. A., & Condon, J. J. 1978, ApJL, 219, L1
- Kalberla et al. (2005) Kalberla, P. M. W., Burton, W. B., Hartmann, D., et al. 2005, A&A, 440, 775
- Konigl (1981) Konigl, A. 1981, ApJ, 243, 700
- Mannheim & Biermann (1992) Mannheim, K., & Biermann, P. 1992, A&A, 253, L21
- Marscher et al. (2010) Marscher, A. P., Jorstad, S. G., Larionov, V. M., et al. 2010, ApJL, 710, L126
- Mattox et al. (1996) Mattox, J. R., Bertsch, D. L., Chiang, J., et al. 1996, ApJ, 461, 396
- McCulloch et al. (2005) McCulloch, P. M., Ellingsen, S. P., Jauncey, D. L., et al. 2005, ApJ, 129, 2034
- Molinari et al. (2010) Molinari, E., Covino, S., D’Alessio, F., et al. 2010, Ad. Ast., 2010, doi:10.1155/2010/253675
- Mücke et al. (2003) Mücke, A., Protheroe, R. J., Engel, R., Rachen, J. P., & Stanev, T. 2003, APh, 18, 593
- Nalewajko (2013) Nalewajko, K. 2013, MNRAS, 430, 1324
- Nenkova et al. (2008) Nenkova, M., Sirocky, M. M., Ivezić, Ž., & Elitzur, M. 2008, ApJ, 685, 147
- Nesci et al. (2013) Nesci, R., Tosti, G., Pursimo, T., Ojha, R., & Kadler, M. 2013, 555, A2
- Nolan et al. (2012) Nolan, P. L., Abdo, A. A., Ackermann, M., et al. 2012, ApJS, 199, 31
- Ojha et al. (2010) Ojha, R., Kadler, M., Böck, M., et al. 2010, A&A, 519, A45
- Predehl & Schmitt (1995) Predehl, P., & Schmitt, J. H. M. M. 1995, A&A, 293, 889
- Saito et al. (2013) Saito, S., Stawarz, Ł., Tanaka, Y. T., et al. 2013, ApJL, 766, L11
- Schlafly & Finkbeiner (2011) Schlafly, E. F., & Finkbeiner, D. P. 2011, ApJ, 737, 103
- Schlegel et al. (1998) Schlegel, D. J., Finkbeiner, D. P., & Davis, M. 1998, ApJ, 500, 525
- Shakura & Sunyaev (1973) Shakura, N. I., & Sunyaev, R. A. 1973, A&A, 24, 337
- Sikora et al. (1994) Sikora, M., Begelman, M. C., & Rees, M. J. 1994, ApJ, 421, 153
- Skrutskie et al. (2006) Skrutskie, M. F., Cutri, R. M., Stiening, R., et al. 2006, AJ, 131, 1163
- Stevens et al. (2012) Stevens, J., Edwards, P. G., Ojha, R., et al. 2012, ArXiv e-print 1205.2403, arXiv:1205.2403
- Urry & Padovani (1995) Urry, C. M., & Padovani, P. 1995, PASP, 107, 803
- Wallace (2010) Wallace, E. 2010, ATel, 2539, 1
- Wright et al. (2010) Wright, E. L., Eisenhardt, P. R. M., Mainzer, A. K., et al. 2010, AJ, 140, 1868
| Parameter | Symbol | Quiescent | Flare A | Flare B |
|---|---|---|---|---|
| Bulk Lorentz Factor | 30 | 30 | 30 | |
| Doppler Factor | 30 | 30 | 30 | |
| Magnetic Field [G] | 0.3 | 1.0 | 0.3 | |
| Variability Timescale [s] | ||||
| Comoving Blob radius [cm] | ||||
| Low-Energy Electron Spectral Index | 2.2 | 2.2 | 2.2 | |
| High-Energy Electron Spectral Index | 4.0 | 3.7 | 3.7 | |
| Minimum Electron Lorentz Factor | ||||
| Break Electron Lorentz Factor | ||||
| Maximum Electron Lorentz Factor | ||||
| Black hole mass [] | ||||
| Disk luminosity [erg s-1] | ||||
| Accretion efficiency | 1/12 | 1/12 | 1/12 | |
| Jet Height [cm] | ||||
| Dust temperature | ||||
| Dust luminosity [erg s-1] | ||||
| Dust Radius [cm] | ||||
| Jet Power in Magnetic Field [erg s-1] | ||||
| Jet Power in Electrons [erg s-1] |