Magnetism in nanoparticle
Abstract
(LCO) nanoparticles were synthesized and their magnetic and structural properties were examined using SQUID magnetometery and neutron diffraction. The nanoparticles exhibit ferromagnetic long-range order beginning at K that persists to low temperatures. This behavior is contrasted with the ferromagnetism of bulk LCO, which also starts at K but is suppressed below a second transition at K. The ferromagnetism in both systems is attributed to the tensile stress from particle surfaces and impurity phase interfaces. This stress locally increases the Co-O-Co bond angle . It has recently been shown that LCO loses long-range ferromagnetic order when decreases below the critical value ∘. Consistent with this model, we show that in nanoparticles remains larger than at low temperatures, likely a consequence of all spins being in close proximity to surfaces or interfaces.
The magnetism of (LCO) is well-known to be unusual. Both ferromagnetic and antiferromagnetic interactions have been proposed in the bulk material. Goodenough (1958); Androulakis et al. (2001) The dominant interaction above K is antiferromagnetic; however, in our previous study, we did not find evidence of antiferromagnetic ordering upon decreasing . Durand et al. (2013) We thus concluded that the antiferromagnetic interactions are strongly frustrated. We have also recently shown Durand et al. (2013) that weak ferromagnetic order occurs below K in small applied fields, Oe, yet is lost below K. Studies of LCO nanoparticles Fita et al. (2008); Zhou et al. (2009, 2007); Wei et al. (2012) and thin films Fuchs et al. (2007); Herklotz et al. (2009); Fuchs et al. (2008); Sterbinsky et al. (2012); Fuchs et al. (2009); Freeland et al. (2008); Park et al. (2009); Pinta et al. (2008); Posadas et al. (2011); Rata et al. (2010) also show the presence of a ferromagnetic phase transition near K, though these materials do not exhibit the same loss of ferromagnetic long-range order seen in bulk LCO below K.
The unusual low temperature magnetism in the bulk has been shown to correlate well with the behavior of the Co-O-Co bond angle, . Experimental measurements Durand et al. (2013) indicate that ferromagnetism only exists when is greater than a critical value , which happens only for . Above , all of the lattice parameters, including , show power-law behavior in . For , the lattice parameters show only a small, linear dependence. The existence of ferromagnetism only for is consistent with LCO thin film studies. Fuchs et al. (2008) Furthermore, recent band-structure calculations Lee and Harmon (2013) indicate that LCO is magnetic only for , where is a measure of the rhombohedral distortion of the lattice. For the measured LCO lattice parameters, corresponds to , which indicates excellent agreement between the calculations and experiments for bulk LCO. Thin film studies Fuchs et al. (2009); Rata et al. (2010); Posadas et al. (2011); Park et al. (2009); Freeland et al. (2008); Sterbinsky et al. (2012); Fuchs et al. (2008); Herklotz et al. (2009); Fuchs et al. (2007); Seo et al. (2012) have also found supporting evidence for a lattice distortion causing ferromagnetism. LCO material deposited on substrates that result in tensile strain show ferromagnetic order below K, and the strength of the net ferromagnetic moment increases with the value of . Based on the results of experiments on bulk LCO and LCO films grown on various substrates, a model has been proposed in which surface-induced lattice stress increases near the surfaces. Durand et al. (2013) This induces a transition to long-range ferromagnetic order at throughout the LCO lattice. For moments far from the surfaces, becomes lower than below K in bulk LCO. At these low temperatures the lattice loses ferromagnetic order, except near the surfaces where .
We extend our previous study on bulk LCO to nanoparticles using the same neutron scattering and magnetometry techniques. The lattice parameters for both materials were determined over a range of temperatures K, and the field-cooled and zero-field-cooled magnetization was tracked in fields of Oe and kOe. We show that nanoparticles of LCO exhibit a phase transition very close to the transition temperature found in bulk LCO. However, the magnetic order persists to low , sharply contrasting the bulk behavior where the ferromagnetism collapses below K. The ferromagnetic moment is much larger than in the bulk particles and continues to increase as the temperature decreases. We will show that these behaviors can be understood with the same Co-O-Co bond angle and surface-induced distortion model developed for the bulk behavior.
LCO nanoparticles were synthesized using the amorphous heteronuclear complex DTPA as a precursor, Zhu et al. (2000) using a method similar to that described in Ref. Jiang et al. (2009). A NaOH solution at 1.0 M concentration was added by drops to a mixture solution of and to prepare fresh hydroxides. A stoichiometric amount of NaOH was used to ensure complete reaction of the metal cations. The excess Na ions were then removed via dialysis over approximately 24 hours. Equimolar amounts of DTPA were then added to the metal hydroxides to synthesize the complex precursor. The mixture was stirred as it was heated to 80oC. The resulting transparent solution was vaporized slowly at 80oC until a dark purple resin-like gel formed. This precursor was decomposed in air at 350oC for 1.5 hours to burn off the organic components. The resulting ash-like material was then heated at a calcination temperature of 620oC for 4 hours.
Zero-field neutron diffraction measurements were carried out with the US/Japan wide-angle neutron diffractometer (WAND) at the Oak Ridge National Laboratory High Flux Isotope Reactor with = 1.48 Å using vanadium sample cans. Rietveld refinements were performed using FullProf. Rodriguez-Carvajal (1990) Small-angle x-ray scattering (SAXS) measurements to determine nanoparticle size and x-ray diffraction measurements were performed using a Rigaku SmartLab x-ray diffractometer. The magnetization, , was measured for kOe using a Quantum Design SQUID magnetometer.
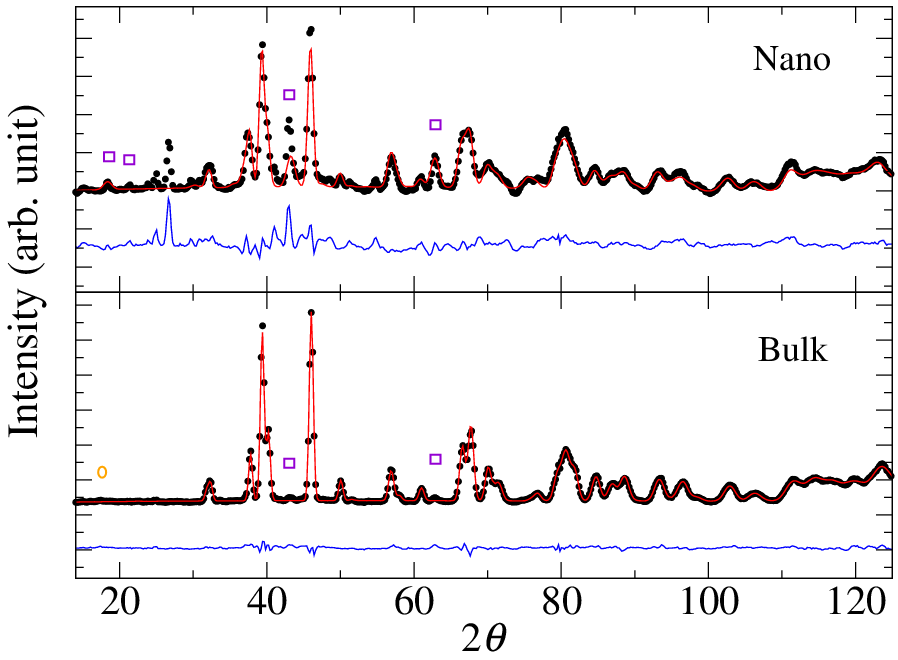
The neutron diffraction intensity is shown versus for the bulk and nanoparticle powders in Fig. 1 at K. Refinements were more difficult for the nanoparticles than for the bulk, likely due to a distribution of small, non-spherical particles which results in wider peaks that are difficult to model precisely. Noticeable Bragg peaks correspond to impurity phases that result from the low firing temperature used to create small LCO particles. The impurity phases will be addressed further below. SAXS measurements yield an average agglomerate particle size of 75 nm with standard deviation of 21 nm. A Debye-Scherrer analysis of the x-ray diffraction data yields LCO nanoparticle crystal sizes between 25-40 nm. Hence, we conclude that the LCO nanoparticle crystals agglomerate into larger particles during the heating process. No evidence of Bragg magnetic peaks in bulk or nanoparticles has been observed in experiments at WAND, which may be a consequence of the weak net FM moment.
The diffraction patterns for both the bulk and nanoparticle LCO show small peaks corresponding to a phase. The CoO phase observed in the bulk was not evident in the nanoparticles. Refinements indicate a weight fraction of in the nanoparticles. The effect of these phases on the bulk has been previously discussed Durand et al. (2013) and it applies similarly to the nanoparticles. In addition to the phase, there are also some Bragg peaks that were not identified as expected oxides of La or Co. When comparing the bulk to the nanoparticle patterns, the lattice structures of these phases appear distinct from that of the LCO bulk. Unless there were a significant amount of impurity peaks directly overlapping the LCO peaks, we would not expect them to significantly affect the quality of the LCO parameter refinements. The magnetization data do not show any unusual behavior which can be readily attributed to these impurity phases, although calculations of the average effective Co moment may reflect the presence of non-LCO phases.
Fitted lattice parameters and for the hexagonal unit cell are shown for K in Fig. 2 and are compared to previous results obtained for bulk LCO. The Co-O-Co bond angle (), and the parameter , where is the Co-O bond length, are also shown. The parameter describes the deviation of the oxygen position from the straight line connecting neighboring Co ions and characterizes the amount of rhombohedral distortion of the lattice. Ravindran et al. (1999); Durand et al. (2013); Mineshige et al. (1999) Although is a derived quantity from and , we include it in the fits so as to be consistent with other relevant papers which interpret their results in the context of . Lee and Harmon (2013); Durand et al. (2013)
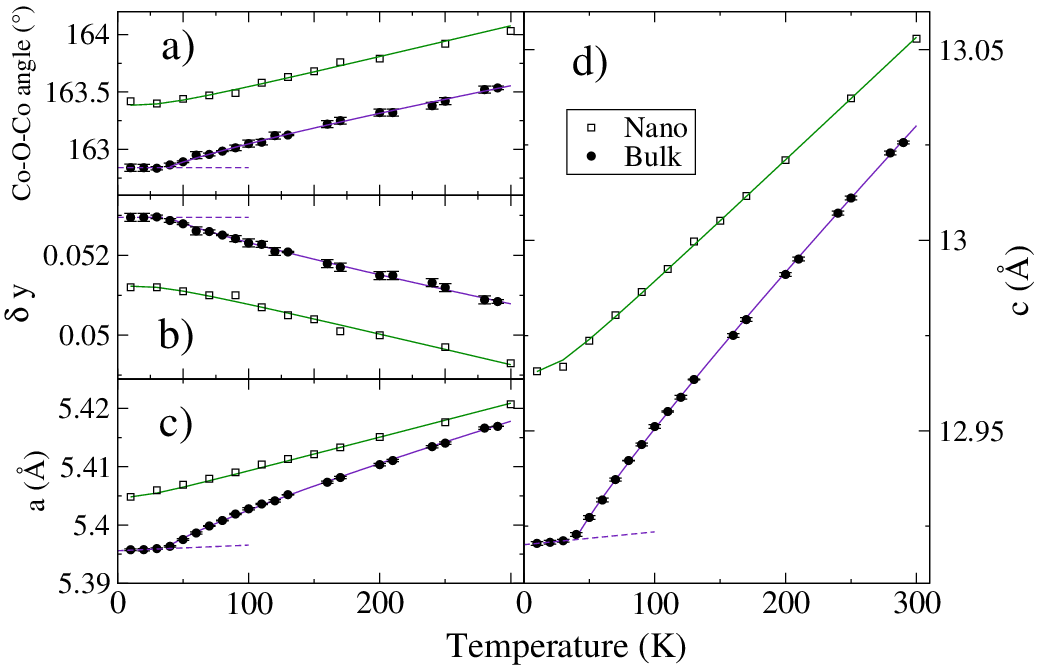
Contrasting the sharp changes observed near K in bulk LCO, , , and show no abrupt change in slope in the nanoparticles. The value of observed for the nanoparticles remains well above throughout the entire range of temperatures studied.
| Parameter | |||||
|---|---|---|---|---|---|
| a | 5.405(4) | 2.7 | 50.0 | ||
| c | 12.966(1) | 7.3 | 58.6 | ||
| 0.0512(1) | -7.5 | 98.7 | |||
| Co-O-Co () | 163.384(4) | 8.0 | 96.1 |
The temperature dependence of the nanoparticle lattice parameters were fit using the Gruneisen expression with the Einstein model for thermal lattice expansion,
| (1) |
where the lattice parameter being fit is , is its value at , is the Einstein temperature, and is the thermal expansion coefficient for . Caciuffo et al. (1999) The lattice parameters are well fit by the thermal expansion model, but is rather small and inconsistent among the various parameters. It is not surprising that data for lattice parameters that exhibit no sharp features can be fit by the simple temperature dependence of Eq. 1. No power-law behavior or phase transition is observed for nanoparticles, unlike the bulk LCO.
vs for the bulk and nanoparticles at Oe is shown in Fig. 3 a) and c). The nanoparticle magnetic phase transition occurs at nearly the same temperature as the bulk, indicating that the magnetism in both materials is of the same origin. The field-cooled (FC) and zero-field-cooled (ZFC) behaviors for both materials diverge just below . The nanoparticles show a much larger FC moment and a much larger difference between the FC and ZFC behaviors. The magnetization below a FM phase transition is expected to exhibit the power law behavior as the individual moments align with each other, where () and . Hence, we normally expect significant curvature below . However, the net moment in bulk LCO shows little curvature (). This likely reflects the very small net FM moment as well as either a decrease in the local moment size or the strength of the interaction between moments as decreases with temperature towards . Although the nanoparticle magnetization exhibits greater curvature with a value for fits over the range K, the curvature is still not as large as normally expected for a FM phase transition. The nanoparticle moments and interactions vary less than in the bulk, but the net FM moment remains small (though much larger than in the bulk). Overall, the rounding of the transition near and significant non-critical contributions well below preclude meaningful fits to the critical behavior.
The shapes of the ZFC curves in the bulk and nanoparticles show a similar paramagnetic-like tail below K, except that the nanoparticle moment appears to saturate at . Although the individual nanoparticles are fairly well ordered, there are likely moments at grain boundaries that contribute to the paramagnetic tail. The nanoparticle ZFC magnetization between K and is much larger than that of the bulk and probably represents randomly oriented net ferromagnetic moments of the nanoparticle grains which are not readily aligned by the applied field.
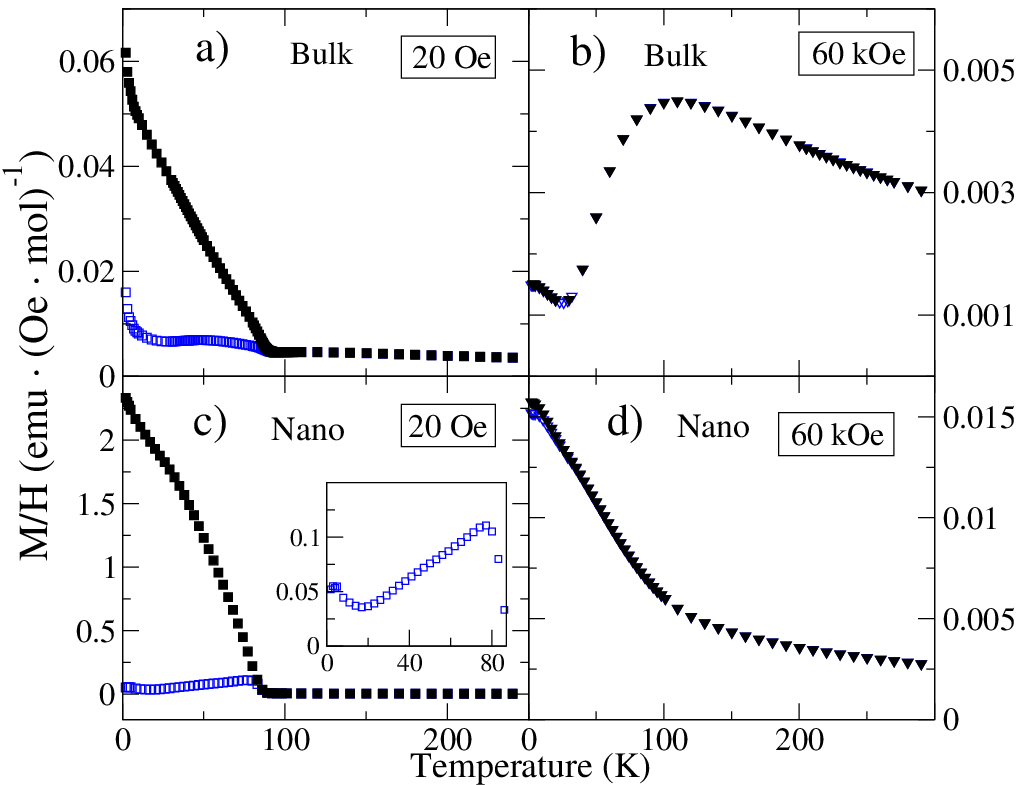
The nanoparticle behavior for kOe sharply contrasts that of the bulk particles. Whereas the bulk magnetization decreases with below K, with a minimum just below K (Fig. 3 b), the nanoparticle moment increases monotonically as dereases over the entire temperature range (Fig. 3 d). The transition is rounded for kOe because the critical point is at . However, there is a slight inflection point near , which is more clear from versus data shown in Fig. 4. This indicates a strong influence of the ferromagnetic interactions in high field. The bulk data indicate no such signifcant FM interaction at high fields, consistent with the small net ferromagnetic moment observed in the bulk and the disappearance of the ferromagnetism below the transition at .
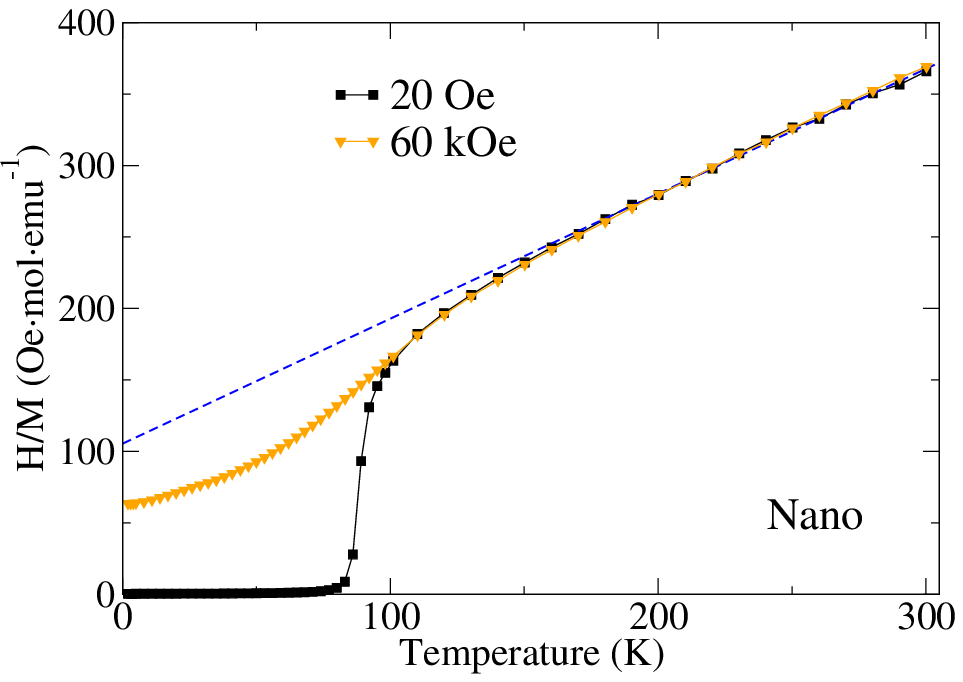
Figure 4 shows versus for the nanoparticles at kOe and Oe. The steep drop in with decreasing temperature beginning at K is indicative of ferromagnetism for Oe. The slight dip at the same temperature for kOe demonstrates that the ferromagnetic interactions are still significant. Data at both fields show nearly the same paramagnetic behavior above K. The straight line fit for K is interpreted as Curie-Weiss (CW) behavior using . We obtain a CW temperature K and Curie constant emuKmol-1 for the nanoparticles. This value of is consistent with K (CW calculations yield upper limits for transition temperatures) and suggests dominant antiferromagnetic interactions above K. Both values are similar to those obtained for bulk LCO, where and . Above the magnetic transition at K, the effective moment is per Co ion. This is smaller than the bulk value of . The less negative and smaller perhaps indicate that fewer moments are participating due to the less perfect crystallinity of the nanoparticle powder compared to the bulk. The impurities present in the nanoparticles may also contribute to an overestimation of the number of participating Co ions. A larger FM interaction in the nanoparticles could also result in a less negative . Notably, Fita et al. found an even smaller value of for their LCO nanoparticles, as well as a less negative of -48 K. Fita et al. (2008)
In several previous studies, the ferromagnetism in LCO nanoparticles has been attributed to ferromagnetic ordering of the surface, Yan et al. (2004); Harada et al. (2007) surface-induced lattice strain, Fita et al. (2008) and unit-cell expansion. Wei et al. (2012); Zhou et al. (2009) Yan et al. Yan et al. (2004) found that the magnetic susceptibility of their samples increased as the surface-to-volume ratio increased and attributed this to localized spins on the surface of the material. Although they ruled out double exchange between Co(III) and Co(IV) atoms as the mechanism for the surface ferromagnetism, their study was inconclusive as to the origin of the ferromagnetic interaction. Harada et al. Harada et al. (2007) found similar results; the magnetization increased with decreasing particle size and they suggested the source to be chemisorption of oxygen atoms at the surface. Again, the mechanism leading to ferromagnetism was not made explicit. Fita et al. Fita et al. (2008) examined the lattice parameters of LCO nanoparticles and found that they increase with decreasing particle size but did not identify surfaces as the source of ferromagnetism. Instead, they pointed to the surface-induced lattice expansion which persists throughout the material as the cause. In the above studies, LCO crystals and powders were synthesized using several different methods: floating-zone single-crystal synthesis, solid-state reaction, crushing the single-crystal into a powder, and a citric acid solution method. It is interesting to note that in all but one case, the magnetic susceptibility increased monotonically with surface area and the transition temperature remained fairly constant at K. Wei et al. Wei et al. (2012) found that their nanoparticles showed a decrease in magnetization and with particle size, despite also noting a similar increase in lattice parameters with the smaller sizes. It is possible that the citric acid sol-gel method employed in this case differed slightly from the one used by Harada et al., Harada et al. (2007) but it is unclear how that would produce results that differ qualitatively from the others.
Tensile stress from substrates allows LCO thin films to order ferromagnetically. The resulting FM order is found throughout the material for films of order 100 nm Fuchs et al. (2009) and the net moment increases with film thickness. Fuchs et al. (2007) In nanoparticles, all of the LCO material is well within 100 nm of a surface. Hence, tensile stress from these surfaces should result in a larger average for the particles, although the exact process by which the strain changes requires further investigation. Our experiments show that does remain well above for all (Fig. 2), which is consistent with the net FM moment being much larger than in bulk LCO and not collapsing below K. Note that the lowest value of in the nanoparticles is comparable to the bulk value for K, so we would expect the system to remain ferromagnetic for K in small . This model, which correlates the stability of ferromagnetism with the stress-induced increase in , is consistent with the observations made by most of studies noted above. The ferromagnetic transition at K is a result of the stress at surfaces, but long-range ferromagnetic order takes place throughout the LCO lattice. Only for bulk LCO is the long-range order observed to disappear below K because only in this system is observed to decrease below .
Although is a useful parameter by which to gauge the degree of magnetism in a sample, the mechanism by which it controls the ferromagnetism remains unclear. Calculations by Lee and Harmon indicate (closely related to ) to be the controlling parameter in LCO and note that the amount of rhombohedral lattice distortion determines whether the ground state is magnetic.Lee and Harmon (2013) According to this model, the degree of orbital overlap between the Co and O ions affects the balance between the repulsive Coulomb interaction and the exchange interaction: more distortion (and less overlap) leads to a non-magnetic ground state. Goodenough proposes that the local configurations of low-spin and high-spin Co3+ and Co4+ ions result in areas of ferromagnetism, antiferromagnetism, and paramagnetism.Goodenough (1958) It is also conceivable in this interpretation that the Co-O-Co bond angle affects the spin state of the Co ions or groups of ions by allowing for increased or decreased overlap of the cobalt and oxyen orbitals.
In summary, we have shown that, for K, the interaction strengths and paramagnetic behavior are comparable in bulk and nanoparticle LCO. On the other hand, the observed magnetic behaviors observed for K in LCO bulk and nanoparticles are very different. Nevertheless, the magnetic behaviors of bulk and nanoparticles can be modeled within the same framework; the interactions between spins in LCO are strongly dependent on the Co-O-Co bond angle . Magnetic order can only be sustained when is larger than a critical value ∘. In bulk LCO, this occurs only for , where K. For , magnetism in bulk LCO is associated only with regions of tensile stress near surfaces and interfaces with impurity phases. In LCO thin films and nanoparticles, all moments are near to surfaces so is always larger than and long-range ferromagnetic order is present for all K.
We thank Y. Abdollahian, F. Bridges, C. de la Cruz, A. Elvin, B. Harmon, J. Howe, S. Shastry, and N. Sundaram for helpful discussions andor assistance with measurements. The work at ORNL is supported by the DOE BES Office of Scientific User Facilities. Work at Lawrence Berkeley National Laboratory was supported by the Director, Office of Science (OS), Office of Basic Energy Sciences (OBES), of the U.S. Department of Energy (DOE) under Contract No. DE-AC02-05CH11231. Some X-ray data in this work were recorded on an instrument supported by the NSF Major Research Instrumentation (MRI) Program under Grant DMR-1126845.
References
- Goodenough (1958) J. B. Goodenough, J. Phys. Chem. Solids 6, 287 (1958).
- Androulakis et al. (2001) J. Androulakis, N. Katsarakis, and J. Giapintzakis, Phys. Rev. B 64, 174401 (2001).
- Durand et al. (2013) A. M. Durand, D. P. Belanger, C. H. Booth, F. Ye, S. Chi, J. A. Fernandez-Baca, and M. Bhat, J. Phys.: Condens. Matter 25, 382203 (2013).
- Fita et al. (2008) I. Fita, V. Markovich, D. Mogilyansky, R. Puzniak, A. Wisniewski, L. Titelman, L. Vradman, M. Herkowitz, V. Varyukhin, and G. Gorodetsky, Phys. Rev. B 77, 224421 (2008).
- Zhou et al. (2009) S. Zhou, L. He, S. Zhao, Y. Guo, J. Zhao, and L. Shi, J. Phys. Chem. C 113, 13522 (2009).
- Zhou et al. (2007) S. Zhou, L. Shi, J. Zhao, L. He, H. Yang, and S. Zhang, Phys. Rev. B 76, 172407 (2007).
- Wei et al. (2012) Q. Wei, T. Zhang, X. P. Wang, and Q. F. Fang, Eur. Phys. J. Appl. Phys. 57, 30401 (2012).
- Fuchs et al. (2007) D. Fuchs, C. Pinta, T. Schwartz, P. Schweiss, P. Nagel, S. Schuppler, R. Schneider, M. Merz, G. Roth, and H. v. Lohneysen, Phys. Rev. B 75, 144402 (2007).
- Herklotz et al. (2009) A. Herklotz, A. D. Rata, L. Schultz, and K. Dorr, Phys. Rev. B 79, 092409 (2009).
- Fuchs et al. (2008) D. Fuchs, E. Arac, C. Pinta, S. Schuppler, R. Schneider, and H. v. Lohneysen, Phys. Rev. B 77, 014434 (2008).
- Sterbinsky et al. (2012) G. E. Sterbinsky, P. J. Ryan, J.-W. Kim, E. Karapetrova, J. X. Ma, J. Shi, and J. C. Woicik, Phys. Rev. B 85, 020403 (2012).
- Fuchs et al. (2009) D. Fuchs, L. Dieterle, E. Arac, R. Eder, P. Adelmann, V. Eyert, T. Kopp, R. Schneider, D. Gerthsen, and H. v. Lohneysen, Phys. Rev. B 79, 024424 (2009).
- Freeland et al. (2008) J. W. Freeland, J. X. Ma, and J. Shi, Appl. Phys. Lett. 93, 212501 (2008).
- Park et al. (2009) S. Park, P. Ryan, E. Karapetrova, J. W. Kim, J. X. Ma, J. Shi, J. W. Freeland, and W. Wu, Appl. Phys. Lett. 95, 072508 (2009).
- Pinta et al. (2008) C. Pinta, D. Fuchs, M. Merz, M. Wissinger, E. Arac, H. v. Lohneysen, A. Samartsev, P. Nagel, and S. Schuppler, Phys. Rev. B 78, 174402 (2008).
- Posadas et al. (2011) A. Posadas, M. Berg, H. Seo, D. J. Smith, A. P. Kirk, D. Zhernokletov, R. M. Wallace, A. de Lozanne, and A. A. Demkov, Microelectronic Engineering 88, 1444 (2011).
- Rata et al. (2010) A. D. Rata, A. Herklotz, L. Schultz, and K. Dorr, Eur. Phys. J. B 76, 215 (2010).
- Lee and Harmon (2013) Y. Lee and B. N. Harmon, J. Appl. Phys. 113, 17E145 (2013).
- Seo et al. (2012) H. Seo, A. Posadas, and A. A. Demkov, Phys. Rev. B 86, 014430 (2012).
- Zhu et al. (2000) Y. F. Zhu, R. Q. Tan, T. Yi, S. S. Ji, X. Y. Ye, and L. L. Cao, J. of Mat. Sci. 35, 5415 (2000).
- Jiang et al. (2009) Y. Jiang, F. Bridges, N. Sundaram, D. P. Belanger, I. E. Anderson, J. F. Mitchell, and H. Zheng, Phys. Rev. B 80, 144423 (2009).
- Rodriguez-Carvajal (1990) J. Rodriguez-Carvajal, FULLPROF: A program for Rietveld refinement and pattern matching analysis, Powder Diffraction, satellite meeting of the XVth IUCr congress (1990).
- Ravindran et al. (1999) P. Ravindran, P. A. Korzhavyi, H. Fjellvag, and A. Kjekshus, Phys. Rev. B 60, 16423 (1999).
- Mineshige et al. (1999) A. Mineshige, M. Kobune, S. Fujii, Z. Ogumi, M. Inaba, T. Yao, and K. Kikuchi, J. Sol. St. Chem. 142, 374 (1999).
- Caciuffo et al. (1999) R. Caciuffo, D. Rinaldi, G. Barucca, J. Mira, J. Rivas, M. A. Senaris-Rodriguez, P. G. Radaelli, D. Fiorani, and J. B. Goodenough, Phys. Rev. B 59, 1068 (1999).
- Yan et al. (2004) J.-Q. Yan, J.-S. Zhou, and J. B. Goodenough, Phys. Rev. B 70, 014402 (2004).
- Harada et al. (2007) A. Harada, T. Taniyama, Y. Takeuchi, T. Sato, T. Kyomen, and M. Itoh, Phys. Rev. B 75, 184426 (2007).