Pre-neutron-emission mass distributions for reaction 232Th(n, f) up to 60 MeV
Abstract
The pre-neutron-emission mass distributions for reaction 232Th(n, f) up to 60 MeV are systematically studied with an empirical fission potential model. The energy dependences of the peaks and valleys of the pre-neutron-emission mass distributions are described by the exponential expressions based on the newly measured data. The energy dependence of evaporation neutrons before scission, which plays a crucial role for the reasonable description of the mass distribution, is also considered. Both the double-humped and triple-humped shape of the measured pre-neutron-emission mass distributions for reaction 232Th(n, f) are reasonably well reproduced at incident energies up to 60 MeV. The mass distributions at unmeasured energies and the critical energies at which the humped pre-neutron-emission mass distributions are transformed into each other are also predicted.
keywords:
232Th(n, f); Pre-neutron-emission mass distribution; evaporation neutron; fission potentialPACS:
24.75.+i; 25.85.Ec1 Introduction
The pre-neutron-emission mass distribution is one of the most important characteristics of the nuclear fission process. In nuclear energy applications, the composition of fission products must be known because they are accumulated during the operation of a nuclear reactor and influence physical and chemical properties of nuclear fuel. It is necessary to accurately describe and predict fission yields at different energies for a successful nuclear fission model. Due to the complex of fission process, it is still difficult to microscopically describe the mass splitting for neutron-induced fission at low and intermediate energies [1, 2, 3], though it is believed that the formation of the fission fragment-mass distribution is closely connected with the potential energy surface in deformation space [4, 5]. Nowadays, there is an increasing interest in studying neutron-induced fission of actinides at intermediate energies. It is motivated by nuclear data needs for new applications such as accelerator-driven system, thorium-based fuel cycle, and the next generation of exotic beam facilities. However, the data on fission fragment mass yields are scarce at neutron energies above 10 MeV, especially for reaction 232Th(n, f). Recently, the reaction 232Th(n, f) at intermediate energies was measured by V.D. Simutkin group [3, 6, 7]. Theoretical calculations for the pre-neutron-emission mass distributions is of great importance for understanding the fission process and for describing the measured yields of the fission products.
Compared with low-energy fission, neutron-induced fission at intermediate energies is more complicated due to the pre-equilibrium particle emission and neutron evaporation. There are several codes, such as MCFX [8], TALYS [9], UKFY4.1 [10], GEF2012/2.4 [11] and PYF [12], which can calculate the pre-neutron-emission mass distributions for reaction 232Th(n, f) at low or intermediate energies. Generally, the agreement between the experimental data and the mode calculations mentioned above is good for 238U but worse for 232Th at intermediate energies [3, 6, 7]. It can be obviously seen from the experimental data [3, 6, 7, 13, 14] that the pre-neutron-emission mass distributions for reaction 232Th(n, f) gradually change from double-humped to triple-humped shape with increasing the incident energies. In this work, we attempt to describe quantitatively both the double-humped and triple-humped pre-neutron-emission mass distributions for reaction 232Th(n, f) up to 60 MeV with an empirical fission potential.
2 Fission potential and its parameters
Assuming that a compound nucleus separates into a pair of daughter nuclei in the fission process, so the pre-neutron-emission mass distributions of intermediate energies neutron-induced 232Th fission can be approximately described by a simplified fission potential ,
| (1) |
Where is the normalization constant, and the variable denotes the mass number of the primary fragment. Considering the triple-humped mass distributions of intermediate energies neutron-induced 232Th fission, we describe the phenomenological fission potential by using five harmonic-oscillator functions (see Fig. 1), i.e.,
| (2) |
Where and are the positions for the peaks of the light and heavy fragments of the pre-neutron-emission mass distributions, and is the position of the symmetrical fission. and are the positions for the valleys of the light and heavy fragments of the pre-neutron-emission mass distributions, respectively. Considering that the fission potential is a smooth function, the coefficients in Eq. (2) can be derived as
| (3) |
The potential parameters and will be discussed later.

The total mass distributions of the binary fission fragments should be normalized to 200%. The normalization constant can therefore be analytically expressed as
| (4) |
with
| (5) |
where erf(x) and erfi(x) denote the error function and imaginary error function, respectively. We also assume that and , i.e., for the pre-neutron-emission mass distributions, the heights of the peaks and valleys of the light fragments equal those of the heavy fragments. So the parameter can be uniquely determined by the experimental data and the normalization constant .
In addition, the potential parameters and can be derived from the height of peaks and valleys, i.e.,
| (6) |
A particular attention should be payed to that these position parameters are closely relative to the evaporation neutrons before scission at different incident energies. For reaction 232Th(n, f) at low incident energies ( MeV), the pre-neutron-emission mass distributions show a double-damped shape, and the fission potential Eq. (1) will be simplified as the three harmonic-oscillator functions [1]. The positions and are obtained from the nucleus-nucleus driving potential of the fissile nucleus 233Th [1, 15, 16]. With increasing the incident neutron energy, the excitation energy of the compound nucleus will become higher, and a few neutrons will be evaporated before scission. The number of the evaporation neutron is empirically expressed as
| (7) |
Where, is the threshold energy for 232Th(n, f) reaction. It is assumed that a compound nucleus (mass number is ) after evaporating neutrons separates into a pair of daughter fragments in the fission process, and the mass number of the fissile nucleus is at different incident energy regions. For neutron induced 232Th fission, the fissile nuclei are 233Th, 232Th, 231Th, 230Th, 229Th and 228Th corresponding the reaction channels (n, f), (n, nf), (n, 2nf), (n, 3nf), (n, 4nf) and (n, 5nf), respectively. The position of the heavy fragment peaks, as well as of the light fragment peaks and of the symmetrical fission, should be modified as
| (8) |
Where denotes the lowest position of the driving potential derived from the ground state of the fissile nucleus [1].
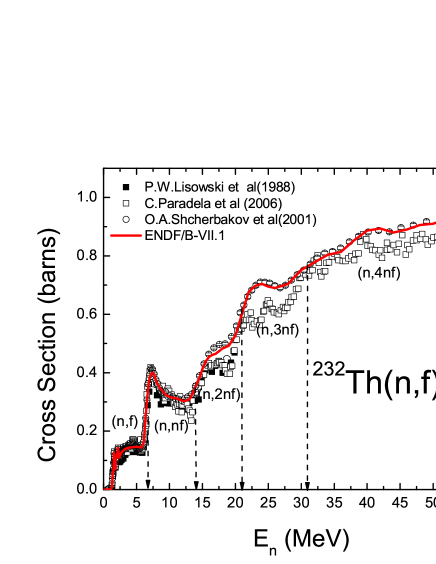
Additionally, the different incident energy intervals of Eq. (7) corresponding the evaporation neutron numbers are consistent with the fission cross sections for reaction n+232Th as shown in Fig. 3. The scattering dots denote the experimental data derived from Refs. [17, 18, 19], and the solid curve denotes the evaluated results of ENDF/B-VII.1. The dash lines denote the incident energy regions corresponding to the different multi-chance fission channels as labeled (n, f), (n, nf), (n, 2nf), (n, 3nf), (n, 4nf) and (n, 5nf), respectively.
For the triple-humped pre-neutron-emission mass distributions, the positions of the valleys and shown in Eq. (2) play an important role. Based on the quasi-monoenergetic experimental data [3, 6, 7], one can see that the width between the valleys increases with the incident energies, and its energy dependence can be reasonably well described with a parameterized formula
| (9) |
So the positions of the valleys and should be modified as
| (10) |
Based on the experimental data [3, 6, 7] of the reaction 232Th(n, f) up to 60 MeV, the energy dependence of heights of the peaks , and the valley is also exponentially expressed as
| (11) |
One can see that the values of , and exponentially change with the incident energies in general, which could provide some useful information at unmeasured energies.
3 Results and discussion
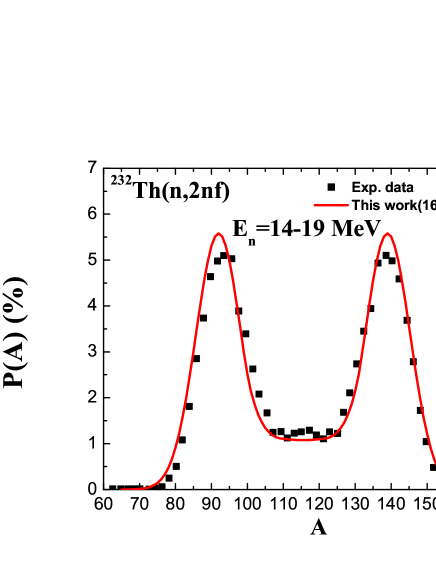
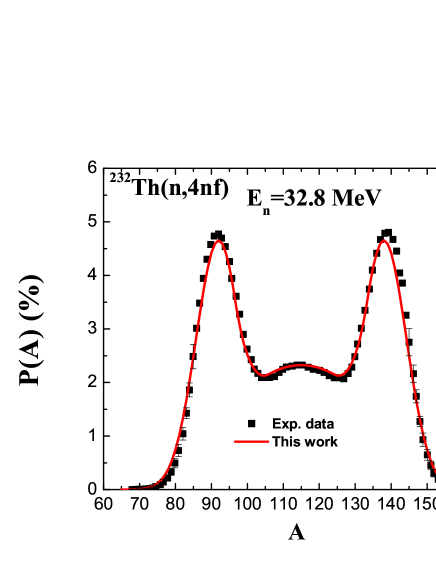
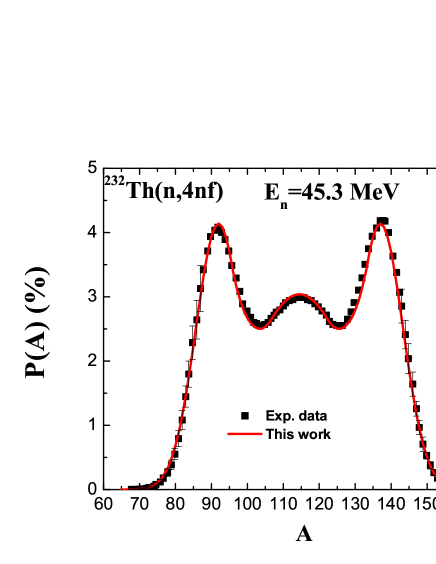
In this work, the evaporation neutrons at different incident energy intervals are empirically derived, and are additionally consistent with the fission cross sections in multi-chance fission channels as shown in Fig. 3. In terms of the driving potential, the position of the light fragment peak of the pre-neutron-emission mass distributions for reaction 232Th(n, f) is fixed. The energy dependence of the positions of the heavy fragment peaks and the symmetric fission point are uniquely determined after considering the evaporation neutron numbers, as expressed Eq. (8). Based on the experimental data, the energy dependence of the positions and of the fragment valleys, as well as the energy dependence of the heights of the peaks , and the valley , are also reasonably described by Eqs. (9)-(11). Therefore, the parameters of the fission potential are uniquely determined by using Eqs. (2)-(6). The calculated pre-neutron-emission mass distributions for reaction 232Th(n, f) are shown in Figs. 5-9.
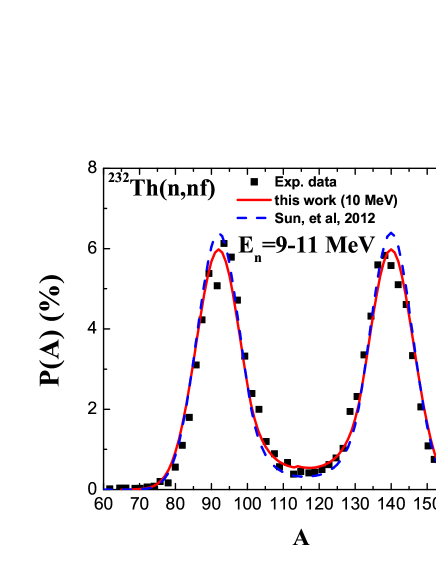
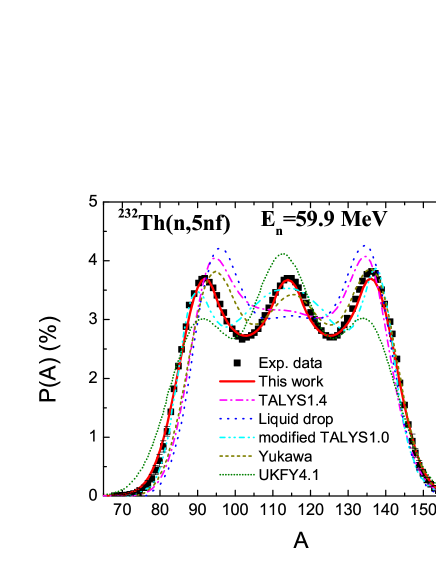
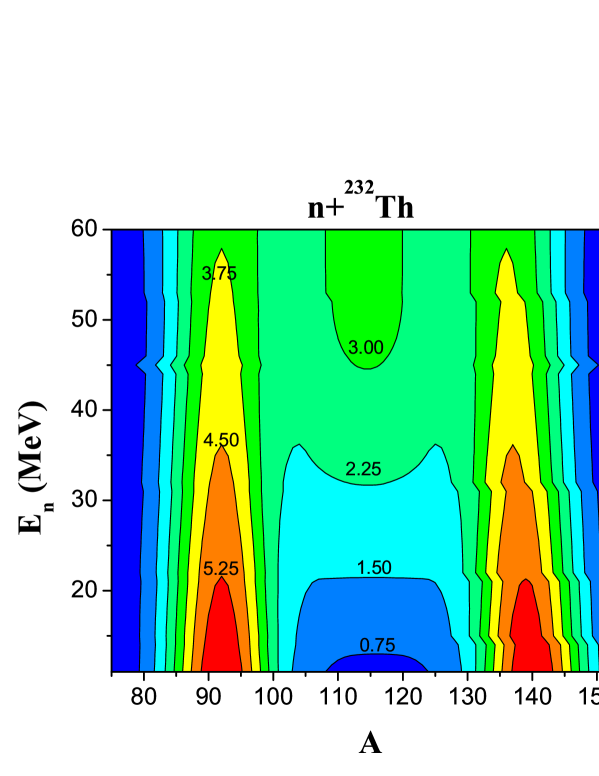
A particular attention should be payed to that there is a theoretically critical energy point while the height of the light fragment valley almost equals the value of the symmetric fission point with decreasing the incident energies. So the phenomenological fission potential Eq. (2) consisting of five harmonic-oscillator functions would be transformed into the expression of three harmonic-oscillator functions as shown in Ref. [1]. Using the parameters mentioned above, the pre-neutron-emission mass distributions for reaction 232Th(n, f) as a function of the fragment mass number at incident neutron energy =10 MeV are shown in Fig. 5 (red solid curve). In this figure, the scattered symbols denote the experimental data in incident energy interval 9-11 MeV, which are taken from Ref. [6, 7]. For comparison, we also give the calculated results using the potential parameters of Ref. [1] at =10 MeV (blue dash curve). From Fig. 5, one can see that the results of the mass distributions are slightly improved with the new parameters comparing with those in Ref. [1]. In Ref. [1], the energy dependence of peaks and valleys is simply assumed as a linear function of energy for fission at low incident energies () MeV. In addition, the calculated pre-neutron-emission mass distributions at different incident energies and the experimental data are also shown in Figs. 5 - 9. Furthermore, the pre-neutron-emission mass distributions at different incident energies from 10 MeV to 60 MeV for reaction 232Th(n, f) are also predicted (see Fig. 9). This figure clearly shows that the incident energy interval from double-dumped to triple-dumped shape locals 20 MeV - 30 MeV, and the symmetric fission component increases with incident neutron energy.
In Fig. 9, we also compare the experimental data at =59.9 MeV with the model calculations from different methods. The red solid, magenta dash dot, blue dot, cyan dash dot dot, dark yellow short dash, olive short dot curves denote the results of this work, TALYS1.4 code [9, 20], the liquid drop model [21], modified TALYS1.0 code [6], Yukawa [22] and UKFY4.1 library [10], respectively. The detailed descriptions of these model calculations are given in Ref. [3]. Compared with these model calculations, one can see that the results of this work reproduce the experimental data better.
In addition, from Fig. 5- Fig. 9, one can see the double-dumped and triple-dumped shapes of the pre-neutron-emission mass distributions. The triple-dumped pre-neutron-emission mass distributions gradually change to the double-dumped shape with decreasing the incident energies. For reaction 232Th(n, f), this critical incident energy is MeV through comparing the heights of the valley and the symmetric fission point as expressed Eq. (11). In addition, we find that at energy MeV the pre-neutron-emission mass distributions for reaction 232Th(n, f) change to a single-dumped shape, i.e., the symmetric fission component dominates in the fission process.
4 Summary
In this work, an empirical fission potential model is proposed to quantitatively describing the pre-neutron-emission mass distributions for reaction 232Th(n, f) up to 60 MeV. The energy dependences of evaporation neutrons before scission, peaks and valleys of the pre-neutron-emission mass distributions are described by the exponential expressions based on the newly measured data. Both the double-humped and triple-humped shape of the measured pre-neutron-emission mass distributions are reasonably well reproduced from low to intermediate incident energies. The pre-neutron-emission mass distributions at unmeasured energies are also predicted with this approach up to 60 MeV. We compare the calculated results using the previous method and the parameters [1], and the results of this work are slightly improved at low incident energies. We also compared the experimental data at intermediate energy with the model calculations from different methods, and one can see that the results of this work reproduce the experimental data better. Based on this empirical fission potential model and parameters, we also predict that the critical incident energies are MeV from double-dumped to triple-dumped shape, and MeV from triple-dumped to single-humped shape of the pre-neutron-emission mass distributions for reaction 232Th(n, f). This
investigation is helpful for further describing the yields of
the fission products. In addition, a more microscopic description of the potential parameters should be
further investigated. The study of these aspects is underway.
Acknowledgements
We thank Dr. Li Ou, Dr. Min Liu and Dr. Yun Guo for some valuable suggestions. This work was supported by Guangxi University Science and Technology Research Projects (Grant No. 2013ZD007), GuangXi Natural Science Foundation (Grant No. 2012GXNSFAA053008), National Natural Science Foundation of China (Grants No. 11265004) and the Th-based Molten Salt Reactor Power System of the Strategic Pioneer Science and Technology Projects from the Chinese Academy of Sciences.
References
- [1] X.J. Sun, C.G. Yu and N. Wang, Phys. Rev. C 85 (2012) 014613.
- [2] X.J. Sun, C.G. Yu, N. Wang, Y.X. Yang, Pre-neutron-emission mass distributions for reaction 238U(n, f) up to 60 MeV, arXiv preprint arXiv:1310.2999, (2013).
- [3] I.V. Ryzhov, S.G. Yavshits, G.A. Tutin, N.V. Kovalev, A.V. Saulski, N.A. Kudryashev, M.S. Onegin, L.A. Vaishnene, Yu.A. Gavrikov, O.T. Grudzevich, J.P. Meulders, R. Prieels, Phys. Rev. C 83 (2011) 054603.
- [4] J. Randrup, P. Mller, Phys. Rev. L 106 (2011) 132503.
- [5] J. Randrup, P. Moller, A.J. Sierk, Fission-fragment mass distributions from strongly damped shape evolution. Phys. Rev. C 84 (2011) 034613.
- [6] V.Simutkin, Fragment mass distributions in neutron-induced fission of 232Th and 238U from 10 to 60 MeV. Ph. D. thesis, Acta Universitatis Upsaliensis, 2011.
- [7] V.D. Simutkin, S. Pomp, J. Blomgren, M. sterlund, R. Bevilacqua, I.V. Ryzhov, G.A. Tutin, S.G. Yavshits, L.A. Vaishnene, M.S. Onegin, J.P. Meulders, R. Prieels, Experimental Neutron-Induced Fission Fragment Mass Yields of 232Th and 238U at Energies from 10 to 33 MeV. arXiv preprint arXiv:1304.2316, (2013).
- [8] O. Grudzevich, S. Yavshits, in Proceedings of the International Conference on Nuclear Data for Science and Technology, Nice, 2007, Vol. 2, p. 1213.
- [9] A. Koning, S. Hilaire, M. Dujvestijn, Proceedings of the International Conference on Nuclear Data for Science and Technology, Nice, 211 (2008).
- [10] R. Mills, JEF/DOC-1232 and UKNSF, 2008, P227.
- [11] K.-H. Schmidt, B. Jurado JEFF/DOC report, 1423(2012).
- [12] D.M. Gorodisskiy, K.V. Kovalchuk, S.I. Mulgin, A.Ya. Rusanov, S.V. Zhdanov, Ann. Nucl. Energy, 35 (2008) 238.
- [13] L.E. Glendenin, J.E. Gindler, I. Ahmad, D.J. Henderson, J.W. Meadows. Phys. Rev. C 22 (1980) 152.
- [14] H. Naika, V. K. Mulikb, P. M. Prajapatic, B.S. Shivasankard, S.V. Suryanarayanae, K.C. Jagadeesanf, S.V. Thakaref, S.C. Sharmae, A. Goswamia, Nucl. Phys. A 913 (2013) 185.
- [15] M. Liu, N. Wang, Z.X. Li, X.Z. Wu, E.G. Zhao, Nucl. Phys. A 768 (2006) 80.
- [16] N. Wang, M. Liu, Y.X. Yang, Sci. China Ser. G 52 (2009) 1554.
- [17] P.W. Lisowski, J.L. Ullman, S.J. Balestrini, A.D. Carlson, O.A. Wasson, N.W. Hill, Neutron induced fission cross section ratios for 232Th, 235, 238U, 237Th and 239Pu from 1 to 400 MeV, Report 1988, 88MITO, 97.
- [18] C. Paradela, L. Audouin, n-TOF fission data of interest to GEN-IV and ADS, 2006VANCOU/B076, 2006, or 2007NICE/1-421, 2007.
- [19] O. Shcherbakov, A. Donets, A. Evdokimov, A. Fomichev, T. Fukahori, A. Hasegawa, A. Laptev, V. Maslov, G. Petrov, S. Soloviev, Yu. Tuboltsev, A. Vorobyev, J. Nucl. Sci. Tech., Suppl. 2, 1 (2002) 230.
- [20] M.C. Duijvestijn, A.J. Koning, F.-J. Hambsch, Phys. Rev. C 64 (2001) 014607.
- [21] P. Seeger, W. Howard, At. Data Nucl. Data Tables 17 (1976) 428.
- [22] A. Dobrowolski, K. Pomorski, and J. Bartel, Phys. Rev. C 75 (2007) 024613, Phys. Scr., T 125 (2006) 188.