The age specific incidence anomaly suggests that cancers originate during development.
James P. Brody
Department of Biomedical Engineering
University of California, Irvine
Abstract
Cancers are caused by the accumulation of genetic alterations. Since this accumulation takes time, the incidence of most cancers is thought to increase exponentially with age. However, careful measurements of the age-specific incidence shows that the specific incidence for many forms of cancer rises with age to a maximum, then decreases. This decrease in the age-specific incidence with age is an anomaly. Understanding this anomaly should lead to a better understanding of how tumors develop and grow. Here I derive the shape of the age-specific incidence, showing that it should follow the shape of a Weibull distribution. Measurements indicate that the age-specific incidence for colon cancer does indeed follow a Weibull distribution. This analysis leads to the interpretation that for colon cancer two sub-populations exist in the general population: a susceptible population and an immune population. Colon tumors will only occur in the susceptible population. This analysis is consistent with the developmental origins of disease hypothesis and generalizable to many other common forms of cancer.
Introduction
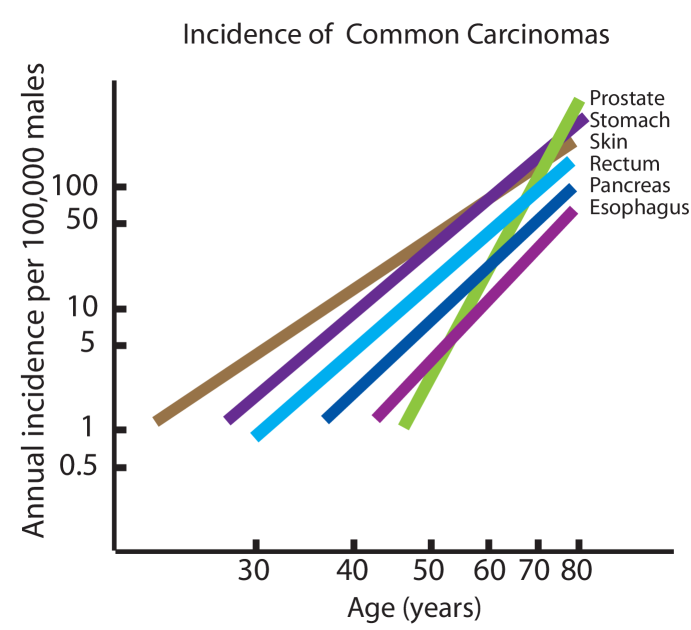
Cancers are thought to originate after a series of genetic alterations accumulate in a cell. These alterations could consist of mutations, deletions or modifications to the DNA. The accumulation of alterations increases when certain pathological states occur: chromosomal instability, DNA repair defects. A typical colorectal cancer genome contains about a dozen mutated genes that are considered to be driving the cancer[1, 2]. Since a normal cell needs to accumulate mutations to more than a dozen key genes before transforming into a tumor cell[3], the probability of acquiring a particular cancer should increase with age. Thus, it is widely thought that the older one gets, the more likely one is to develop cancer. Age is the primary risk factor for cancer, and cancer is considered an age related disease [4]. The textbook understanding of how age relates to cancer is shown in Figure 1.
However, the incidence of most cancers does not monotonically increase with age; instead, the incidence increases to a maximum at some age and then decreases. Although this anomaly is well established [6, 7, 8], it is not widely known.
A complete understanding of the age-specific incidence should lead to a better understanding of how cancers develop. The age-specific incidence is the only quantitative data available on the development process of cancer. It is not confounded by animal models. One of the primary steps to understanding the age-specific incidence is to understand the anomaly.
Thought experiments
We can begin with a gedanken experiment. Take 100,000 newborn human infants and put them in an isolated box. These babies live well, and grow into adults. In this idealized experiment, they do not die of any ailments. Each of these experimental subjects is regularly examined for a particular type of cancer, say colon cancer. When a subject is first diagnosed with a colon cancer, the exact age is recorded. The experiment runs for hundreds of years, then we make a histogram of the number of colon cancers diagnosed as a function of years since the beginning of the experiment.
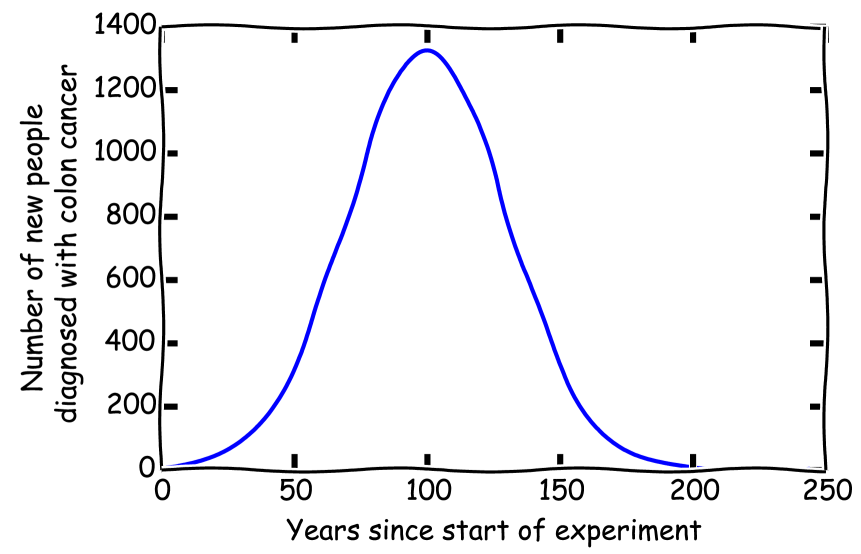
This histogram will start near zero, reach a maximum, then decline to zero again when all subjects have been diagnosed with a first case of colon cancer, as shown in Figure 2. If every member of the initial population of infants ultimately developed the cancer, then the integral of this histogram should be equal to the population, in this case, 100,000.
A second gedanken experiment is also performed. In this case, the population of 100,000 infants is composed of two apparently indistinguishable sub populations, one of which can develop colon cancer (20%), and the other of which cannot(80%). The same process is followed. At the end of the experiment, the integral of the histogram is calculated and it will equal 20,000.
While these gedanken experiments are unrealistic, an analogous experiment can be done. First, we record the age of all patients diagnosed with a specific cancer within a large geographic area in one year. Second, we record the age of each member in the entire population. Finally, for each age group, we divide the number of patients who had a tumor diagnosed in that year by the total number of people with that age in the population. By convention, these numbers are multiplied by 100,000 and are called the age-specific incidence.
Population based cancer registries
Population based cancer registries record the age (and other information) about all patients diagnosed with all types of tumors within a specific geographic area. Then, a government census records the ages of all members of the population within a specific geographic area. Together these sources of data can be combined to compute the age-specific incidence data.
The collection and quality of age-specific incidence data has significantly improved since registries began in the mid 1900’s. Initially, this data was derived from death certificates. However, many deaths were attributed to “old age” or nonstandard terminology. Today, cancer registries systematically collect information on the diagnosis of tumors and demographic information of the patient.
Different cancer registries, however, collect different information. These differences make aggregation of cancer registry data difficult. In 1973, the National Cancer Institute established the Surveillance, Epidemiology, and End Results (SEER) program. The SEER network of cancer registries solved many of these problems by requiring a specific set of information to be reported and established guidelines on how to encode different properties of a tumor.
The SEER network of cancer registries began in 1973 with seven different geographic registries covering 16 million people. The program has expanded from seven cancer registries in 1973 to 18 cancer registries in 2012, with about 86 million people under surveillance. The SEER program publishes annually case files, which contain summary information about all tumors diagnosed within the specific geographic areas.
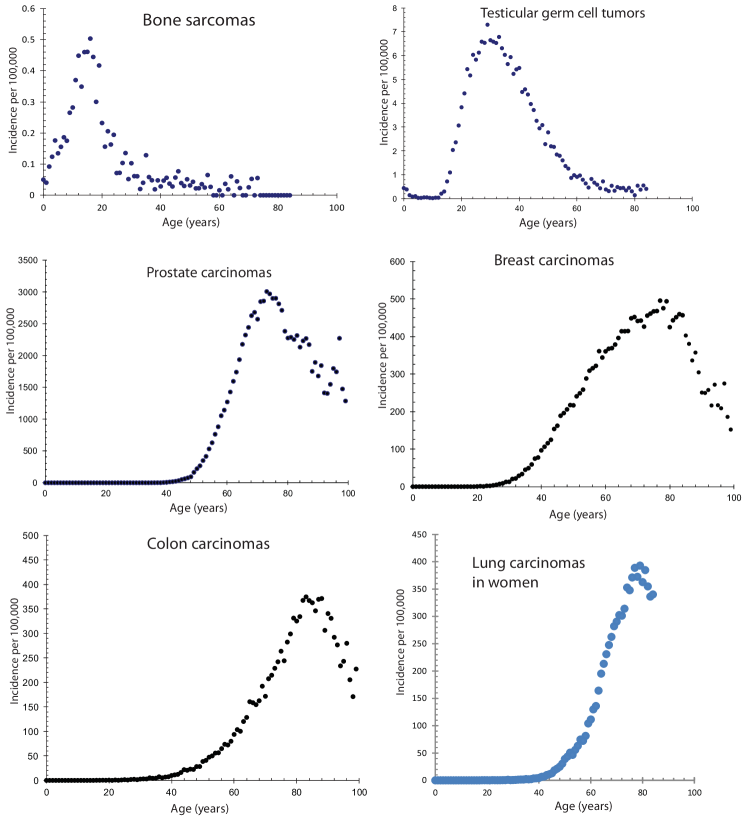
Age-specific incidence data collected by the SEER-17 network of cancer registries in 2000 is shown in Figure 3. This data is presented to emphasize that different cancers have different maximum ages. In each of the seven cancers shown, a decrease in incidence with age exists. This decrease is anomalous, the opposite of the expected behavior, but is consistent with our gedanken experiments.
Anomaly or Artifact?
A number of concerns have been raised with the surprising observation that the age-specific incidence decreases with age. The three most common are (1) this observation is contradicted by autopsy studies of latent carcinoma, (2) this observation is an artifact caused by decreased screening rates with age, and (3) this observation is the result of a birth cohort effect. Each of these concerns has been studied in great detail and none of these are sufficient to explain the anomaly.
Autopsy studies of latent carcinoma. A widespread perception exists that undiagnosed carcinomas, or latent carcinomas, are common in elderly people. Much of this perception is due to work done in the 1950’s by LM Franks, who performed several autopsy studies [9, 10]. His work appeared to show that many undiagnosed cancers existed in people who died. This work was based on rather small numbers (for instance, [10] only had two subjects in the 90-100 year old age group.) This data has not been replicated, moreover recent autopsy studies on larger populations [11, 12] contradict Frank’s results and have established that the incidence of many common carcinomas decreases after a certain age.
Screening and age-specific incidence data. The effect of cancer screening on colorectal cancer rates can be estimated. Colorectal screening rates decrease with age after 60 years. The National Survey of Ambulatory Surgery quantified the rate of outpatient colonoscopies (over 90% of colonoscopies are performed as outpatients) in 1994, 1995, 1996 and 2006[13]. (The survey was not performed in the years between 1996 and 2006.) Based on these estimates, colorectal screening rates in the elderly population (over 85) were about 40% of the rate of 50 to 64 year olds.
The increase in diagnosed cancers due to screening can be estimated from the age-specific incidence data. Guidelines suggest beginning screening at 50 years of age. The colon carcinoma age-specific incidence data shows a small, but noticeable, increase over the expected rate at 50 years of age. From this, we estimate the number of new cases of colon carcinoma due to screening at about 2 per 100,000, when about 5000 per 100,000 are screened. Based on these numbers, we estimate that if screening rates did not decrease with age, the specific incidence of colon carcinoma would increase by about 40 cases per 100,000 population at age 85. This is not a significant difference.
Birth cohort effects on age-specific incidence data. The drop in the incidence of colon cancer after age 85 is not due to birth cohort effects. The expected value, if 100% of the population were susceptible, for age 99 is about 850 per 100,000, as shown in data from 200 shown Figure 4. The observed value is about 227 with a 95% confidence interval of 96 to 357. The observed value is about one quarter of the expected value of colon carcinoma incidence, if 100% were susceptible to colorectal carcinoma. If this population, born in 1900-1910, had a significantly reduced propensity to develop colorectal carcinoma, then we should see a correspondingly small incidence in the population aged 72 years old recorded in 1973 (the earliest SEER data available). No such effect is noticeable in the 1973 data.
Finally, one other objection to the observation of declining cancer incidence with age is sometimes raised mistakenly: competing risk. Competing risk is not relevant here. It is relevant to studies with fixed populations when some members of the population die from other causes. The age-specific incidence data is not based on fixed populations. Specific incidence is the number of diagnosed cancers divided by the population.
Understanding the age-specific incidence data
We follow two approaches to understand the age-specific incidence data. The first approach is theoretical: based on first principles, what should be the shape of the age-specific incidence curve? The second approach asks what biomedical hypothesis could produce age-specific incidence data that we observe.
A theory of the age-specific incidence curve. We have postulated that the age-specific incidence curve should follow a extreme value distribution, in particular the Weibull distribution[14]. Our reasoning is that:
-
1.
Tumors originate in a single cell, the progenitor cell.
-
2.
Many potential progenitor tumors cells exist in the body for each type of potential tumor.
-
3.
A tumor develops when the first of these many potential progenitor cells.
These steps describe an extreme value process. The Weibull distribution is the proper distribution to characterize this process[15].
The probability of developing a particular cancer as a function of time, , is given by the Weibull distribution
| (1) |
when and the Weibull distribution is when . The Weibull distribution has four parameters: is a normalization factor, is the time shift, is called the shape parameter, and is the scale parameter. Both and must be positive.
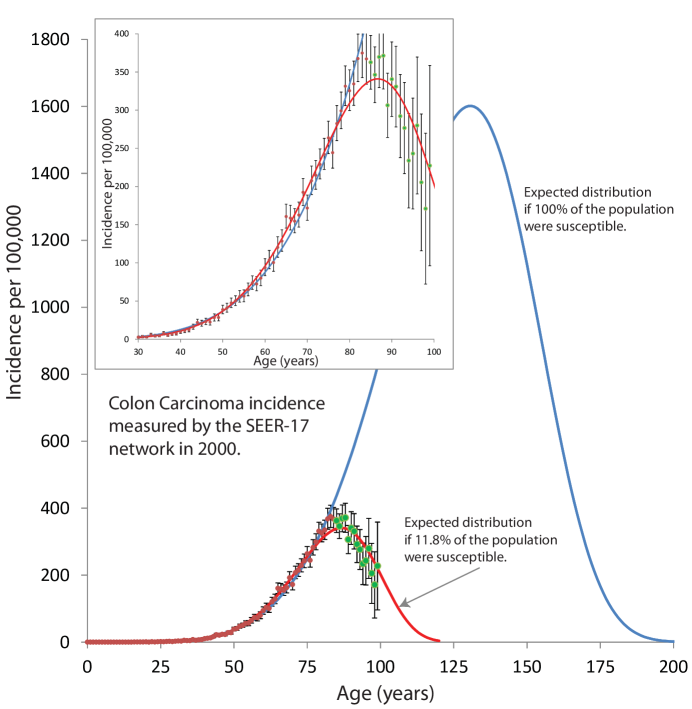
We compared the theoretical shape of the age-specific incidence data with observational data collected by the SEER-17 registries in 2000 for colon cancer. We computed the best fit theoretical shape to the 0-84 year old data in two cases. First, when all three parameters () were allowed to vary and second when was fixed to be 100,000, but the other two parameters were allowed to vary. These results are shown in Figure 4.
The two fits in Figure 4 correspond to the two gedanken experiments. If everyone eventually will develop colon cancer, the data points should fall on the 100% line. We observe the 86-100 years old data points, which were not involved in the fitting, to fall on the 11.8% curve.
This analysis suggests that two subpopulations exist. One subpopulation, consisting of about 12% of the population, is susceptible to developing colon cancer. The second subpopulation, consisting of about 78% of the population is immune to developing colon cancer. Membership in the susceptible population must be determined early, before the age of 20.
One objection to this interpretation is that it apparently contradicts the well-established observation that modifiable risk factors exist for most common cancers. The link between environmental exposure and increased cancer rates is well established, most prominently between cigarette smoking and lung cancer. If environmental exposure causes cancer, how can a susceptible subpopulation exist and be defined at an early age?
One possible explanation is that environmental risk factors effect how fast a tumor grows. For instance, a non-smoker predisposed to lung cancer might develop a lung tumor at age 120, while a similar heavy smoker develops a tumor at age 60. Since the non-smoker will probably die from other causes before the lung tumor develops, it appears that the smoker developed lung cancer while the non-smoker did not develop lung cancer.
The idea that disease observed late in life could originate early in life is not novel. This idea is called the developmental origin of disease hypothesis[16, 17, 18]
Developmental origin of disease hypothesis. Different forms of this hypothesis have been proposed[19, 20]. Trichopoulos has suggested that hormonally regulated cancers originate in utero. He points out that this would explain a number of curious observations about breast cancer including the dramatic difference in incidence found in Japan and the USA [21]. Barker has suggested that not only cancers, but also other adult diseases have fetal origins [16, 22]. Others have also suggested that some chronic diseases are influenced by exposure to environmental factors early in life [23, 24]. Diabetes[25], schizophrenia[26], and lung disease[27] might also find their origins in early life.
Mechanisms for the developmental origins of disease hypothesis. Several known mechanisms could be responsible for the existence of two sub populations, these include germ line mutations, somatic mutations early in life, and/or epigenetic modifications inherited or acquired early in life.
Germ line mutations have been ruled out. During the 1990’s, significant resources were devoted to the identification of germ line mutations for the most common forms of cancers. This effort led to the identification of BRCA1[28]. Certain mutations in BRCA1 significantly increase the risk that a woman will develop breast cancer. However, these mutations are rare and less than 10% of breast cancers in the US population occur in women with these mutations. Despite searching for similar genes in colon cancer [29], none have been found with the significance of BRCA1. No recurrent mutations are responsible for the progression of colon cancer [30].
Somatic mutations acquired early in life (during development) could propagate to encompass entire tissues. Embryonic cells are actively proliferating and a somatic mutation acquired early during development will be found in many cells. Irradiation of a fetus is known to increase the incidence of childhood cancers[31] presumably through the acquisition of somatic mutations. Somatic mutations acquired during development are known to be responsible for retinoblastoma, a childhood cancer [32].
Epigenetic alterations play a key role in the carcinogenesis process[33, 34, 35]. These types of alterations can be passed down through cellular generations. Modification of histones are a key regulatory step in transcription [36] and DNA damage repair [37]. Specific histone modifications have been identified that are common features of human cancers [38, 39]. Several approaches to determining genome wide methylation exist, but these approaches have not yet been widely applied to cancer [40].
Conclusion
In conclusion, we showed that logically (through gedanken experiments), theoretically, and observationally that the age-specific incidence data decreases with age. This apparent anomaly is consistent with the developmental origin of disease hypothesis.
References
- [1] Sjöblom, T. et al. The consensus coding sequences of human breast and colorectal cancers. Science 314, 268–274 (2006). URL http://dx.doi.org/10.1126/science.1133427.
- [2] Wood, L. D. et al. The genomic landscapes of human breast and colorectal cancers. Science 318, 1108–1113 (2007). URL http://dx.doi.org/10.1126/science.1145720.
- [3] Markowitz, S. D. & Bertagnolli, M. M. Molecular origins of cancer: Molecular basis of colorectal cancer. N Engl J Med 361, 2449–2460 (2009). URL http://dx.doi.org/10.1056/NEJMra0804588.
- [4] Campisi, J. & Yaswen, P. Aging and cancer cell biology, 2009. Aging Cell 8, 221–225 (2009). URL http://dx.doi.org/10.1111/j.1474-9726.2009.00475.x.
- [5] Lodish, H. et al. Molecular Cell Biology (W. H. Freeman, 2004), fifth edn.
- [6] Harding, C., Pompei, F. & Wilson, R. Peak and decline in cancer incidence, mortality, and prevalence at old ages. Cancer 118, 1371–1386 (2012). URL http://dx.doi.org/10.1002/cncr.26376.
- [7] Pompei, F. & Wilson, R. Age distribution of cancer: the incidence turnover at old age. Human and Ecological Risk Assessment 7, 1619–1650 (2001).
- [8] Harding, C., Pompei, F., Lee, E. E. & Wilson, R. Cancer suppression at old age. Cancer Res 68, 4465–4478 (2008). URL http://dx.doi.org/10.1158/0008-5472.CAN-07-1670.
- [9] Franks, L. M. Latent carcinoma of the prostate. J Pathol Bacteriol 68, 603–616 (1954).
- [10] Franks, L. M. Latent carcinoma. Ann R Coll Surg Engl 15, 236–249 (1954).
- [11] Imaida, K. et al. Clinicopathological analysis on cancers of autopsy cases in a geriatric hospital. Pathol Int 47, 293–300 (1997).
- [12] de Rijke, J. M. et al. Cancer in the very elderly dutch population. Cancer 89, 1121–1133 (2000).
- [13] Cullen, K. A., Hall, M. J. & Golosinskiy, A. Ambulatory surgery in the united states, 2006. Natl Health Stat Report 1–25 (2009).
- [14] Soto-Ortiz, L. & Brody, J. A theory of the cancer age-specific incidence data based on extreme value distributions. AIP Advances (2012).
- [15] Weibull, W. A statistical distribution function of wide applicability. ASME Journal of Applied Mechanics 18, 293–297 (1951).
- [16] Barker, D. J. The fetal and infant origins of adult disease. BMJ 301, 1111 (1990).
- [17] Barker, D. J. P. The developmental origins of adult disease. Eur J Epidemiol 18, 733–736 (2003).
- [18] Barker, D. J. P., Eriksson, J. G., Forsén, T. & Osmond, C. Fetal origins of adult disease: strength of effects and biological basis. Int J Epidemiol 31, 1235–1239 (2002).
- [19] Morgenthaler, S., Herrero, P. & Thilly, W. G. Multistage carcinogenesis and the fraction at risk. J Math Biol 49, 455–467 (2004). URL http://dx.doi.org/10.1007/s00285-004-0271-9.
- [20] Herrero-Jimenez, P. et al. Mutation, cell kinetics, and subpopulations at risk for colon cancer in the United States. Mutat Res 400, 553–578 (1998).
- [21] Trichopoulos, D. Hypothesis: does breast cancer originate in utero? Lancet 335, 939–940 (1990).
- [22] Calkins, K. & Devaskar, S. U. Fetal origins of adult disease. Curr Probl Pediatr Adolesc Health Care 41, 158–176 (2011). URL http://dx.doi.org/10.1016/j.cppeds.2011.01.001.
- [23] Gluckman, P. D. & Hanson, M. A. Living with the past: evolution, development, and patterns of disease. Science 305, 1733–1736 (2004). URL http://dx.doi.org/10.1126/science.1095292.
- [24] Gluckman, P. D., Hanson, M. A., Cooper, C. & Thornburg, K. L. Effect of in utero and early-life conditions on adult health and disease. N Engl J Med 359, 61–73 (2008). URL http://dx.doi.org/10.1056/NEJMra0708473.
- [25] Yajnik, C. S. Early life origins of insulin resistance and type 2 diabetes in india and other asian countries. J Nutr 134, 205–210 (2004).
- [26] St Clair, D. et al. Rates of adult schizophrenia following prenatal exposure to the chinese famine of 1959-1961. JAMA 294, 557–562 (2005). URL http://dx.doi.org/10.1001/jama.294.5.557.
- [27] Harding, R. & Maritz, G. Maternal and fetal origins of lung disease in adulthood. Semin Fetal Neonatal Med 17, 67–72 (2012). URL http://dx.doi.org/10.1016/j.siny.2012.01.005.
- [28] Miki, Y. et al. A strong candidate for the breast and ovarian cancer susceptibility gene brca1. Science 266, 66–71 (1994).
- [29] Peltomaki, P. et al. Genetic mapping of a locus predisposing to human colorectal cancer. Science 260, 810–812 (1993).
- [30] Feinberg, A. P., Ohlsson, R. & Henikoff, S. The epigenetic progenitor origin of human cancer. Nat Rev Genet 7, 21–33 (2006). URL http://dx.doi.org/10.1038/nrg1748.
- [31] Doll, R. & Wakeford, R. Risk of childhood cancer from fetal irradiation. Br J Radiol 70, 130–139 (1997).
- [32] Frank, S. A. & Nowak, M. A. Cell biology: Developmental predisposition to cancer. Nature 422, 494 (2003). URL http://dx.doi.org/10.1038/422494a.
- [33] Esteller, M. Epigenetics in cancer. New England Journal of Medicine 358, 1148–1159 (2008).
- [34] Jirtle, R. L. Genomic imprinting and cancer. Exp Cell Res 248, 18–24 (1999). URL http://dx.doi.org/10.1006/excr.1999.4453.
- [35] Jirtle, R. L. & Skinner, M. K. Environmental epigenomics and disease susceptibility. Nat Rev Genet 8, 253–262 (2007). URL http://dx.doi.org/10.1038/nrg2045.
- [36] Jones, P. A. & Baylin, S. B. The epigenomics of cancer. Cell 128, 683–692 (2007). URL http://dx.doi.org/10.1016/j.cell.2007.01.029.
- [37] Chi, P., Allis, C. D. & Wang, G. G. Covalent histone modifications–miswritten, misinterpreted and mis-erased in human cancers. Nat Rev Cancer 10, 457–469 (2010). URL http://dx.doi.org/10.1038/nrc2876.
- [38] Fraga, M. F. et al. Loss of acetylation at lys16 and trimethylation at lys20 of histone h4 is a common hallmark of human cancer. Nat Genet 37, 391–400 (2005). URL http://dx.doi.org/10.1038/ng1531.
- [39] Das, C., Lucia, M. S., Hansen, K. C. & Tyler, J. K. Cbp/p300-mediated acetylation of histone h3 on lysine 56. Nature 459, 113–117 (2009). URL http://dx.doi.org/10.1038/nature07861.
- [40] Laird, P. Principles and challenges of genome-wide dna methylation analysis. Nature Reviews Genetics 11, 191–203 (2010).