Quantitative Assessment of TV White Space in India††thanks: This work has been supported by the Ford Foundation.
Abstract
Licensed but unutilized television (TV) band spectrum is called as TV white space in the literature. Ultra high frequency (UHF) TV band spectrum has very good wireless radio propagation characteristics. The amount of TV white space in the UHF TV band in India is of interest. Comprehensive quantitative assessment and estimates for the TV white space in the -MHz band for four zones of India (all except north) are presented in this work. This is the first effort in India to estimate TV white spaces in a comprehensive manner. The average available TV white space per unit area in these four zones is calculated using two methods: (i) the primary (licensed) user and secondary (unlicensed) user point of view; and, (ii) the regulations of Federal Communications Commission in the United States. By both methods, the average available TV white space in the UHF TV band is shown to be more than MHz! A TV transmitter frequency-reassignment algorithm is also described. Based on spatial-reuse ideas, a TV channel allocation scheme is presented which results in insignicant interference to the TV receivers while using the least number of TV channels for transmission across the four zones. Based on this reassignment, it is found that four TV band channels (or MHz) are sufficient to provide the existing UHF TV band coverage in India.
I Introduction
With rising demand for bandwidth, several researchers around the world have measured and studied the occupancy of spectrum in different countries. These measurements suggest that except for the spectrum allocated to services like cellular technologies, and the industrial, scientific and medical (ISM) bands, most of the allocated spectrum is heavily underutilized. The overall usage of the analyzed spectrum is as low as 4.54% in Singapore [1], 6.2% in Auckland [2], 17.4% in Chicago [3] and 22.57% in Barcelona [4]. Among all the unutilized portions of the frequency spectrum, white spaces in the Ultra High Frequency (UHF) Television (TV) bands have been of particular interest owing to the superior propagation characteristics as compared to the higher frequency bands.
Loosely speaking, the unutilized (or underutilized) TV channels collectively form the TV white spaces. The amount of available TV white space varies with location and time. TV white space estimation has been done in countries like the United States (US), the United Kingdom (UK), Europe, and Japan [5, 6, 7, 8]. In the Indian context, single-day experiments at three locations in urban and sub-urban Delhi have been performed [9]. The estimation of TV white space in the UHF band, based on spectrum allocation and TV transmitter parameters, is presented in this work.
The main contributions of this paper are the following:
-
1.
For the first time, the empirical quantification of the available TV white space in the -MHz in India is presented. The quantification utilizes existing methods in the literature, namely pollution and protection viewpoints [5], and the technical specifications of the Federal Communications Commission [10]. It is found that UHF TV band spectrum is heavily underutilized in India.
-
2.
Motivated by underutilization of UHF TV band spectrum, a spatial reuse based channel allocation algorithm has been proposed for the existing Indian TV transmitters operating in the 470-590 MHz band. The algorithm uses the least number of TV channels while ensuring no (significant) interference between transmitters operating in the same channel. It is observed that at least UHF TV band channels can be freed by this approach.
The importance of the above results must be understood in the context of Indian National Frequency Allocation Plan (NFAP) 2011 where a policy intent for the utilization of TV white spaces was made. Therefore, it is necessary to estimate the amount of TV white spaces in India. Besides, based on above results, the TV band in India is underutilized and this situation is quite different than in the developed countries. The optimal mechanism(s) for the use of TV white spaces in India can be different and it should be studied by further research.
Organization: The TV white space scenario and the related work on quantitative analysis in a few other countries is briefly described in Sec. II. Sec. III describes the current Indian usage scenario of the UHF TV Bands. Sec. IV presents the methodology and assumptions used in calculating the white space availability in India. Sec. V presents the results of our work, and compares the TV white space availability in India with that of other countries. In Sec. VI, we propose a frequency allocation scheme to the TV transmitters in India so as to ensure minimum number of channel usage in the country. Concluding remarks and directions for future work are discussed in Sec. VII.
II TV White Space in other countries
Regulators FCC in the US and Ofcom in the UK have allowed for secondary operations in the TV white spaces. Under this provision, a secondary user can use the unutilized TV spectrum provided it does not cause harmful interference to the TV band users and it relinquishes the spectrum when a primary user (such as TV Transmitter) starts operation. Since the actual availability of TV white spaces varies both with location and time, operators of secondary services are interested in the amount of available white space. The available TV white space depends on regulations such as the protection margin to the primary user, maximum height above average terrain (HAAT), transmission power of secondary user, and the separation distance.
As per FCC, a band can declared as unutilized if no primary signal is detected above a threshold of dBm [10]. Using the parameters of terrestrial TV towers, TV white space availability in the US has been done in the literature [5]. The average number of channels available per user has been calculated using the pollution and protection viewpoints.111The pollution viewpoint looks at TV white space calculations from the secondary users’ point of view, whereas the protection viewpoint is concerned with avoiding interference to the primary users [5]. These viewpoints are explained in more detail in Sec. IV. Using the pollution viewpoint into account, the average number of channels available per location increases with the allowable pollution level. This average number of available channels is maximum in the lower UHF band. In the protection viewpoint too, the average number of available channels at a location is maximum in the lower UHF band (channels 14-51 of the US) and this decreases as more and more constraints are applied. In UK, Ofcom published a consultation providing details of cognitive access to TV white spaces in 2009 [11]. The coverage maps and database of digital TV (DTV) transmitters can be used to develop a method for identification of the TV white space at any location within UK [6]. The TV white space availability in Japan has also been studied in [8]. The results of [8] indicate that the amount of available TV white space in Japan is larger than that in US and UK. However, this availability decreases with an increase in the separation distance.
To the best of our knowledge, a comprehensive study of TV white space availability has not been done in India and is the focus of this work.
III Current Indian TV Band Plan
As per the NFAP 2011 [12], the spectrum in the frequency band -MHz is earmarked for Fixed, Mobile and Broadcasting Services. The NFAP has allowed the digital broadcasting services to operate in the -MHz band. India is a part of the ITU Region 3, and the -MHz band has been earmarked for International Mobile Telecommunications-Advanced (IMT-A) applications (see footnote IND 38 of [12]). Hence, the digital TV broadcasting will operate in the frequency band from MHz to MHz. Currently the TV transmitters operate only in the -MHz band in the UHF band.
In India, the sole terrestrial TV service provider is Doordarshan which currently transmits in two channels in most parts across India. Currently Doordarshan has TV transmitters operating in India, out of which transmitters transmit in the VHF Band-I (-MHz comprising of two channels of MHz each), transmitters operate in the VHF Band-III (-MHz comprising of eight channels of MHz each), and the remaining transmitters transmit in the UHF Band-IV (-MHz comprising of fifteen channels of MHz each). In India, a small number of transmitters operate in the UHF bands. As a result, apart from -MHz band depending on the location, the UHF band is quite sparsely utilized in India! This observation will be made more precise in the next section.
IV Methodology
The quantification of TV white space in India will be addressed in this section. A computational tool has been developed that calculates the protection region and separation distance for each tower, and also the pollution region around the tower where a secondary device should not operate. Currently, there are no TV white space regulations in India. The regulations of FCC (US) are borrowed for the estimation of TV white space in India. Microphones are ignored in our computation due to lack of available information. The input to the developed computational tool include the following parameters for all the TV transmitters:
-
1.
position of the tower (latitude and longitude),
-
2.
transmission power of the TV transmitter,
-
3.
frequency of operation,
-
4.
height of the antenna,
-
5.
and, terrain information of area surrounding the tower.
The above parameters of all the TV towers operating in the UHF band-IV have been obtained from the terrestrial TV broadcaster Doordarshan.222While the TV tower data is available online publicly in US and other countries, it is not so in India. We could obtain the data with considerable efforts from Doordarshan. Out of 373 transmitters operating in the 470-590 MHz UHF band (Channel No. 21-35), Doordarshan has provided data of 254 towers operating in the West, East, South and the North East zone. The TV transmitter information for the North zone is yet to be provided by Doordarshan.
Comprehensive field strength measurements in India suggest that Hata model is fairly accurate for propagation modeling [14, 13]. The Hata model will be used for path-loss calculations. Using the TV transmitter information and the propagation model, we quantify the available TV white space in the UHF TV band by two methods. The first method utilizes the protection and pollution viewpoints while the second one utilizes technical specification made by the FCC.
IV-A Method 1: the protection and pollution viewpoints
The protection and pollution viewpoints used for calculating TV white space have been introduced by Mishra and Sahai [5]. Their method is reviewed in this section and utilized in our work for obtaining TV white space availability (see Sec. V).
IV-A1 Protection viewpoint
In the protection viewpoint, when a secondary user operates, it must not cause any interference to the primary receivers in its vicinity. This is illustrated in Fig. 1
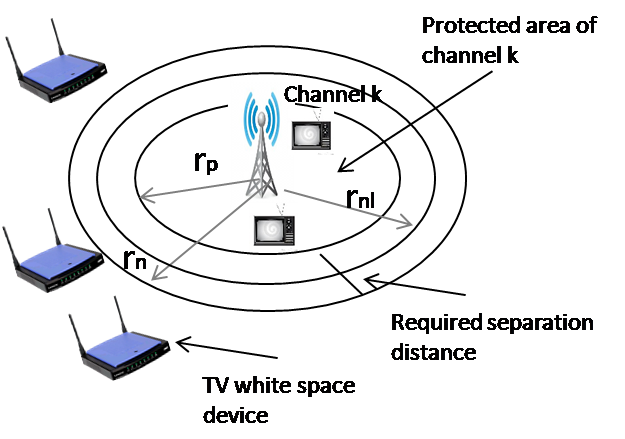
The protected area is defined using the following SINR equations. Let be the transmit power of primary in dBm, be the path-loss in dB at a radial distance from the transmitter, be the thermal noise in dBm, and be the threshold SINR in dBm. Then, the protection radius is defined by the following SINR equation,
The regulator provides an additional margin () to account for fading. The modified equation for is,
The no-talk radius is defined as the distance from the transmitter up to which no secondary user can transmit. The difference is calculated such that if a secondary device transmits at a distance of from the TV band receiver located at , the SINR at the TV band receiver within a radius does not fall below .333For simplicity, only one secondary device transmitting around the primary receiver is considered. The separation distance is then calculated such that
where, is the secondary transmitter power in dBm.
In addition to the co-channel considerations, a TV receiver tuned to a particular channel has a tolerance limit on the interference level in the adjacent bands. In the protection viewpoint, we consider that the protection radius in the adjacent channel is the same as in co-channel. However, the TV receiver can tolerate more adjacent channel interference than co-channel interference. Therefore, a margin of dB more than co-channel fading margin (set by the FCC regulations [10]) is provisioned for adjacent channel interference.
IV-A2 Pollution viewpoint
The pollution viewpoint takes into consideration the fact that even though a region could be used by a secondary device, the interference at the secondary receiver due to the primary transmitter might be higher than the tolerable interference level of the secondary receiver. If is the interference tolerable by the secondary receiver, then is given by,
Similar to the protection viewpoint, there are adjacent channel conditions (leakage of primary transmitter’s power in the adjacent channel) in the pollution viewpoint as well. It is assumed that the secondary device can tolerate up to dB of interference if it is operating in the adjacent channels. The TV white space available is the intersection of the white space determined from the pollution and protection viewpoints.
The parameters used in our computations for calculating the available TV white space are given in Table I.
| Pollution Viewpoint | |
| Maximum tolerable interference () by secondary | dB |
| dB (specified for 802.11g systems) | |
| Maximum tolerable interference () by secondary (adjacent channel) | dB |
| Noise in a MHz band () | dBm |
| Protection Viewpoint | |
| Target fading margin () | dB |
| dB (specified by FCC) | |
| Additional fading margin in adjacent channel | dB (specified by FCC) |
| Required SINR for primary receiver | dB |
| Transmission power of secondary device | dBm |
| HAAT of secondary device | m |
As an example, we consider the TV tower located at the Sinhagad Fort in Pune. Doordarshan informed us that the tower at Sinhagad Fort operates in the -MHz band (channel ) at a height of m and power of kW (dBm). In the Hata model used for path loss calculations, Pune has been considered as an urban city. Using the pollution viewpoint, for a dB tolerable interference in channel (-MHz), the pollution radius for the tower is calculated to be km, and for a tolerable interference of dB in the adjacent channel, the pollution radius is km. What this means for a secondary device is that the interference level is more than the allowable limit (dB above noise floor) in a region of km in channel and km in the adjacent channels around the tower.
From the protection viewpoint, if a fading margin of dB is provided, the protection and no-talk radius in channel are km and km respectively. If we consider an additional fading margin of dB in the adjacent band, the no talk radius in the adjacent channel is km. This implies that if a secondary device operates within a distance of km in channel and km in the adjacent channels, the primary user receiving on channel will experience interference. The available white space is the intersection of the white space using the two viewpoints. Thus, in Pune, no secondary device can operate within a distance of km (limit set by pollution viewpoint) on channel and km in the adjacent channels (limit set by protection viewpoint) around the tower at Sinhagad Fort.
IV-B Method 2: TV white space calculation using FCC rules
In the FCC’s definition of TV white space, the protection radius is same in the Grade B contour () [5, 10]. In the UHF band, is the distance from the TV tower where the field strength of the primary signal falls to dBu. The required field strength is converted from from dBu to dBm using the following conversion formula [15],
where, is transmit power in dBm, is the field strength in dBu, is the upper frequency-limit of the channel, and is the lower frequency-limit of the channel. To calculate the separation distance, i.e. distance beyond where no secondary device can transmit, the distance such that the signal from the secondary device at results in a signal level of dBu at the TV receiver located at is calculated. For the TV transmitter at Pune, the no-talk radius, i.e. the distance from the tower beyond which a secondary device can use the channel is computed to be km.
V Results
The results obtained by TV white space calculation methods of Sec. IV will be discussed in this section.
V-A White Space Availability using Pollution, Protection viewpoints & the FCC Rule
Using the methodology described in Sec. III, the pollution and the no-talk radius are calculated for every TV tower in the four zones. Each region is plotted as a circle around the TV tower. Here it has been assumed that each tower has an omnidirectional antenna. The TV white space availability in the west, east, south and north-east zone using the pollution viewpoint is shown in Fig. 2 and using the protection viewpoint in Fig. 3. White space availability using the FCC regulations is shown in Fig. 4.
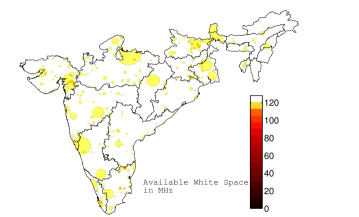
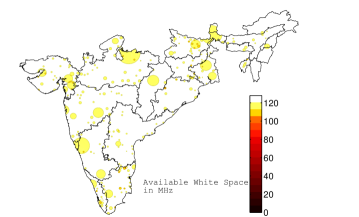
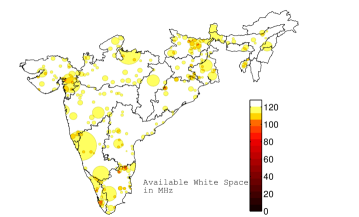
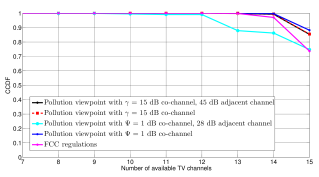
Fig. 2 and Fig. 3 illustrate that at most places in India, not even a single channel in the UHF band is utilized! To quantify this result further, the complementary cumulative distribution function of the number of channels available per unit area as TV white space is plotted in Fig. 5.
| Method | Parameters | West zone | East zone | South zone | North east zone | India |
| Pollution Viewpoint | Main channel = 5 dB | 14.0047 | 14.2313 | 14.4745 | 14.8464 | 14.2130 |
| Main channel = 5 dB, Adjacent channel = 45 dB | 13.9957 | 14.2223 | 14.4693 | 14.8443 | 14.2054 | |
| Main channel = 10 dB | 14.6896 | 14.6295 | 14.7374 | 14.9213 | 14.6856 | |
| Main channel = 10 dB, Adjacent channel = 45 dB | 14.6835 | 14.6205 | 14.7322 | 14.9192 | 14.6792 | |
| Main channel = 15 dB | 14.8545 | 14.8214 | 14.8683 | 14.9599 | 14.8496 | |
| Main channel = 15 dB, Adjacent channel = 45 dB | 14.8485 | 14.8123 | 14.8630 | 14.9578 | 14.8432 | |
| Protection Viewpoint | Main channel = 1 dB | 14.8830 | 14.8549 | 14.8917 | 14.9673 | 14.8782 |
| Main channel = 1 dB, Adjacent channel = 28 dB | 14.5372 | 14.4558 | 14.3666 | 14.6939 | 14.4616 | |
| Main channel = 0.1 dB | 14.8664 | 14.8351 | 14.8782 | 14.9630 | 14.8616 | |
| Main channel = 0.1 dB, Adjacent channel = 27.1 dB | 14.4720 | 14.8429 | 14.5745 | 14.8661 | 14.4792 | |
| FCC regulations | Main channel = 41 dBu | 14.7762 | 14.6795 | 14.6510 | 14.8844 | 14.7050 |
From the pollution viewpoint with = dB, 85.29% of the area in India has all the 15 channels available as white space, while in 100% of the area, 12 or more channels are available as white space. Similar results are obtained using the protection viewpoint with = 1 dB which shows that in 74.75% of the area in India, all the 15 channels are available for TV white space secondary operations, and in 99.47% of the area, 10 or more channels are available as white space. With the FCC regulations, which are considered to be conservative (see [5]), 73.66% of the area in India have all 15 channels available for TV white space operations, while in 100% of the area 12 or more channels are available as white space. Table II gives the average number of channels available in the UHF TV bands in the four zones using different methods described earlier.
| Method | Parameters | 10 channels free | 12 channels free | 15 channels free |
| Pollution Viewpoint | Main channel = 5 dB | 100% | 100% | 36.69% |
| Main channel = 5 dB, adjacent channel = 45 dB | 100% | 100% | 36.43% | |
| Main channel = 10 dB | 100% | 100% | 71.61% | |
| Main channel = 10 dB, adjacent channel = 45 dB | 100% | 100% | 71.39% | |
| Main channel = 15 dB | 100% | 100% | 85.51 | |
| Main channel = 15 dB, adjacent channel = 45 dB | 100% | 100% | 85.29% | |
| Protection viewpoint | Main channel = 1 dB | 100% | 100% | 88.19% |
| Main channel = 1 dB, adjacent channel = 28 dB | 99.88% | 99.04% | 74.75% | |
| Main channel = 0.1 dB | 100% | 100% | 86.62% | |
| Main channel = 0.1 dB, Adjacent channel = 27.1 dB | 99.99% | 99.57% | 73.69% | |
| FCC Regulations | Main channel =41 dBu | 100% | 100% | 73.66% |
Conclusions that can be drawn from Table II are as follows:
-
1.
Out of the 15 UHF TV channels (470-590 MHz), the average number of TV channels available for secondary usage is above 14 (112MHz) in each of the four zones.
-
2.
Available TV white space is the maxium in the North East, where 18 transmitters operate in the UHF band.
-
3.
If we use the adjacent channel constraint, the available white space decreases. However, this decrease is less than 1% in each case.
V-B Comparison of Indian TV white space Scenario with other countries
Table III concludes that in almost all cases at least 12 out of the 15 channels (80%) are available as TV white space in 100% of the areas in India. This is larger than Japan [8], where out of 40 channels, on an average 16.67 channels (41.67%) are available in 84.3% of the areas. This white space is also larger than what is available in US and the European countries. The available TV white space by area in Germany, UK, Switzerland, Denmark on an average are 19.2 (48%), 23.1 (58%), 25.3 (63%) and 24.4 (61%) channels out of the 40 channels respectively [7]. Similarly, as compared to the US, the available TV white space in India is much larger. It must be noted that in TV white space studies across the world, the IMT-A band is also included.
VI Proposed Channel Allocation Scheme
There are a total of 254 Doordarshan TV transmitters in the four zones illustrated in Fig. 6 operating in the -MHz. Currently, in these zones, 14 out of the 15 channels (channels -) are sparsely used for transmissions. As shown in Fig. 6, channels allocated to the transmitters are reused inefficiently or at very large distances.
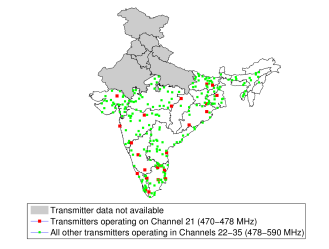
For instance, out of the transmitters, only transmitters in the four zones operate on channel . We propose a channel allocation scheme such that the minimum number of TV channels are used in each zone, while ensuring that the coverage areas of different transmitters do not overlap. The algorithm of the proposed channel allocation scheme is as follows.
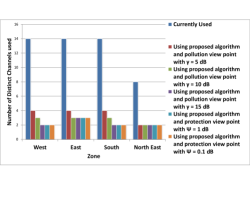
Using the algorithm described above, the minimum number of distinct channels required without any overlap of the coverage areas for four zones are given in Fig. 7. Under this channel allocation scheme, the maximum number of distinct TV channels required in the entire zone is four, which is much smaller than the fourteen channels currently used in India. To avoid adjacent channel interference, the overlapping channels must be non-adjacent.
VII Conclusions
In this paper, quantitative analysis of the available TV white space in the -MHz UHF TV band in India was performed. It is observed that unlike developed countries, a major portion of TV band spectrum is unutilized in India. The results show that even while using conservative parameters, in at least % areas in the four zones all the channels (% of the TV band spectrum) are free! The average available TV white space was calculated using two methods: (i) the protection and pollution viewpoints [5]; and, (ii) the FCC regulations [10]. By both methods, the average available TV white space in the UHF TV band was shown to be more than MHz! An algorithm was proposed for reassignment of TV transmitter frequencies to maximize unused spectrum. It was observed that four TV channels (or MHz) are sufficient to provide the existing UHF TV band coverage in India.
In the future, we plan to obtain and include the missing north zone data in our work. We also wish to explore suitable regulations in India for the TV white space to enable affordable broadband coverage. This is timely and important since policy intent for TV white space was made in NFAP 2011.
References
- [1] M. Islam et. al, “Spectrum survey in Singapore: Occupancy Measurements and Analyses,” in Proc. of 3rd Intl. Conference on Cognitive Radio Oriented Wireless Networks and Communications, May 2008, pp. 1-7.
- [2] R. Chiang, G. Rowe, and K. Sowerby, “A Quantitative Analysis of Spectral Occupancy Measurements for Cognitive Radio,” in Proc. of IEEE 65th Vehicular Technology Conference, Apr. 2007, pp. 3016-3020.
- [3] M. McHenry et. al, “Chicago Spectrum Occupancy Measurements & analysis and a Long-term Studies Proposal,” in Proc. of the ACM 1st Intl. Wkshp. on Tech. and Policy for Accessing Spectrum, Aug. 2006, pp. 1-12.
- [4] M. Lopez-Benitez, A. Umbert, and F. Casadevall. “Evaluation of Spectrum Occupancy in Spain for Cognitive Radio Applications,” in Proc. of IEEE 69th Vehicular Technology Conference, Apr. 2009, pp. 1-5.
- [5] S. Mishra, and A. Sahai, “How much white space is there?,” Tech. Report UCB/EECS-2009-3, EECS Department, UC Berkeley, Jan. 2009: http://www.eecs.berkeley.edu/Pubs/TechRpts/2009/EECS-2009-3.html.
- [6] M. Nekovee, “Quantifying the Availability of TV White Spaces for Cognitive Radio Operation in the UK,” in Proc. of IEEE Intl. Conf. on Communications Workshops, Jun. 2009, pp. 1-5.
- [7] J. van de Beek et. al “TV White Space in Europe,” in IEEE Trans. on Mobile Computing, vol.11, no.2, Feb. 2012, pp. 178-188.
- [8] T. Shimomura, T. Oyama and H. Seki, “Analysis of TV White Space Availability in Japan,” in Proc. of IEEE Vehicular Tech. Conf., Sep. 2012.
- [9] P. Kumar et. al, “White Space Detection and Spectrum Characterization in Urban and Rural India,” in Proc. of IEEE 14th Intl. Symp. and Wkshops on a World of Wireless, Mobile and Multimedia Networks, Jun. 2013, pp. 1-6.
- [10] US Federal Communication Commission, “Second Report and Order and Memorandum Opinion and Order,” Tech. Rep. 08-260, Nov. 2008.
- [11] Ofcom, “Digital dividend: cognitive access. Consultation on license-exempting cognitive devices using interleaved spectrum,” Feb. 2009. http://stakeholders.ofcom.org.uk/binaries/consultations/cognitive/statement/statement.pdf
- [12] “National Frequency Allocation Plan 2011, WPC, Department of Telecom., Govt. of India,” http://www.dot.gov.in/as/Draft%20NFAP-2011.pdf
- [13] M. Hata, “Empirical Formula for Propagation Loss in Land Mobile Radio Services,” in IEEE Trans. on Vehicular Technology, vol.29, no.3, Aug. 1980, pp. 317-325.
- [14] M. V. S. N. Prasad, and I. Ahmad. “Comparison of some path loss prediction methods with VHF/UHF measurements,” in IEEE Trans. on Broadcasting, vol.43, no.4, Dec. 1997, pp. 459-486.
- [15] US FCC, “Longley-rice methodology for evaluating TV coverage and interference,” OET Bulletin 69, Feb. 2004.