x \publishyear2013 \frompageDusty Universe viewed by AKARI far infrared detector \topage8
Dusty Universe viewed by AKARI far infrared detector
Abstract
We present the results of the analysis of multiwavelength Spectral Energy Distributions (SEDs) of far-infrared galaxies detected in the AKARI Deep Field-South (ADF–S) Survey. The analysis uses a carefully selected sample of 186 sources detected at the 90 m AKARI band, identified as galaxies with cross-identification in public catalogues. For sources without known spectroscopic redshifts, we estimate photometric redshifts after a test of two independent methods: one based on using mainly the optical – mid infrared range, and one based on the whole range of ultraviolet – far infrared data. We observe a vast improvement in the estimation of photometric redshifts when far infrared data are included, compared with an approach based mainly on the optical – mid infrared range. We discuss the physical properties of our far-infrared-selected sample. We conclude that this sample consists mostly of rich in dust and young stars nearby galaxies, and, furthermore, that almost 25% of these sources are (Ultra)Luminous Infrared Galaxies. Average SEDs normalized at 90 m for normal galaxies (138 sources), LIRGs (30 sources), and ULIRGs (18 galaxies) a the significant shift in the peak wavelength of the dust emission, and an increasing ratio between their bolometric and dust luminosities which varies from 0.39 to 0.73.
keywords:
galaxies, starburst galaxies, SED, spectral energy distribution, LIRGs, ULIRGs1 Introduction
Star formation (SF) history holds the key to understanding galaxy evolution, and - from a wider perspective - the nature of our Universe. One of the obstacles to observing starburst regions in galaxies using optical telescopes is dust. On the other hand, protostars form from dust clouds and molecular gas. Most of the dust in galaxies is quite cool ( 10-20 K), and its emission is visible only in the far infrared (Glass, 1999). A warm dust component might be observable during starburst activity (Phillips, 2005). The newly born, blue massive stars are surrounded by gas and dust, which obscure the most interesting regions and, additionally, absorb a part of the ultraviolet (UV) light emitted by stars. Dust heated in this way re-emits the absorbed light in the infrared wavelengths, mostly in the far infrared. Even very careful observations in the UV and optical ranges of wavelengths cannot provide a detailed description of the SF processes in galaxies. The infrared (IR) emission, reflecting the dust-obscured SF activity of galaxies (Genzel & Cesarsky, 2000), combined together with UV and optical data, can give full information about the star formation history and rate. Additionally, the ratio between the UV and far infrared (FIR) emission may serve as an indicator of the dust attenuation in galaxies (e.g., Buat et al., 2005, Takeuchi et al., 2005, Noll et al., 2009). The first all-sky survey at IR was performed by the satellite IRAS (The Infra-Red Astronomical Satellite, Neugebauer et al., 1984). IRAS mapped the sky at 12 m, 15 m, 60 m, and 100 m for 300 days and forever changed our view of the sky (Beichman, 1987). IRAS detected IR emission from about 350 000 astronomical sources, and the number of known astronomical objects went up by 70%. A large fraction of the extragalactic sources detected in the far infrared were spiral galaxies, quasars (QSOs), Seyfert galaxies, and early type galaxies (Genzel & Cesarsky, 2000), but also new classes of galaxies very bright in the IR, such as ULIRGs (ultra-luminous infrared galaxies), were found. IR satellite missions, focusing on selected areas, were followed by MSX (Midcourse Space Experiment, e.g., Egan et al., 2003), ISO (Infrared Space Observatory,e.g., Verma et al., 2005; Genzel & Cesarsky, 2000), and SST (The Spitzer Space Telescope, e.g., Soifer et al., 2008).
After more than 20 years, a Japanese spacecraft, AKARI (akari means warm-light in Japanese), performed a new all-sky survey with a much higher angular resolution than IRAS (Murakami et al., 2007). AKARI has also provided deeper surveys centered on the North and South Ecliptic Poles (e.g., Wada et al., 2008, Takagi et al., 2012, Matsuura et al., 2011). In particular, with the Far-Infrared Surveyor (FIS, Kawada et al., 2007), observations in the four FIR bands were possible (65 m, 90 m, 140 m, and 160 m). Among the observed fields, the lowest Galactic cirrus emission density region near the South Ecliptic Pole was selected for deep observation, to provide the best FIR extragalactic image of the Universe. This field is referred to as the AKARI Deep Field South (ADF–S). This survey is unique in having a continuous wavelength coverage with four photometric bands and mapping over a wide area (approximately 12 square degrees). In the ADF-S, 2 263 infrared sources were detected down to 20 mJy at the 90 m band, and infrared colours for about 400 of these sources were measured. The first analysis of this sample in terms of the nature and properties for 1000 ADF–S objects brighter than 0.301 Jy in the 90 m band was presented by Małek et al. (2010).
In this work, we present a more sophisticated approach to the analysis than the previous analysis (Malek et al., 2010) of the ADF–S sources in multiwavelength studies, based on a sample of 545 identified galaxies. In Section 2, we present our data and sample selection. We discuss the spectroscopic redshifts distribution in Section 3, and a new approach to the estimation of photometric redshifts based on the Le PHARE and CIGALE codes in Section 4. Discussion of physical and statistical properties of the obtained SEDs is presented in Section 5. The basic properties of a sample of galaxies with known spectroscopic redshifts are shown in Section 6. A discussion of (U)LIRGs properties found in our sample is presented in Section 7. Section 8 presents our conclusions.
In all calculations in this paper we assume the flat model of the Universe, with = 0.3, = 0.7, and = 70 km .
2 Data
The main aim of our work is to build a galaxy sample with high quality fluxes from the UV to the FIR using the ADF–S sample. Redshift information is also needed to obtain physical parameters from the SEDs.
Our sample is drawn from the AKARI ADF–S catalog presented by Małek et al. (2010), and published at the Centre de Données astronomiques de Strasbourg, Strasbourg astronomical Data Center (http://cdsarc.u-strasbg.fr/viz-bin/qcat?J/A+A/514/A11). The sample consists of the 545 ADF–S sources from the so-called 6 catalog (S0.0301Jy, which corresponds to the 6 detection level) measured by the AKARI FIS detector, for which the optical counterparts were found in public catalogues (Małek et al., 2010). Additional measurements, mostly from WISE (Wright et al., 2010) and GALEX (Dale et al., 2007), and further information from public databases (SIMBAD http://simbad.u-strasbg.fr/simbad/, NED http://ned.ipac.caltech.edu/, and IRSA http://irsa.ipac.caltech.edu/) were used in our present analysis (see also Małek et al., 2013).
3 Spectroscopic redshifts distribution
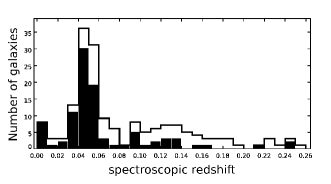
In total (data coming from Małek et al., 2010; the dedicated spectroscopic measurements of selected ADF–S sources performed by Sedgwick et al., 2011; new data from the NED and SIMBAD databases) we have 173 galaxies with known spectroscopic redshifts (). The mean value of the redshift in this sample is equal to , with a median value of 0.06. This implies, together with AKARI FIR measurements, that our sample mainly consists of nearby FIR-bright galaxies.
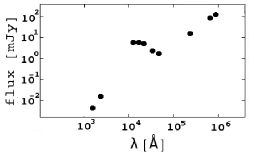
Unfortunately, the majority of our sample with spectroscopic redshift information does not have enough photometric measurements to fit SED models with a high confidence. After a visual inspection of all the spectra, we decided to apply a more stricter selection criterion, and for the next procedure we have chosen only galaxies with at least six photometric measurements in the whole spectral range. Since our sample selection was based on the WIDE-S 90 m AKARI band, each galaxy has at least one measurement in the FIR, at 90 m. Additionally, 95% of sources are detected in the MIR, all galaxies have optical information, and half of them were also detected in the UV. The typical spectral coverage of a source from our sample is shown in Fig. 1. After this selection, 95 galaxies from the initial sample of 173 galaxies with a known spectroscopic redshift remained for the subsequent analysis. All the available measurements from the ADF–S database were used for the SED fitting.
The redshift distribution of the selected sample with spectroscopic redshifts is presented in Fig. 2.
4 Photometric redshifts
The information about spectroscopic redshifts is available for 173 galaxies among 545 galaxies identified by Małek et al. (2010). It implies that more than 68% of sources in our sample have an identification in public catalogues as galaxies with photometric data but no redshift. In order to analyse properties of all the identified galaxies, we decided to estimate the photometric redshifts () for all galaxies with at least 6 measurements in the whole spectral range (127 galaxies fulfill this condition).
We performed a test of the accuracy of the photometric redshift for the sample of 95 galaxies with known and at least 6 photometric measurements in the whole spectral range (see Fig. 1). As representative parameters describing the accuracy of our method we used the percentage of successfully estimated redshifts, and the percentage of catastrophic errors (hereafter CE), which meet the condition:
| (1) |
following Ilbert et al. (2006). The fraction of CE (hereafter ) is defined as the ratio of galaxies for which CE occurred and all the galaxies in the sample. The redshift accuracy was measured using the normalized median absolute deviation:
| (2) |
where is the difference between spectroscopic and estimated photometric redshift.
To estimate the photometric redshifts we used two different codes:
– Le PHARE:
Photometric Analysis for Redshift Estimate version 2.2 (Le PHARE111http://www.cfht.hawaii.edu/arnouts/LEPHARE/lephare.html; Arnouts et al., 1999, Ilbert et al., 2006) code. We tested all the available libraries, one by one, of galaxy SEDs included in the Le PHARE distribution. Using the sources with spectroscopic redshifts available as a test sample, we checked the performance of all the available libraries: the percentage of sources for which the photometric redshift estimation could be performed successfully, and the scatter between estimated photometric and ”real” spectroscopic values of redshifts. The best results were obtained for the Rieke library, which includes eleven SEDs of luminous star forming galaxies constructed by Rieke et al. (2009). This is not very surprising, since it is expected that most of our galaxies belong to this class of galaxies.
– CIGALE:
Considering that a significant part of our data is in the FIR, which is not well covered by the templates included in the Le PHARE distribution, we decided to test a different approach, i.e. to use the Code Investigating GALaxy Emission222http://cigale.oamp.fr/ (CIGALE; Noll et al., 2009) SED fitting program as a tool for the estimation of photometric redshifts. CIGALE was not developed as a tool for the estimation of but since it uses a large number of models covering the wide spectral range, including IR and FIR, it may be expected to provide a better for our FIR-selected sample than the software that mainly uses optical to NIR data.
In the case of CIGALE, the values of parameters defined above were: =9.47% and =0.06. We found that less than 10% of suffer from CE. CE occurred in the case of nine galaxies, and the mean value of for the CE subsample was equal to 0.22 0.06, with minimum and maximum values of CE equal to 0.16 and 0.34, respectively.
Performing the same test with Le PHARE we obtained =14.73% and =0.05. We were not able to estimate photometric redshifts for 11 galaxies, and, additionally, CE occurred for three galaxies. The mean value of for the CE subsample was equal to 0.27 0.02 (with minimum and maximum values of CE equal to 0.26 and 0.28, respectively). Thus, we conclude that the deviation from the real value for the successful measurements was lower in the case of Le PHARE; however, the percentage of successful measurements was higher when CIGALE was used. Thus, Le PHARE provides higher accuracy while CIGALE assures a higher success rate for our FIR-selected sample. We have also checked that the amplitude of CEs (both mean and median values) was smaller in the case of CIGALE. For example, the minimum value of CE for CIGALE equals 0.16 (two galaxies), and it is very close to the CEs boundary limit.
This result is most likely related to our sample selection (which consists of galaxies bright at 90 m), and its spectral coverage, in particular a small amount of optical and MIR measurements which are needed by Le PHARE to determine the galaxy properties (e.g. Balmer break) properly. The possible explanation of a better performance of CIGALE is the limited number of FIR templates used by Le PHARE. Additionally, according to Ilbert et al. (2006), Le PHARE has the best performance in the redshift range 0.2z1.5, while our spectroscopic range (0z0.25) lies outside this redshift range. For galaxies with spectroscopic redshifts lower than 0.2 Ilbert et al. (2006) have found a dramatic increase of the fraction of CE, caused by the mismatch between the Balmer break and the intergalactic Lyman-alpha forest depression at 1216 Å. Yet another reason for the lower percentage of redshifts measured successfully by Le Phare are the spectral types of galaxies which dominate in our sample: photometric redshifts of actively star forming galaxies are less reliable (the fraction of CE increases by a factor of 5 from the elliptical to the starburst galaxies for a sample used by Ilbert et al., 2006).
Consequently, for the subsequent analysis we decided to use for sources without a known . A more detailed comparison of the estimation of photometric redshifts by Le PHARE and CIGALE can be found in Małek et al. (2013).
5 SED fitting
To study the physical parameters of the ADF–S sources, we selected galaxies with a known or , and with the highest quality photometry available. The main selection criteria were to have redshift information, together with at least six measurements in the whole spectral range. As a result, we use 222 galaxies: 95 sources with and 127 galaxies with . All available photometric measurements for these galaxies were used for the SED fitting with CIGALE.
CIGALE uses models describing the emission from a galaxy in the wavelength range from the rest-frame far-UV to the rest–frame far–IR (Noll et al., 2011). The code derives physical parameters of galaxies by fitting their spectral energy distributions (SEDs) to SEDs based on models and templates. CIGALE takes into account both the dust UV attenuation and IR emission. Based on possible values for each physical parameter related to star formation history, dust attenuation, and dust emission, CIGALE computes all possible spectra and derives mean fluxes in the observed filters. For each galaxy, the best value for each parameter, as well as the best fitted model, is found using a Bayesian-like statistical analysis (Roehlly et al., 2012).
Models of stellar emission are given either by Maraston (2005) or Fioc & Rocca-Volmerange (1997). The absorption and scattering of stellar light by dust, the so-called attenuation curves for galaxies, are given by Calzetti et al. (2000). Dust emission is characterized by a power-law model proposed by Dale and Helou (2002), with the slope of the relation between the dust mass and the heating intensity. This is the only dust emission model included in the newest CIGALE distribution (CIGALE version 2013/01/02).
To reconstruct more accurately Star Formation Rates (SFRs), CIGALE uses the single stellar population of Maraston (2005). For the old stellar population, CIGALE calculates old stellar population history (SFH1) with exponential decrease:
| (3) |
In our work we have adopted the box model for the young stellar population history (SFH2), with constant star formation over a limited period of time, starting from 0.0025 to 1 Gyr ago (parameter in Table LABEL:cigale_parameters). In the case of a box model, the SFH2 is computed as the galaxy mass divided by its age. Thus, CIGALE gives a total value of logSFR, defined as:
| (4) |
where is the fraction of the young stellar population.
The list of input parameters of CIGALE is shown in Table LABEL:cigale_parameters.
| Symbol | Range | |
|---|---|---|
| Star formation history | ||
| metallicities (solar metalicity) | Z | 0.2 |
| of old stellar population models in Gyr | 1. 3. 10. | |
| ages of old stellar population models in Gyr | 13 | |
| ages of young stellar population models in Gyr | 0.025 0.05 0.1 0.3 1.0 | |
| fraction of young stellar population | 0.001 0.01 0.1 0.999 | |
| Dust attenuation | ||
| slope correction of the Calzetti law | -0.3 -0.2 -0.1 0. 0.1 0.2 | |
| V-band attenuation for the young stellar population | 0.15 0.30 0.45 0.60 0.75 0.90 1.05 1.2 1.35 1.5 1.65 1.8 1.95 2.10 | |
| Reduction factor of the dust attenuation at 5500Å for old stellar population models | 0.0 0.5 1.0 | |
| Dust emission | ||
| IR power-law slope | 0.5 1.0 1.5 1.75 2.0 2.25 2.5 4.0 | |
| fraction of AGN model | 0. 0.1 0.25 |
The reliability of the retrieved parameters for galaxies with known spectroscopic redshifts was checked using the mock catalogue of artificial galaxies (Małek et al., 2013). The comparison between the results from the mock and real catalogues shows that CIGALE gives a very good estimation of stellar masses, star formation rates, ages sensitivity D4000 index, dust attenuations and dust emissions, bolometric and dust luminosities (with values of the linear Pearson moment correlation coefficient, r, higher than 0.8). The accuracy of the relation between the dust mass and the heating intensity, , is estimated with a lower efficiency (r=0.55).
6 Physical properties of ADF–S sample
We restrict the further analysis to the SEDs with a minimum value of lower than four.
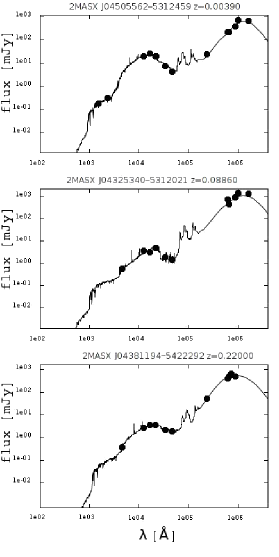
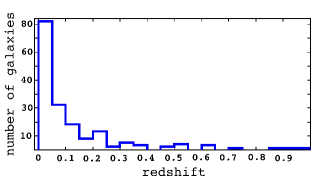
This condition was met by 186 galaxies (73 galaxies with and 113 sources with an estimated ). Consequently, we assume that SEDs were successfully fitted only for this final sample. The redshift distribution of this sample is shown in Fig. 4. Examples of the best fit models obtained from CIGALE are given in Fig. 3.
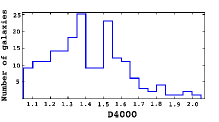
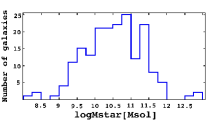
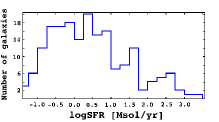
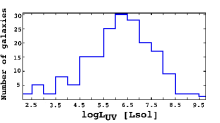
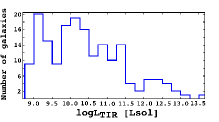
The distribution of the main parameters (estimated with the Bayesian analysis for 186 galaxies in our final sample) is plotted in Fig. 5. We found that galaxies in our sample are typically very massive, with a mean value of . Moreover, these galaxies are rather luminous , and also their dust luminosity is high , but without a precisely defined maximum. A median value of the star formation rate parameter, SFR, is equal to 2.22 . The estimated value of the heating intensity (Dale & Helou, 2002) implies that the vast majority of analysed galaxies (85.48%) belong to a normal, star-forming galaxy population, with median the value of equal to 2.01. The median value of the parameter, describing the effective dust attenuation for the stellar population at a wavelength equal to 5500 Å is 0.47 [mag], and the median value for the attenuation in the FUV (at 1500 Å, ) is 1.87 [mag]. The parameter , which describes the V-band attenuation for the young stellar population model, spreads almost across the entire range of input parameters from 0.15 to 2.19, with the median value 0.97 [mag].
7 Average Spectral Energy Distributions
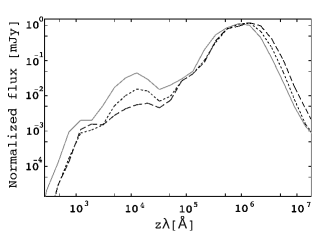
Using the CIGALE output, we created average SEDs from our 186 galaxies. First, we normalized all SEDs at a rest frame 90 m; then we divided them into 3 broad categories: Ultraluminous Infrared Galaxies (ULIRGs), Luminous Infrared Galaxies (LIRGs), and the remaining galaxies.
Following Sanders & Mirabel (1996), we define ULIRGs as galaxies with a very high IR luminosity, , where is the total mid- and far-infrared luminosity calculated in the range between 8(1+z) m and mm. Sources with less extreme, but still high, IR luminosities are classified as LIRGs. In our sample, we found 18 ULIRGs (9.7% of analysed ADF–S sources) and 30 LIRGs (16.1% of the total number of sources).
Average SEDs for ULIRGs, LIRGs and the remaining galaxies are plotted in Fig. 6.
The ratio of bolometric to total mid- and far-infrared luminosity (the integrated luminosities calculated from CIGALE) is higher for the ULIRGs and LIRGs than for the normal galaxies. In the case of the average SEDs, the ratio is equal to 0.73 0.16 for the ULIRGs, 0.55 0.16 for the LIRGs, and 0.39 0.22 for the remaining galaxies. Both ULIRGs and LIRGs in our sample contain dust which is cooler than the dust in the remaining galaxies, which can be seen as a shift of the maximal values of the dust components towards longer wavelengths. The brighter the sample is in the IR, the more shifted is the dust peak towards the longer wavelengths. In our sample, the maximum of the dust peak in the spectra normalized to 90 m is located at 1.38Å, 1.21Å, and 8.65Å for the ULIRGs, LIRGs and normal galaxies, respectively.
The median redshift for ULIRGs in our sample is equal to 0.54. The median redshift for LIRGs, and the remaining galaxies was found to be 0.2, and 0.04, respectively. This difference in redshifts is a selection effect, related to the fact that the primary detection limit is in the FIR. The two parameters SFR and LTIR might be correlated because both of them depend on the galaxy mass, but they are estimated independently. For the ULIRGs, the logSFR is very high, with a mean value 2.59 0.32 . The SFR for the LIRGs is more than ten times lower (the mean logSFR is equal to 1.47 0.28 ).
The SFR for the normal galaxies is much lower: we found the logSFR on the level of -0.06 0.62 . Comparing our results to the sample of normal, nearby galaxies from SINGS (Kennicutt et al., 2003) we found a similar range of SFR: 0-12 for the ADF-S, and 0-15 for the SINGS sample.
Comparing the results obtained by U et al. (2012) for a sample of 53 LIRGs and 11 ULIRGs in the similar redshift range (z between 0.012 and 0.083) from the Great Observatories All-sky LIRG Survey (GOALS), we found a very good agreement of SFR for LIRGs (logSFRLIRGs = 1.57 0.19 ). The mean value of logSFRULIRGs in the case of our ADF–S sample is higher than the one found by U et al. (2012) and equals logSFRULIRGs = 2.25 0.16 , but is still consistent within the error bars.
The LIRGs in the ADF-S sample have a mean logMstar at 11.15 0.49 . This value is slightly higher than logMstar for LIRGs reported by U et al. 2012 (10.75 0.39 ), Giovannoli et al. 2011 (LIRGs sample, with logMstar between 10 and 12, and with a peak at 10.8), and Melbourne et al. 2008 (logMstar 10.5, based on a set 15 LIRGs, at redshift 0.8). Even though our result shows the highest value of logMstar, it is still consistent with the values listed above within the error bars. Stellar masses for the ULIRG sample have a mean logMstar equal to 11.43 0.31 . The mean stellar masses for 11 ULIRGs presented by U et al. (2012) were calculated as logMstar=11.00 0.40 . The sample of ULIRGs analysed by Howell et al. (2010) is characterized by a mean stellar mass logMstar=11.24 0.25 . We conclude that the (U)LIRGs in our ADF-S sample are slightly more massive than those in the samples used in previous works, but still all the samples are statistically consistent.
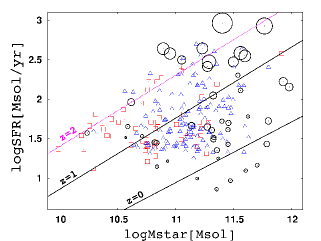
Figure 7 shows the relation between the SFRs and stellar masses for (U)LIRGs in our ADF–S catalogue. The mean redshift of the (U)LIRG sample is equal to 0.34 (minimum and maximum redshifts are equal to 0.09 and 0.98, respectively - then, the redshift distribution is quite broad). We compared our results with observations at redshifts 0 and 1 (Elbaz et al., 2007), and 2 (Daddi, et al., 2007), and also with other data mentioned above: a sample of nearby (z0.032) (U)LIRGs (U et al., 2012), and a sample of LIRGs observed in the GOALS by GALEX and the Spitzer Space Telescope (Howell et al., 2010). We found a rather flat distribution of the SFR parameter in the stellar mass space (similar to Giovannoli et al., 2011, who found for a sample of LIRGs in the Extended Chandra Deep Field South at z = 0.7, selected at 24 m by Spitzer). Our results, shown in Fig. 7, confirm a strong correlation between SFR and redshift.
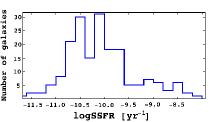
Based on the physical properties obtained from SED fitting, we computed the Specific Star Formation Rates (SSFR [yr-1]; defined as the ratio of SFR and stellar mass) for the ADF–S sample. The SSFR rate is commonly used to analyse star formation history. For ULIRGs, LIRGs, and the rest of our sample, the logarithmic values of the SSFR parameter are equal to -9.00 0.55, -9.68 0.59, and -10.28 0.57, respectively. Howell et al. (2010), and U. et al. (2012) presented the mean and median values of the SSFR for (U)LIRGs sample, without an additional separation. The median value of SSFR for galaxies in the GOALS field (Howell et al., 2010) is equal to -9.41 [yr-1], while U et al. (2012) obtained the value of -9.17 [yr-1]. The same parameter computed for LIRGs and ULIRGs together in our ADF–S sample is equal to -9.51 [yr-1]. We conclude that our results are consistent with the results mentioned in all the other works usedconsidered for comparison.
However, the dust emission power-law model, given by Dale and Helou (2002) implemented in CIGALE may not be efficient enough to describe the properties of the (U)LIRG sample well. In the future we plan to apply other models (e.g. Siebenmorgen & Krügel, 2007, Chary & Elbaz, 2001, Casey, 2012) to the same (U)LIRGs sample.
8 Conclusions
-
•
For our analysis we used an AKARI ADF–S catalogue (Małek et al., 2010), with additional information about spectroscopic redshifts (Małek et al., 2013)
-
•
The CIGALE (Noll et al., 2009), program for fitting SEDs, was used for the first time to estimate photometric redshifts for galaxies without known spectroscopic redshifts (127 galaxies), and then to fit Spectral Energy Distribution models to our whole sample. We conclude that although CIGALE was not designed as a tool for the estimation of , in the case of the ADF–S galaxies it is more efficient than the standard code (Le PHARE), based on the UV and optical data. This observation might be worth taking into account for IR-selected galaxies in the future analysis.
-
•
We used CIGALE for the redshift estimation for 127 galaxies with at least 6 photometric measurements in the whole spectral range, from UV to FIR. A satisfactory value of the parameter for the fit, lower than 4, was obtained for 186 galaxies.
-
•
Based on the physical parameters obtained from SED fitting, we conclude that our FIR selected sample consists mostly of nearby, massive galaxies, bright in the IR, and active in SF (a similar conclusion was found by White et al., 2012). The distribution of the SFR shows that our sample is characterized by a rather high star formation rate, with a the median value equal to 1.96 and 2.56 [], for galaxies with spectroscopic and estimated photometric redshift, respectively,
-
•
Average SEDs for ULIRGs, LIRGs and remaining galaxies from our sample, normalized at 90 m were created. Almost 25% of our sample are (U)LIRGs, rich in dust and active in star formation processes. For these galaxies we noticed a significant shift in the peak wavelength of the dust emission in the FIR and a different ratio between luminosities in the optical and IR parts of the spectra.
Acknowledgements.
We would like to thank both anonymous Reviewers for their very constructive comments and suggestions which helped to improve the quality of this paper. We thank Olivier Ilbert for useful discussions and kind help in using Le PHARE. This work is based on observations with AKARI a JAXA project with the participation of ESA. This research has made use of the SIMBAD and NED databases. KM, AP and AK were financed by the research grant of the Polish Ministry of Science N N203 512938. The collaboration between French and Polish participants was partially supported by the European Associated Laboratory Astrophysics Poland-France HECOLS. This research was partially supported by the project POLISH-SWISS ASTRO PROJECT co-financed by a grant from Switzerland through the Swiss Contribution to the enlarged European Union. KM has been supported from the Japan Society for the Promotion of Science (JSPS) Postdoctoral Fellowship for Foreign Researchers, P11802. TTT has been supported by the Grant-in-Aid for the Scientific Research Fund (20740105, 23340046, and 24111707) and for the Global COE Program Request for Fundamental Principles in the Universe: from Particles to the Solar System and the Cosmos commissioned by the Ministry of Education, Culture, Sports, Science and Technology (MEXT) of Japan. VB and DB have been supported by the Centre National des Etudes Spatiales (CNES) and the Programme National Galaxies (PNG). MM acknowledges support from NASA grants NNX08AU59G and NNX09AM45G for analysis of the GALEX data in the Akari Deep Fields.References
- [1] Arnouts, S., Cristiani, S., Moscardini, L., et al., Measuring and modelling the redshift evolution of clustering: the Hubble Deep Field North, MNRAS, 310, 540–556, 1999
- [2] Beichman, C. A., The IRAS view of the Galaxy and the solar system, ARA&A, 25, 521-563, 1987
- [3] Buat, V. and Giovannoli, E. and Takeuchi, T. T., et al., Spectral energy distributions of an AKARI-SDSS-GALEX sample of galaxies, A&A, 529, A22, 2011
- [4] Buat, V., Iglesias-Páramo, J., Seibert, M., et al., Dust Attenuation in the Nearby Universe: A Comparison between Galaxies Selected in the Ultraviolet and in the Far-Infrared, ApJ, 619, L51-L54, 2005
- [5] Calzetti, D., Armus, L., Bohlin, R. C., et al., The Dust Content and Opacity of Actively Star-forming Galaxies, ApJ, 533, 682-695, 2000
- [6] Casey, C. M., Far-infrared spectral energy distribution fitting for galaxies near and far, MNRAS, 425, 4, pp. 3094-3103, 2012
- [7] Chary, R. and Elbaz, D., Interpreting the Cosmic Infrared Background: Constraints on the Evolution of the Dust-enshrouded Star Formation Rate, ApJ, 556, 2, pp. 562-581, 2001
- [8] Daddi, E., Dickinson, M., Morrison, G., et al., Multiwavelength Study of Massive Galaxies at z2. I. Star Formation and Galaxy Growth, ApJ, 670, 1, pp. 156-172, 2007
- [9] Dale, D. A., Gil de Paz, A., Gordon, K. D., et al., An Ultraviolet-to-Radio Broadband Spectral Atlas of Nearby Galaxies, APJ, 655, 863-884, 2007
- [10] Dale, D. A. and Helou, G.,The Infrared Spectral Energy Distribution of Normal Star-forming Galaxies: Calibration at Far-Infrared and Submillimeter Wavelengths, ApJ, 576, 2002
- [11] Egan, M. P., Price, S. D., Kraemer K. E., et al., VizieR Online Data Catalog, MSX6C Infrared Point Source Catalog. The Midcourse Space Experiment Point Source Catalog Version 2.3 (October 2003), 2114, 2003
- [12] Elbaz, D., Daddi, E., Le Borgne, D., et al., The reversal of the star formation-density relation in the distant universe, A&A, 468, 1, pp. 33-48, 2007
- [13] Fioc, M., Rocca-Volmerange, B., PEGASE: a UV to NIR spectral evolution model of galaxies. Application to the calibration of bright galaxy counts, A&A via CDS, 326, 950-962, 1997
- [14] Genzel, R. and Cesarsky, C. J., Extragalactic Results from the Infrared Space Observatory, ARA&A, 38, 761-814, 2000
- [15] Glass, I. S., Handbook of Infrared Astronomy, Edited by Ellis, R. and Huchra, J. and Kahn, S. and Rieke, G. and Stetson, P. B., 185, Cambridge Observing Handbooks for Research Astronomers, 1999
- [16] Giovannoli, E., Buat, V., Noll, S., et al., Population synthesis modelling of Luminous Infrared Galaxies at intermediate redshift, A&A, 525, A150, 2011
- [17] Howell, J. H., Armus, L., Mazzarella, J. M. et al., The Great Observatories All-sky LIRG Survey: Comparison of Ultraviolet and Far-infrared Properties, ApJ, 715, pp. 572-588, 2010
- [18] Ilbert, O., Arnouts, S., McCracken, H. J., et al., Accurate photometric redshifts for the CFHT legacy survey calibrated using the VIMOS VLT deep survey, A&A, 457, 841–856, 2006
- [19] Kawada, M., Baba, H., Barthel, P. D., et al., The Far-Infrared Surveyor (FIS) for AKARI, PASJ, 59, 389, 2007
- [20] Kennicutt, Jr., R. C., Armus, L., Bendo, G., et al., SINGS: The SIRTF Nearby Galaxies Survey, PASP, 115, 810, pp. 928-952, 2003
- [21] Małek, K., Pollo, A., Takeuchi, T. T., et al., Star forming galaxies in the AKARI deep field south: identifications and spectral energy distributions, A&A, 514, 511+, 2010
- [22] Małek, K., Pollo, A., Takeuchi, T. T., et al., Properties of star forming galaxies in AKARI Deep Field-South, A&A, 2013, submitted
- [23] Maraston, C., Evolutionary population synthesis: models, analysis of the ingredients and application to high-z galaxies, MNRAS, 362, 799-825, 2005
- [24] Matsuura, S., Shirahata, M., Kawada, M., et al., Detection of the Cosmic Far-infrared Background in AKARI Deep Field South, APJ, 737, 2, 2011
- [25] Melbourne, J., Ammons, M., Wright, S. A., et al., Triggered or Self-Regulated Star Formation within Intermediate Redshift Luminous Infrared Galaxies. I. Morphologies and Spectral Energy Distributions, AJ, 135, pp. 1207-1224, 2008
- [26] Murakami, K., Baba, H., Barthel, P. D. et al., The Infrared Astronomical Mission AKARI, PASJ, 59, 396, 2007
- [27] Neugebauer, G., Habing, H. J., van Duinen, R., et al., The Infrared Astronomical Satellite (IRAS) mission, ApJ, 278, 1984
- [28] Noll, S., Burgarella, D., Giovannoli, E., et al., Analysis of galaxy spectral energy distributions from far-UV to far-IR with CIGALE: studying a SINGS test sample, A&A, 507, 1793–1813, 2009
- [29] Noll, S., Burgarella, D., Giovannoli, E., et al., Readme file: CIGALE, Bayesian-like analysis of galaxy SEDs from UV to IR, 2011
- [30] Phillips, S., The Structure and Evolution of Galaxies, 319 pp, (publisher), ISBN 0-470-85507-X. Wiley-VCH, 2005
- [31] Rieke, G. H., Alonso-Herrero, A., Weiner, B. J., et al., Determining Star Formation Rates for Infrared Galaxies, ApJ, 692, 556, 2009
- [32] Roehlly, Y. and Burgarella, D. and Buat, et al., CIGALE: Code Investigating GALaxy Emission, in Astronomical Data Analysis Software and Systems XXI, Astronomical Society of the Pacific Conference Series, Edited by P. Ballester, D. Egret, and N.P.F. Lorente, 461, 2012
- [33] Sanders, D. B. and Mirabel, I. F.,Luminous Infrared Galaxies, ARA&A, 749, 1996
- [34] Sedgwick, C., Serjeant, S., Pearson, C., et al., (2011), Far-infrared luminosity function of local star-forming galaxies in the AKARI Deep Field-South, MNRAS, 416, 1862–1870, 2011
- [35] Siebenmorgen, R. and Krügel, E., Dust in starburst nuclei and ULIRGs. SED models for observers, A&A, 461, 2, pp. 445-453, 2007
- [36] Soifer, B. T., Helou, G., Werner, M., The Spitzer View of the Extragalactic Universe, ARA&A, 46, 201-240, 2008
- [37] Takagi, T., Matsuhara, H., Goto, T, , et al., The AKARI NEP-Deep survey: a mid-infrared source catalogue, AAP, 537, A24, 2012
- [38] Takeuchi, T. T., Buat, V., Burgarella, D., The evolution of the ultraviolet and infrared luminosity densities in the universe at 0 z 1, A&A, 440, L17-L20, 2005
- [39] U, V., Sanders, D. B., Mazzarella, J. Met al., Spectral Energy Distributions of Local Luminous and Ultraluminous Infrared Galaxies, ApJ Supplement,203, 1, 2012
- [40] Verma, A., Charmandaris, V., Klaas, U., et al., Obscured Activity: AGN, Quasars, Starbursts and ULIGs Observed by the Infrared Space Observatory, Space Science Reviews, 119, 355–407, 2005
- [41] Wada, T., Matsuhara, H., Oyabu, S., et al., AKARI/IRC Deep Survey in the North Ecliptic Pole Region, PASJ, 60,517, 2008
- [42] White, G. J., Hatsukade, B., Pearson, C., A deep ATCA 20cm radio survey of the AKARI Deep Field South near the South Ecliptic Pole, MNRAS, 427, 3, pp. 1830-1846, 2012
- [43] Wright, E. L., Eisenhardt, P. R. M., Mainzer, A. K., et al., The Wide-field Infrared Survey Explorer (WISE): Mission Description and Initial On-orbit Performance, AJ, 140,1868-1881, 2010
- [44]