Quantum Storage of Heralded Single Photons in a Praseodymium Doped Crystal
Abstract
We report on experiments demonstrating the reversible mapping of heralded single photons to long lived collective optical atomic excitations stored in a Pr3+:Y2SiO5 crystal. A cavity-enhanced spontaneous down-conversion source is employed to produce widely non-degenerate narrow-band () photon-pairs. The idler photons, whose frequency is compatible with telecommunication optical fibers, are used to herald the creation of the signal photons, compatible with the Pr3+ transition. The signal photons are stored and retrieved using the atomic frequency comb protocol. We demonstrate storage times up to while preserving non-classical correlations between the heralding and the retrieved photon. This is more than 20 times longer than in previous realizations in solid state devices, and implemented in a system ideally suited for the extension to spin-wave storage.
pacs:
03.67.Hk,42.50.Gy,42.50.MdMany protocols in quantum information science rely on the efficient and reversible interaction between photons and matter Hammerer2010 . The interaction lays the basis for the realization of quantum memories for light and of their application, e.g. in quantum repeaters Briegel1998 ; Sangouard2011 . Possible choices for the system used to store light are single atoms in cavities Specht2011 , cold or hot atomic gases Chaneliere2005 ; Chou2005 ; Simon2007c ; Radnaev2010 ; Zhang2011 ; Julsgaard2004 ; Eisaman2005 ; Reim2011 ; Hosseini2011 , or rare earth (RE) doped solid state systems Tittel2010 . Thanks to the weak interaction between the optical active ions and the environment, RE doped crystals offer, when cryogenically cooled, the long optical and spin coherence times typical of atomic systems, free of the drawbacks deriving from atomic motion Macfarlane2002 . Moreover they possess the benefits of the solid state systems, such as strong interaction with light, allowing for efficient storage of photons Hedges2010 ; Sabooni2013 and prospect for integrated devices. Furthermore, their inhomogeneously broadened absorption lines can be tailored in appropriate structures, like atomic frequency combs (AFCs), to enable storage protocols with remarkable properties (e.g. temporal or frequency multiplexing) Riedmatten2008 ; Afzelius2009 ; Usmani2010 ; Bonarota2011 ; Gundogan2013 ; Afzelius2010 ; Sinclair2013 .
Single photon level weak coherent pulses Sabooni2010 ; Chaneliere2010 and qubits Riedmatten2008 ; Gundogan2012 ; Zhou2012 have been stored in the excited state of rare-earth doped crystals using the AFC scheme. This has recently been extended to the ground state, in the regime of a few photons per pulse Timoney2013 . The storage of non-classical light generated by spontaneous parametric down-conversion (SPDC) has also been demonstrated and enabled entanglement between one photon and one collective optical atomic excitation in a crystal Clausen2011 ; Saglamyurek2011 , entanglement between two crystals Usmani2012 , and single photon qubit storage Clausen2012 ; Saglamyurek2012 . However, the mapping of non-classical light using AFC in rare earth doped crystals was obtained so far only in systems with two ground state levels, thus inherently limited to the optical coherence and not directly extendable to spin-wave storage.
On the contrary, Pr3+ or Eu3+ doped crystals have the required level structure for spin-wave storage Afzelius2010 ; Gundogan2013 ; Timoney2013 .
In particular, Pr3+:Y2SiO5 is one of the optical memories with the best demonstrated properties. Storage efficiencies as high as 69 for weak coherent states Hedges2010 and storage times up to 1 minute (the longest in any system so far) for classical images Heinze2013 have been reported. Despite these extraordinary performances, which make Pr3+:Y2SiO5 an excellent candidate for quantum memories, the storage of quantum light has never been achieved in this material. As a matter of fact, the pseudoquadrupolar interaction which splits the crystal-field singlets into hyperfine sub-levels, providing the three-fold ground state required for the storage in the spin state, also establishes a tight bound () to the bandwidth of the single photons to be stored. Recently a SPDC source has been developed to create ultranarrow-band photon-pairs, with the signal and the idler photons compatible with the Pr3+ transition at and with telecommunication optical fibers, respectively Fekete2013 .
In this Letter we report on experiments where one photon of the pair (signal), whose presence is heralded by the other photon (idler), is stored as a collective optical atomic excitation in a Pr3+:Y2SiO5 crystal with the AFC protocol. We show that the non-classical correlation between the two photons is preserved for storage times up to , more than 20 times longer than in previous solid state experiments Clausen2011 ; Saglamyurek2011 . The demonstrated non-classical correlations between an atomic excitation stored in a crystal and a photon at telecommunication wavelengths are an essential resource to generate heralded entanglement between remote crystals Simon2007a .
The AFC scheme Afzelius2009 relies on the creation of a series of narrow absorbing peaks with periodicity in a transparency window created within the inhomogeneous absorption profile of the crystal. The single photon is then mapped onto the crystal, leading, in the ideal case, to a single collective optical excitation: , where is the number of atoms, and are the ground and excited state, respectively, is the single photon wave vector, and () is the position (detuning) of atom . After an initial inhomogeneous dephasing, the atoms will rephase after a time giving rise to a re-emission of the photon in the forward direction, the so called AFC echo Riedmatten2008 .
Figure 1(a) represents the experimental setup. The coherent light at is obtained by sum frequency generation of and lasers Gundogan2013 . Its frequency is locked to a temperature stabilized cavity placed in a home-made vacuum chamber. Two beams are spatially separated, the first being used as a frequency reference for the photon-pair source Fekete2013 and the second for the memory preparation Gundogan2013 . Their frequency and amplitude are varied by double-pass acousto-optic modulators (AOMs) driven by an arbitrary waveform generator (Signadyne). After the AOMs, the beams are coupled into polarization maintaining single-mode fibers and out-coupled in two separated optical benches hosting the source and the cryostat (closed cycle cryogenic cooler, Oxford V14), which is exploited to cool the Pr3+:Y2SiO5 crystal down to .
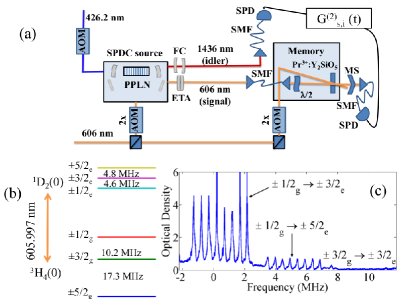
The heralded single photons are obtained from the photon-pair source, whose detailed description is given in ref. Fekete2013 . A CW pump beam at , modulated by an AOM, produces photons at (signal) and (idler) by SPDC in a temperature-stabilized periodically poled lithium niobate (PPLN) crystal. A bow-tie cavity surrounding the crystal enhances the SPDC process for the resonant frequencies. The cavity is stabilized with the reference beam at , to ensure the signal resonance with the Pr3+:Y2SiO5 crystal. To maintain the cavity resonant with the idler, the pump frequency is locked using light at the idler frequency created by difference frequency generation of the pump and the reference beam passing through the same PPLN crystal. The double resonance allows a very efficient suppression of the redundant spectral modes due to the so called clustering effect Fekete2013 . The photon-pairs’ spectrum is thus composed of a main- and two secondary-clusters separated by , each containing four longitudinal modes Fekete2013 . In order to operate in the single-mode regime, the heralding telecom photons are filtered by a home-made filter cavity (linewidth and free spectral range (FSR) ). They are then coupled into a single mode fiber and detected by an InGaAs single photon detector (SPD, IdQuantique id220, detection efficiency and dark count rate). The heralded photons are filtered with an etalon (linewidth and FSR ), resulting in the mere suppression of the secondary-clusters. They are then sent to the crystal via a single mode fiber. The optical transmission of the signal (idler) photon from the output of the bow-tie cavity to the cryostat (SPD) is (). To optimize the detection of the stored and retrieved photons, we switch off the pump beam using the AOM after the detection of an idler photon, thus interrupting the creation of new photon-pairs. The correlation time of the photon-pair is measured from the idler-signalcross-correlation function to be , corresponding to a photon bandwidth of () for the signal (idler) photons Fekete2013 .
Our storage device is a thick Y2SiO5 sample doped with a Pr3+ concentration of . The relevant optical transition is at nm with a measured absorption coefficient of and an inhomogeneous linewidth of Gundogan2013 . A half-wave plate () ensures the polarization of the photons to be aligned close to the optical D2 axis of the crystal, in order to maximize the absorption. To prevent noise from the strong preparation beam polluting the single photon mode, we use two different optical paths with an angle of . The maximum power in the preparation mode before the cryostat window is and the beam diameter at the crystal is . The beam diameter for the input mode is . The single photon mode is directed to a Si-SPD (Excelitas Technologies, efficiency and dark counts) via a single mode fiber.
To prepare the memory we follow the procedure thoroughly described in Nilsson2004 ; Gundogan2013 . We prepare a transparency window within the inhomogeneously broadened Pr3+ absorption at nm by sweeping the laser frequency by . The narrow transparency window contributes to select only one mode among the four remaining in the main-cluster of the source spectrum which are separated by Fekete2013 . Afterwards we tailor a single class AFC on the transition by first burning back atoms with pulses at frequencies differing by and then performing a cleaning sweep in the region of the transition (see Fig. 1(b)). To ensure the efficient absorption of the photons by the periodic structure, the total comb-width is set to (see Fig. 1(c) for an example with ). With the present preparation procedure (which lasts for ) we are able to tailor spectral features as narrow as . The input photon frequency is selected to be resonant with the transition. Note that the procedure used for the comb preparation empties the ground state. The transition could then be directly used to transfer optical excitations to spin excitations, as demonstrated in Afzelius2010 ; Gundogan2013 for bright pulses.
The arrival times of the photons to the detectors are recorded with a time-stamping card (Signadyne) and used to reconstruct the second-order cross-correlation function between signal and idler . A figure of merit for the non-classical nature of the photon correlations is the normalized cross-correlation function Sangouard2011 ; Clausen2011
| (1) |
where () is the probability to detect a signal (idler) photon and the probability to detect a coincidence in a time window centered at zero time delay. All the results presented in this paper are from raw data, without any background or dark count subtraction, unless otherwise stated.
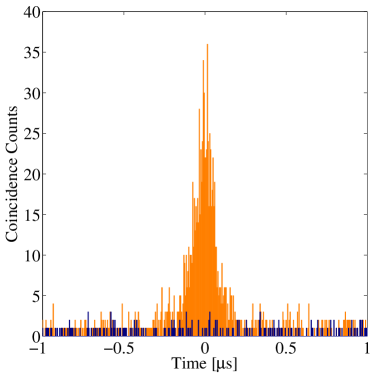
We first characterize the input heralded single photon by sending it through the memory crystal when only a transparency window is created (see blue histogram centered at zero time delay in Fig. 2(a)). The values of as a function of the pump power are plotted in Fig. 2(b). Despite the expected decrease for increased pump powers due to the production of multiple pairs Foertsch2012 , the values remain well above the classical limit of 2 (dotted line) for two-mode squeezed states.
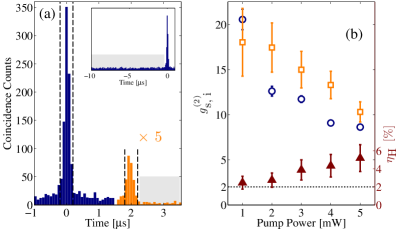
In order to unambiguously confirm the non-classical nature of the correlation, we also measure the marginal auto-correlation function for the signal and idler mode, and . We find, at pump power of , and , leading to strong violation of the Cauchy-Schwarz inequality in the form which proves non-classical correlations without any assumption on the created state (see Supplemental Material).
The detected coincidence rate (within ) is . From this value, we infer the generated coincidence rate at the output of the source cavity , where is the transmission from the input of the cryostat to the signal SPD, including the duty cycle of the memory (50 , see Supplemental Material). We can also evaluate the heralding efficiency in front of the cryostat, , whose values as a function of pump power are plotted in Fig. 2(b) (full triangles). Note that is mainly limited by and dark counts in the heralding SPD. Subtracting the contribution of the detector dark counts we find corrected heralding efficiencies almost constant, ( at the output of the source cavity), over the whole range of pump powers investigated. Finally, we estimate that more than of the heralded signal photons detected after the crystal are resonant with the atoms (see Supplemental Material) Wolfgramm2011 .
Once the non-classical nature of the input photons propagating through the transparency window is demonstrated, we prepare the AFC and reconstruct the function for the stored and retrieved photons. Figure 2(a) includes the coincidence histogram when an AFC is producing a collective re-emission at a delay of (orange trace). The values of for the AFC echo as a function of the pump power are reported in Fig. 2(b) (empty squares). The count rate in the region of the AFC echo is . We observe that the echoes exhibit values higher than the input photons. We attribute this unexpected effect to the fact that the AFC acts as a temporal filter McAuslan2012 for non-resonant noise arising from the SPDC source. Since the SPDC pump laser is turned off after the detection of an idler photon, the AFC delays the signal to a region free of broadband noise, thus increasing the . A more quantitative analysis of this effect is presented in the Supplemental Material. When the pump power decreases, the detection of the echo is limited by the detector dark counts. This gives rise to a saturation of the echo values which hides the filtering effect of the storage.
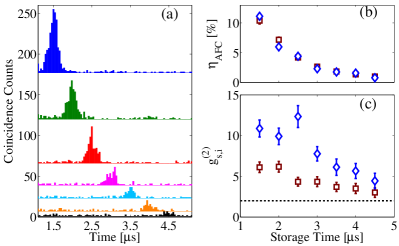
In view of applications in temporally multi-mode quantum memories with on-demand read-out, the pre-programmed delay must be tunable to allow the application of control pulses transferring the excitation to the spin states Gundogan2013 . Thus, we changed the spectral periodicity of the AFC to obtain increased delays. Figure 3(a) shows the coincidence histograms in the region of the AFC echo occurring at different predetermined storage times. The AFC storage efficiency, , is estimated by comparing the number of counts of the input propagating through the transparency window and the echo; it decreases for longer delays, as shown in Fig. 3(b), denoting a reduction of the comb finesse Riedmatten2008 . We note that the AFC efficiency with single photons does not decrease with respect to the storage of bright or weak coherent pulses of similar durations (the different cases together with a theoretical evaluation are compared in the Supplemental Material). This confirms that there is no significant frequency jitter for the single photons. We could reach AFC storage times of , while preserving non-classical correlations (see Fig. 3(c)). As we stop the production of pairs after the detection of a telecom photon, the region where the echo lies should not be affected by unconditional noise coming from the source (see Supplemental Material). Thus, despite the reduction in the AFC efficiency, the echo should exhibit constant values of for increasing storage times. As a matter of fact, the decrease in the values while increasing the storage time is less pronounced than the drop of the AFC efficiency (compare the diamonds in panels (b) and (c) of Fig. 3) and we attribute the reduction to the limitation given by the detector dark counts.
We also report the values of and measured without the filter cavity in the idler arm. The efficiencies in the two cases agree within the experimental error. On the contrary, despite the factor gain in the raw number of counts thanks to the reduced passive losses, the without filter cavity decreases due to the frequency multimodality of the source Fekete2013 . In fact, among the four modes coexisting in the main-cluster, only one is resonant with the AFC. The non-resonant modes in the idler arm join the start signals for the coincidence histogram without corresponding stops (the Pr3+ absorption acts as a filter for the non-resonant mode in the arm), thus decreasing the heralding efficiency and contributing to the noise increase. Note that frequency multiplexed quantum light storage could be obtained by creating several AFCs at different frequencies separated by the SPDC cavity FSR Sinclair2013 .
Our experiment could be extended to the storage of entangled qubits (e.g. entangled in energy-time Clausen2011 or in polarization with a suitable modification of the pair source). Alternatively, by doubling the setup, the demonstrated light matter quantum correlations would enable heralded entanglement between remote crystals Simon2007a . For the two cases, the visibility of the two-photon interference would be given by the measured of the stored and retrieved photons as (assuming uncorrelated background): ) Riedmatten2006 ; Laurat2007 . For the values of measured in this work, this would lead to visibilities between and . In addition, for the latter experiment, the demonstrated storage time would allow entanglement between crystals separated by km range distances.
In conclusion, we have demonstrated the reversible mapping of heralded single photons to collective optical atomic excitations in a praseodymium doped crystal. We observed an increase of non-classical correlations between signal and idler photons during the storage, thanks to a temporal filtering effect due to the AFC. Storage times up to while preserving quantum correlations were observed, more than 20 times longer than previous solid state experimental realizations. Furthermore, the transition used would readily allow the transfer of the excitation to the ground state to obtain long-lived spin-wave storage of quantum state of light, provided that the noise induced by the control beams can be sufficiently reduced.
We thank M. Afzelius and F. Bussières for interesting discussions. We acknowledge financial support by the European projects CHIST-ERA QScale and FP7-CIPRIS (MC ITN-287252), by the ERC Starting grant QuLIMA and by the Spanish MINECO OQISAM project (FIS2012-37569). MM acknowledges the Beatriu de Pinós program (2010BP B0014) for financial support.
Appendix A Supplemental Material
We report, in the present supplemental material, details about the experimental setup (Section I.), the characterization of the AFC storage with bright pulses and weak coherent states (Section II.), the second-order auto-correlation measurements of signal and idler photons (Section III.), and the second-order cross-correlation measurements between signal and idler as a function of the signal photons polarization (Section IV.).
Appendix B Setup
In the present section we provide additional details about the setup and the measurements.
The coherent light at is obtained using a periodically poled KTiOPO4 waveguide (AdVR, Inc.) by means of sum frequency generation of and light. The sources for these are amplified diode lasers (Toptica, DL 100 pro and TA PRO, respectively) Gundogan2013 . The pump beam for the SPDC source comes from a laser at (Toptica, TA SHG).
| Cavity | FSR (GHz) | |
|---|---|---|
| laser lock | ||
| SPDC | ||
| Filter cavity, | ||
| Etalon, |
Table 1 summarizes the characteristics of the cavities included in the setup. A Fabry-Perot cavity is used to lock the frequency of the laser with the Pound-Drevel-Hall technique. It is assembled in a home-made temperature stabilized vacuum chamber (). A bow-tie cavity surrounds the periodically poled lithium niobate crystal and enhances the SPDC process. The cavity in the idler arm at filters the redundant modes, while the etalon suppresses the secondary-clusters in the signal arm at (see Fig. 1 of the main text).
We also report the passive losses along the signal and idler optical paths with the purpose of estimating the effective performances of the photon-pair source starting from the detected count-rates.
| Element | T/ (signal) | T/ (idler) | |
|---|---|---|---|
| Dichroic Mirror | |||
| Glass Plate | |||
| Band Pass Filter | |||
| Etalon | , | ||
| Filter Cavity | |||
| Fiber | |||
| Other optical elements | |||
| Cryostat | |||
| Fiber | |||
| Memory duty cycle | |||
| SPD |
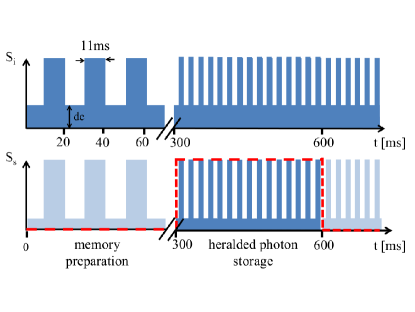
Table 2 summarizes the transmission of the single optical elements along the path of the signal and the idler photons at and , respectively. The total transmission of the signal (idler) photons from the SPDC cavity to the cryostat (SPD) is (). Figure 4 shows an illustration of the source and memory duty cycles. The former, , derives from the alternation of the SPDC cavity lock and the photon-pair production by means of mechanical choppers. We note that, during the locking period, the measured count rate is the detector dark count. The memory duty cycle, , is associated with the closure of the mechanical shutter placed after the Pr3+:Y2SiO5 crystal and aimed at protecting the SPD from the eventual leakage of the strong preparation beam into the echo mode. During the preparation time ( Gundogan2013 ) we also gate the SPD. While the source duty cycle is the same for the signal and idler photons, the memory duty cycle only affects the signal photons, thus altering the detected coincidence rate, . For this reason, the transmission of the photons from the cryostat to the signal detector, , also takes into account the memory duty cycle.
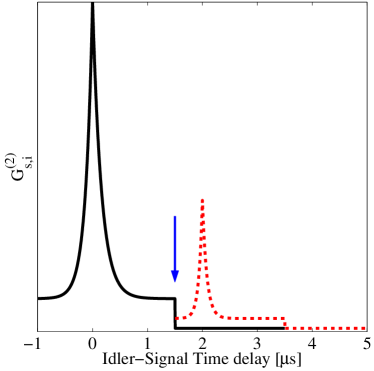
During the measurement time, we optimize the detection of the stored and retrieved photons by switching off the pump beam after the detection of an heralding photon. This interrupts the SPDC process and prevents the production of noise due to uncorrelated photons in the region of the coincidence histogram where the AFC echo is expected to occur. Figure 5 shows an illustration of the coincidence histograms for the input (solid curve) and the retrieved (dashed curve) photons, where the noise drop is emphasized by an arrow. The time delay between the idler photon detection and the pump turning off changes with the storage time, being modulated in order the noise drop to occur before the absorbed photons are re-emitted. This allows us to measure the noise affecting the echo in an appropriately large window. The pump beam remains off during .
Appendix C Memory characterization
Before the single photon storage experiments, we characterize our memory initially with bright pulses and then with weak coherent states obtained from a laser beam strongly attenuated with a set of neutral density filters. In both cases we use gaussian pulses with a duration comparable with the correlation time of the photon-pairs produced by the SPDC source, i.e. . The mean number of photons is evaluated from the raw number of counts detected by the SPD when the AFC is not prepared, back-propagated taking into account the detector efficiency, the coupling efficiency into the fiber, and the losses induced by the crystal when a transparency window is prepared (see Table 2).
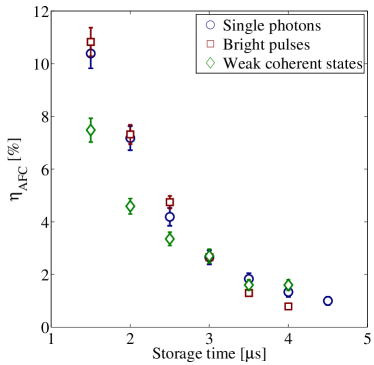
Fig. 6 reports the AFC echo efficiency obtained at increasing storage times for bright pulses (squares), weak coherent states (diamonds), and single photons (circles). The mean number of photons in the weak coherent pulses is fixed to , to be of the same order of magnitude as the heralding efficiency of the SPDC source. We stress that observing a constant AFC echo efficiency when moving from bright pulses, obtained from a stabilized laser beam, to single photons, implies the frequency jitter of the photon-pair source to be limited and the double locking system efficient.
In the framework of the theoretical model presented in ref. Afzelius2009 , the AFC echo efficiency can be expressed as
| (2) |
where is the finesse of the comb with being the peak width, is the effective optical depth experienced by the absorbed photons with being the optical depth of the peaks, and is the absorbing background. From the example of AFC shown in Fig. 1(b) of the main text, we extract the average peak width and separation, optical density and absorbing background (, , , and , respectively) and we predict for a storage time of , to be compared with the value of observed in the heralded single photon storage (see Fig. 6). The disagreement between the expected and the measured efficiency might be due to a not complete absorption of the photons due to the difference between the AFC total width and the photon bandwidth. It is worth noting, however, that the comb optical density might be underestimated due to the limited dynamic range of the detector. This could lead to the overestimation of the peak width and, consequently, of the theoretical AFC efficiency due to a suboptimal finesse. Note also that higher efficiencies could be reached by tailoring square AFC peaks Bonarota2010 .
Appendix D Second-order auto-correlation measurements
For a pair of independent classical fields, the Cauchy-Schwarz inequality must be fulfilled Kuzmich2003 :
| (3) |
where and are normalized second-order auto-correlation functions for signal and idler fields, respectively. The light emitted by spontaneous down conversion is usually well approximated by two-mode squeezed states, which exhibit thermal statistics for the signal and idler fields, i.e. Tapster1998 . Under the assumption of two-mode squeezed states, measuring is therefore sufficient to violate the Cauchy-Schwarz inequality and give strong evidence of non-classical correlations. However, in order to obtain a violation of Cauchy-Schwarz inequality without assumptions on the created state, it is required to measure directly and . We thus assembled a Hanbury Brown-Twiss set-up, inserting fiber beam-splitters after the cryostat in the arm (Thorlabs), when only a transparency window is created, and after the filter cavity in the arm (AFW Technologies). Additional SPDs are employed after the fiber beam-splitters for the detection of the and the photons (Count from Laser Components and id210 from ID Quantique, respectively).
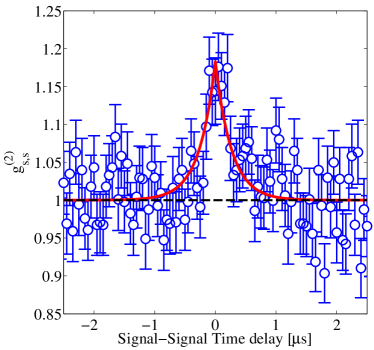
Figure 7 shows the intensity auto-correlation function of the signal photons at measured with a pump power of : it exhibits the clear fingerprint of bunching behavior in the fact that the peak maximum at zero delay exceeds unity by several standard deviations. The normalized second-order auto-correlation measured in a time window is . Figure 7 also reports the fit of the curve according to a symmetric exponential decay about zero delay, from which we extrapolate the decay time and the FWHM correlation time . Analogously, we find for the idler photons a value of . The non-classical nature of the photon correlation is therefore confirmed, at pump power of , by the violation of the Cauchy-Schwarz inequality in the form . We also measure and at a lower pump power, i.e. , leading to higher violation of the Cauchy-Schwarz inequality (see Table 3).
The measured values of and are significantly lower than the value of 2 expected for the thermal states produced by SPDC phenomena Tapster1998 . We describe here some additional measurements which, joined to a simple model for the noise characterization, provide an explanation of the disagreement between the experimental and the expected values.
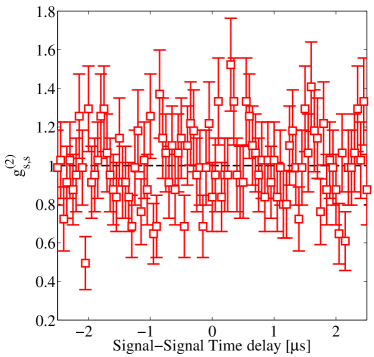
Exploiting the same Hanbury Brown-Twiss set-up, we perform auto-correlation measurements of the signal photons when travelling through the Pr3+:Y2SiO5 crystal without any spectral feature tailored. The inhomogneously broadened Pr3+ profile should act as a filter for the single photons, thus returning a flat coincidence histogram between the two arms of the fiber beam-splitter. However, it gives the measure of any kind of non-resonant, allegedly broadband, noise affecting the system Wolfgramm2011 .
The red squares in Fig. 8 display the measured second-order auto-correlation function of the photons transmitted by the crystal. We note that no evidence of photon bunching is present, thus ruling out any contribution from the secondary-clusters. In fact, they are separated from the main-cluster by a value ( Fekete2013 ) significantly higher than the inhomogeneous broadening of the Pr3+ optical transition at ( Gundogan2013 ). If they were not completely suppressed by the etalon in the signal arm, they would not be absorbed by the crystal and would reach the detector giving a bunching peak.
A quantitative comparison between the two measurements reported in Fig. 7 and Fig. 8 can provide hints about the noise contribution and thus help us to interpret the experimentally obtained value.
We define as the count-rate at the detector A when the transparency window is created. is the SPDC contribution and the background, inclusive of uncorrelated noise and detector dark counts. With the assumption that it is mainly non-resonant with the Pr3+ absorption, we extract the background from the count-rate at the same detector in the measurement where no transparency pit is tailored. Analogously, is the count-rate at the detector B.
At a time delay much greater than the correlation time, the number of coincidence counts is proportional to the product
| (4) |
while at zero delay it is proportional to due to the bunching behaviour of the SPDC photons (assuming thermal statistics). The proportion in both cases is given by the product of the window size and the integration time. The expected value of the intensity auto-correlation function is thus
| (5) |
For pump power, we measure background to signal ratios and . This leads to value of . This result suggests that the noise affecting our system is prevailingly non-resonant with the Pr3+ absorption.
The inferred refers to the ideal case of an infinitely small integration window about zero delay, thus it is not directly comparable to the experimental value , which is measured in a finite time window . To take this effect into account, we consider a symmetric exponential decay with decay time for the correlation function and find
| (6) |
where the factor of two takes into account the symmetric exponential. For the fitted , we find .
We also perform a similar analysis for a pump power of 2 mW. Table 3 summarizes the experimental and theoretical values for the different powers of the pump.
The interpretation of the value measured for the idler photons deserves a separated discussion. In fact, in this case the background contribution cannot be directly measured as for the signal photons. We note, however, that, due to the presence of the filter cavity in the idler mode and to much higher dark count rates for the SPDs, the background for the infrared photons is dominated by the dark counts of the detectors (400 Hz and 1200 Hz for the id220 and id210, respectively). Applying Eq. 5 to the idler photons, where and are evaluated from a dark count measurement, we calculate an expected value of for pump power, in reasonable agreement with the experimental .
Appendix E Linear dichroism measurements
To investigate the disagreement between the values for the input and the stored photons of the normalized second-order cross-correlation between signal and idler (see Fig. 2 of the main text), , we perform linear dichroism measurements with the heralded photons transmitted by the inhomogeneous line of the Pr3+:Y2SiO5 crystal. We collect the cross-correlation function between signal and idler for different polarizations of the signal photons without preparing either the AFC or the transparency window. From the coincidence histograms we calculate the values as a function of polarization, considering a time window of around the peak at zero delay. An example is given in the inset of Fig. 9 in the case of pump power.
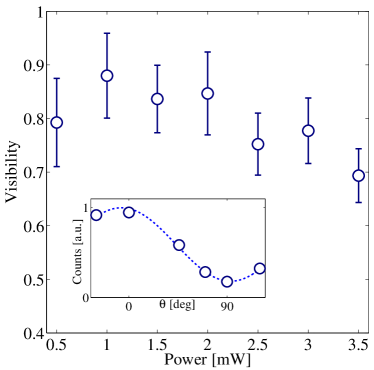
The main frame of Fig. 9 displays the visibility as a function of the pump power, extracted from the polarization dependence of the coincidences. For pump powers up to the conditioned visibility approaches and it decreases below when the pump power reaches . This is a further proof of the existence of a non-resonant noise, whose relative weight with respect of the resonant signal is increasing at higher pump powers. From the measured visibilities we can extract the probability to detect coincidences due to photons not resonant with the Pr3+ inhomogeneous absorption line, , with respect of that of detecting coincidences due to resonant ones, .
With the angle between the light polarization and the optical D1 axis of the Y2SiO5 crystal, we assume that the probability to detect a coincidence behaves as
| (7) |
where is the optical density of the Pr3+ absorption at that polarization. Taking into accout OD=1.4 measured in the weakly absorbing polarization (D1) and OD=6.9 for the polarization parallel to the D2 axis, we evaluate the non-resonant coincidences to be about of the resonant ones for visibilities varying between and , which is the case for pump powers up to . As soon as the visibility drops to values below , the non-resonant to resonant photons ratio exceeds .
The described approach enables quantifying the ratio of signal photons resonant with the Pr3+ absorption line with respect of the total photons produced, i.e. for pump powers up to and for higher pump powers. We note, however, that a comparison between the coincidence rates measured in a time window for the photons passing through the absorption profile and the transparency window (examples at are shown in Fig. 10), allows us to conclude that the majority of the photons resonant with the Pr3+ inhomogeneous line are also resonant with the transparency window where the AFC is tailored.
As a matter of fact, we find for the photons transmitted by the inhomogeneous line of Pr3+ a coincidence rate of , i.e. less than of the detected coincidence rate of the input photons (). In other words, more than of the heralded photons detected after the crystal are resonant with the transparency window. The non-resonant noise is expected to affect the values of the input but not those of the stored photons. In fact, the AFC comb selects only a portion of the input photons and returns it in a separated temporal mode, which does not include any uncorrelated noise due to the pump beam switching off after the detection of an idler photon (see Fig. 5).
We now describe a simple picture explaining how, even a small contribution of non-resonant noise, can significantly affect the values. We can write the normalized intensity cross-correlation in terms of resonant and non-resonant contributions to the coincidence probability as
| (8) |
where is the probability of having accidental coincidences due to resonant photons. Defining , Eq. 8 becomes
| (9) |
The ratio is the normalized second-order cross-correlation after the filtering of any non-resonant contribution. In a picture where the AFC storage returns an echo free of non-resonant photons, it is exactly the value of the echo. We thus apply the proposed model to predict the value of the input photons from that of the echo. The measured and predicted values are summarized in Table 4 for and pump power. The prediction of the model is in agreement with the measured values, which confirms that the AFC acts as a temporal filter for non resonant noise McAuslan2012 .
References
- (1) K. Hammerer, A. S. Sørensen, and E. S. Polzik, Rev. Mod. Phys. 82, 1041 (2010).
- (2) H.-J. Briegel, W. Dür, J. I. Cirac, and P. Zoller, Phys. Rev. Lett. 81, 5932 (1998).
- (3) N. Sangouard, C. Simon, H. de Riedmatten, and N. Gisin, Rev. Mod. Phys. 83, 33 (2011).
- (4) H. P. Specht , C. Nölleke, A. Reiserer, M. Uphoff, E. Figueroa, S. Ritter, and G. Rempe, Nature 473, 190 (2011).
- (5) T. Chanelière, D. N. Matsukevich, S. D. Jenkins, S.-Y. Lan, T. A. B. Kennedy, and A. Kuzmich, Nature 438, 833 (2005).
- (6) C. W. Chou, H. de Riedmatten, D. Felinto, S. V. Polyakov, S. J. van Enk, and H. J. Kimble, Nature 438, 828 (2005).
- (7) J. Simon, H. Tanji, J. K. Thompson, and V. Vuletic, Phys. Rev. Lett. 98, 183601 (2007).
- (8) A. G. Radnaev, Y. O. Dudin, R. Zhao, H. H. Jen, S. D. Jenkins, A. Kuzmich, and T. A. B. Kennedy, Nat. Phys. 6, 894 (2010).
- (9) H. Zhang, X.-M. Jin, J. Yang, H.-N. Dai, S.-J. Yang, T.-M. Zhao, J. Rui, Y. He, X. Jiang, F. Yang, G.-S. Pan, Z.-S. Yuan, Y. Deng, Z.-B. Chen, X.-H. Bao, S. Chen, B. Zhao, and J.-W. Pan, Nat. Photon. 5, 628 (2011).
- (10) B. Julsgaard, J. Sherson, J. I. Cirac, J. Fiurás̆ek, and E. S. Polzik, Nature 432, 482 (2004).
- (11) M. D. Eisaman, A. André, F. Massou, M. Fleischhauer, A. S. Zibrov, and M. D. Lukin, Nature 438, 837 (2005).
- (12) K. F. Reim, P. Michelberger, K. C. Lee, J. Nunn, N. K. Langford, and I. A. Walmsley, Phys. Rev. Lett. 107, 053603 (2011).
- (13) M. Hosseini, G. Campbell, B. M. Sparkes, P. K. Lam, and B. C. Buchler, Nat. Phys. 7, 794 (2011).
- (14) W. Tittel, M. Afzelius, T. Chanelière, R. L. Cone, R. L. S. Kröll, S. A. Moiseev, and M. Sellars, Laser Photon. Rev. 4, 244 (2010).
- (15) R. M. Macfarlane, J. Lumin. 100, 1 (2002).
- (16) M. P. Hedges, J. J. Longdell, Y. Li, and M. J. Sellars, Nature 465, 1052 (2010).
- (17) M. Sabooni, Q. Li, S. Kröll, L. Rippe, Phys. Rev. Lett. 110, 133604 (2013).
- (18) H. de Riedmatten, M. Afzelius, M. U. Staudt, C. Simon, and N. Gisin, Nature 456, 773 (2008).
- (19) M. Afzelius, C. Simon, H. de Riedmatten, and N. Gisin, Phys. Rev. A 79, 052329 (2009).
- (20) I. Usmani, M. Afzelius, H. de Riedmatten, and N. Gisin, Nature Comms. 1, 12 (2010).
- (21) M. Bonarota, J.-L. Le Gouët, and T. Chanelière, New J. Phys. 13, 013013 (2011).
- (22) M. Afzelius, I. Usmani, A. Amari, B. Lauritzen, A. Walther, C. Simon, N. Sangouard, J. Minár̆, H. de Riedmatten, N. Gisin, and S. Kröll, Phys. Rev. Lett. 104, 040503 (2010).
- (23) M. Gündoğan, M. Mazzera, P. M. Ledingham, M. Cristiani, and H. de Riedmatten, New. J. Phys. 15, 045012 (2013).
- (24) N. Sinclair, E. Saglamyurek, H. Mallahzadeh, J. A. Slater, M. George, R. Ricken, M. P. Hedges, D. Oblak, C. Simon, W. Sohler, and W. Tittel, arXiv:1309.3202.
- (25) M. Sabooni, F. Beaudoin, A. Walther, N. Lin, A. Amari, M. Huang, and S. Kröll, Phys. Rev. Lett. 105, 060501 (2010).
- (26) T. Chanelière, J. Ruggiero, M. Bonarota, M. Afzelius, and J.-L. Le Gouët, New. J. Phys. 12, 023025 (2010).
- (27) M. Gündoğan, P. M. Ledingham, A. Almasi, M. Cristiani, and H. de Riedmatten, Phys. Rev. Lett. 108, 190504 (2012).
- (28) Z.-Q. Zhou, W.-B. Lin, M. Yang, C.-F. Li, and G.-C. Guo, Phys. Rev. Lett. 108, 190505 (2012).
- (29) N. Timoney, I. Usmani, P. Jobez, M. Afzelius, and N. Gisin, Phys. Rev. A 88, 022324 (2013).
- (30) C. Clausen, I. Usmani, F. Bussières, N. Sangouard, M. Afzelius, H. de Riedmatten, and N. Gisin, Nature 469, 508 (2011).
- (31) E. Saglamyurek, N. Sinclair, J. Jin, J. A. Slater, D. Oblak, F. Bussières, M. George, R. Ricken, W. Sohler, and W. Tittel, Nature 469, 512 (2011).
- (32) I. Usmani, C. Clausen, F. Bussières, N. Sangouard, M. Afzelius, and N. Gisin, Nature Photon. 6, 234 (2012).
- (33) C. Clausen, F. Bussières, M. Afzelius, and N. Gisin, Phys. Rev. Lett. 108, 190503 (2012).
- (34) E. Saglamyurek, N. Sinclair, J. Jin, J. A. Slater, D. Oblak, F. Bussières, M. George, R. Ricken, W. Sohler, and W. Tittel, Phys. Rev. Lett. 108, 083602 (2012).
- (35) G. Heinze, C. Hubrich, and T. Halfmann, Phys. Rev. Lett. 111, 033601 (2013).
- (36) J. Fekete, D. Rieländer, M. Cristiani, and H. de Riedmatten, Phys. Rev. Lett. 110, 220502 (2013).
- (37) C. Simon, H. de Riedmatten, M. Afzelius, N. Sangouard, H. Zbinden, and N. Gisin, Phys. Rev. Lett. 98, 190503 (2007).
- (38) M. Nilsson, L. Rippe, S. Kröll, R. Klieber, and D. Suter, Phys. Rev. B 70, 214116 (2004).
- (39) M. Förtsch, J. Fürst, C. Wittmann, D. Strekalov, A. Aiello, M. V. Chekhova, C. Silberhorn, G. Leuchs, and C. Marquardt, Nature Comms. 4, 1818 (2013).
- (40) F. Wolfgramm, Y. A. de Icaza Astiz, F. A. Beduini, A. Cerè, and M. W. Mitchell, Phys. Rev. Lett. 106, 053602 (2011).
- (41) D. L. McAuslan, L. R. Taylor, and J. J. Longdell, Appl. Phys. Lett. 101, 191112 (2012).
- (42) H. de Riedmatten, J. Laurat, C. W. Chou, E. W. Schomburg, D. Felinto, and H. J. Kimble, Phys. Rev. Lett. 97, 113603 (2006)
- (43) J. Laurat, K. S. Choi, H. Deng, C. W. Chou, and H. J. Kimble, Phys. Rev. Lett. 99, 180504 (2007).
- (44) M. Bonarota, J. Ruggiero, J.-L. Le Gouët, and T. Chaneliére, Phys. Rev. A 81, 033803 (2010).
- (45) A. Kuzmich, W. P. Bowen, A. D. Boozer, A. Boca, C. W. Chou, L.-M. Duan, and H. J. Kimble, Nature 423, 731 (2003).
- (46) P. R. Tapster and J. G. Rarity, J. Mod. Opt. 45, 595 (1998).