Observation of Markarian 421 in TeV gamma rays over a 14-year time span
Abstract
The variability of the blazar Markarian 421 in TeV gamma rays over a 14-year time period has been explored with the Whipple 10 m telescope. It is shown that the dynamic range of its flux variations is large and similar to that in X-rays. A correlation between the X-ray and TeV energy bands is observed during some bright flares and when the complete data sets are binned on long timescales. The main database consists of 878.4 hours of observation with the Whipple telescope, spread over 783 nights. The peak energy response of the telescope was 400 GeV with 20% uncertainty. This is the largest database of any TeV-emitting active galactic nucleus (AGN) and hence was used to explore the variability profile of Markarian 421. The time-averaged flux from Markarian 421 over this period was Crab flux units. The flux exceeded 10 Crab flux units on three separate occasions. For the 2000–2001 season the average flux reached 1.86 Crab units, while in the 1996–1997 season the average flux was only 0.23 Crab units.
keywords:
AGN , TeV gamma rays , Markarian 4211 Introduction
Blazars are the most powerful active galactic nuclei (AGN) observed and are remarkable for their variability. Their most prominent characteristic is the relativistic jets which are aligned with the line of sight to the observer. In this preferred direction the blazar can be very bright. Although they are detectable over a wide range of frequencies, their alignment does not permit spatial resolution and makes the detection of optical spectral lines very difficult. Their broadband emission is clearly nonthermal and the nature of the progenitor particles (electrons or protons) is uncertain. In principle, there is much observational evidence which should make their understanding straightforward, but in practice there is a wealth of often contradictory observations which demonstrate that the underlying mechanisms are complex and often ambiguous. While their variability makes these AGN inherently interesting, observations (preferably simultaneous) over a long time interval at a variety of wavelengths are required to draw any firm conclusions.
The spectral energy distribution (SED) of blazars is generally represented by a double-peaked structure, with the lower-energy peak modeled by a synchrotron emission mechanism in which the synchrotron photons arise from electrons in the relativistic beam; the Compton scattering of these electrons on the low-energy photons (which may be either of synchrotron origin or external from some other mechanism) results in high-energy gamma-ray emission [1]. Generally, the former simple model (i.e., self-Compton) is preferred, but some sources appear to require external photons [2]. In another class of model, hadronic interactions are invoked to explain the higher-energy peak [3].
Markarian 421 (Mrk421) was one of 70 AGN reported in the Third EGRET Catalog of 100 MeV sources [4, 5]. It was remarkable in that it was both the weakest and the closest (redshift ) of these AGN. Its variability was not particularly noteworthy in the discovery gamma-ray observation. Subsequently it was determined that, unlike the other AGN in the EGRET catalog, it should be classified as a HBL (high-frequency-peaked BL Lacertae object) in which the synchrotron and Compton peaks in its spectral energy distribution were displaced some decades to higher frequency relative to the norm of EGRET-detected AGN. This made it a prime candidate for TeV emission. It was on a short list of EGRET-detected AGN selected for observation at TeV energies with the Whipple 10 m telescope [6]. It was the only one on the list which gave evidence of a signal, and the subsequent paper [7] announced the first unambiguous detection of an extragalactic source at TeV energies.
Since that time, Mrk421 has been observed every season at the Whipple Observatory. Although more than 50 AGN have now been detected at TeV energies [8], Mrk421 is still, on average, the strongest AGN source of TeV gamma rays in the northern hemisphere. Because of its proximity and high degree of variability, it was considered a good candidate for the detailed study of an AGN that was a TeV gamma-ray emitter. During the large flare in 2001, it was observed to reach a peak emission of 13 times the level of the Crab Nebula (the brightest known steady TeV source) over a four-minute integration time and to show other rapid variations [9].
Atmospheric Cherenkov telescopes are particularly useful for the study of HBLs such as Mrk421 because of their high sensitivity to rapid variations. The Whipple telescope has detected flux variability with doubling times as short as 15 minutes [10]; there is some correlation between emission at X-ray keV energies and gamma-ray TeV energies [11, 12]. Rapid variations in TeV emission have also been observed in other AGN [13, 14]. It has been shown that the energy spectrum of Mrk421 hardens with increasing intensity [9].
In this paper, we summarize intensive observations of Mrk421 with a single gamma-ray telescope over a long period. The principal telescope used in this study, the 10 m reflector and imaging camera at the Whipple Observatory, is described in Section 2. Section 3 describes the database of TeV observations taken over the 14-year epoch. Correlations with simultaneous X-ray observations are presented in Section 4. The level of variability in the TeV signal is explored in Section 5. Section 6 explores those intervals in which the TeV signal was particularly strong and the source may be said to have been flaring.
2 Whipple Observations.
The principal data reported here were taken at TeV energies with the Whipple 10 m atmospheric Cherenkov telescope and imaging camera over a 14-year period (December 1995 – May 2009). Although observations were made both before and after this period, this time interval was chosen as it represents the best period of uniform operation and performance of the telescope.
The Whipple photomultiplier (PMT) camera evolved during this time [15]. From 2001 to 2009, the camera consisted of a hexagonal array of 379 PMTs of diameter 1.2 cm, giving a total field of view of . Winston light cones in front of the PMTs minimized the light loss and gave a relatively uniform sensitivity across the face of the camera. The camera was triggered when the light level in at least three tubes exceeded a preset threshold. Before 2001, the camera had PMTs of 2.5 cm diameter and had a larger field of view.
The Whipple observations were supplemented by observations with the VERITAS (Very Energetic Radiation Imaging Telescope Array System) observatory, located at the basecamp of the Fred Lawrence Whipple Observatory in southern Arizona, USA; this was completed in June 2007. The observatory consists of four 12m-diameter imaging atmospheric Cherenkov telescopes, with a typical baseline between telescopes of 100 m [16]. Each telescope has a 499-PMT camera, spanning a field of view of .
The Whipple telescope observations were taken in intervals of 28 sidereal minutes during which the telescope was directed at the source. This constituted an ON run. In order to estimate the background, the ON run was sometimes followed (or preceded) by an OFF run during which the telescope tracked a point 30 minutes later (earlier) in right ascension but at the same declination, so that telescope traced out the same path in azimuth and elevation as the ON run. Often no OFF runs were taken, so that the source was tracked continuously (TRACKING mode) and the background determined from the known image parameter distributions in the absence of a source.
Observations were taken on clear moonless nights. For much of this time, Mrk421 was the prime target, and it was observed whenever it was at an elevation greater than . Where possible, one or two ON/OFF pairs were also taken on the Crab Nebula each night for calibration purposes. The rest of the darktime was used to observe other candidate sources (mostly AGN) or gamma-ray bursts.
The Cherenkov images of air showers recorded with the telescope were characterized by the moments of the angular distribution of light as determined by the output of the PMTs. The division of the data into candidate gamma-ray images and background images was made on the basis of selection criteria optimized by Monte Carlo simulations of gamma-ray and hadron shower images and checked (and again optimized) on known sources such as the Crab Nebula [17]. On-line analysis was performed at the conclusion of each data run so that the state of the source was known promptly and the observing program adjusted if necessary. Only data taken on clear nights (judged by fluctuations in the background trigger rate and by the observers’ comments) were used in the final database.
At the beginning of each observing season, the trigger threshold was raised or lowered, if required, to compensate for changes in the telescope and in the camera; these changes included replacement of PMTs, recoating of mirrors, upgrades to trigger electronics, optimisation of mirror-facet alignments, and improvements in telescope pointing corrections. The adjustment to the trigger level from one season to the next was never more than %, and the threshold was always maintained well above the noise trigger level.
In order to analyze all the Mrk421 data in a uniform manner, the average Crab Nebula flux for each observing season was used for calibration. Although the MeV-GeV flux from the Crab Nebula has recently been shown to exhibit short-term flares [20, 21, 22], they are infrequent (2 per year) and their duty cycle is short (10 days); a search of the Whipple database [23] did not show any evidence for such flares over a ten-year epoch. Long-term secular variations such as those seen in X-ray experiments [24] have not been seen at TeV gamma-ray energies, so that the Crab Nebula can still be regarded as a standard candle in this energy regime.
On-source observations of Mrk421 (ON runs and TRACKING runs) were chosen and selection criteria as described above applied to identify gamma-ray candidate events. Estimation of the background was based on the distribution of the angle between the major axis of the event image and the line from camera centre to image centroid. The region was taken as the signal region and the region as control region. The background in the signal region was estimated by multiplying the number of events in the control region by a “tracking ratio”. The tracking ratio for each season was determined from a set of “darkfield” runs (i.e., observing runs with no known source in the field of view) as the number of size- and shape-selected events in the signal region divided by the corresponding number of events in the control region [18]. Usually the OFF runs from ON/OFF observations of Mrk421 were used as darkfield runs, but where these were insufficient they were supplemented by OFF data on other sources. For an on-source run of duration , the gamma-ray rate was then found as , where and are the number of size- and shape-selected events in the signal and control regions, respectively. The error on the rate was calculated as , where is the error on the tracking ratio (typically 1–3%). The significance of the detection was taken as ; this formulation was used in preference to that of Li & Ma [19] in order to take account of the error on the tracking ratio.
Since gamma-ray observations could only be taken with the Whipple 10 m telescope on moonless nights, there were about eight nights around the time of full moon of each lunar cycle when no gamma-ray observations could be made. The periods (21 days each) during which the gamma-ray data were taken are referred to as “darkruns”. Typically, each observing season for Mrk421 at the Whipple Observatory spans between 6 and 8 darkruns, from November–December to May–June.
3 Gamma-ray Database
The gamma-ray data for Mrk421 between December 1995 and May 2009, in runs of (generally) 28-minute duration, comprise the database for this work; in all cases, the measured flux is given in Crab units based on the Crab signal recorded that season. These Mrk421 runs were combined (weighted average) to give the mean flux over larger time intervals: nightly (individual nights of 1–6 hour duration), monthly (entire dark runs) and yearly. The peak energy response of the telescope during these observations was 400 GeV with a 20% uncertainty.
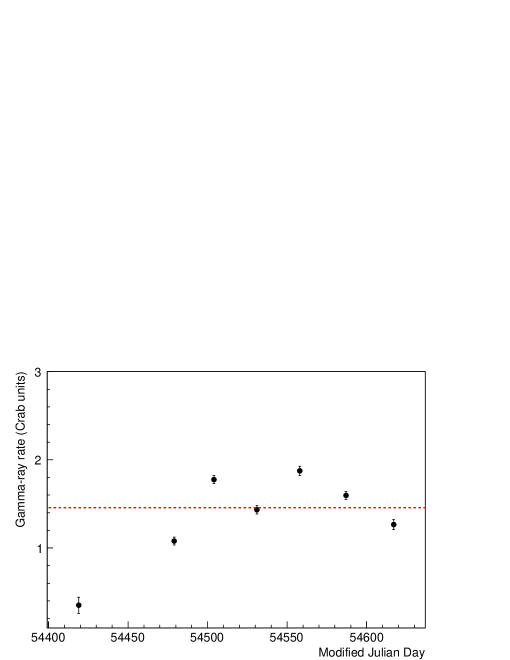
In this work, the assumption is made that the Crab Nebula flux at TeV energies is constant over the season. The typical nightly rate from the Crab Nebula as measured by the Whipple telescope for one season is shown in Figure 1. Although the energy spectrum of Mrk421 has been observed to harden when the flux level is high [9], the spectral shape in the energy range 400 GeV to 4 TeV is typically similar to that of the Crab Nebula, so that for most nights (when Mrk421 is not flaring strongly) the rates expressed in Crab units are insensitive to small changes in peak energy response. Some results from this data set have been published previously [25, 26, 27, 11, 12]. Several of these reports were motivated by the observation of exceptional activity (May 1996 [10]; February 2001 [11]; May 2008 [28]) and the reports included light curves on short timescales and spectral analysis. These flares are discussed in Section 6.
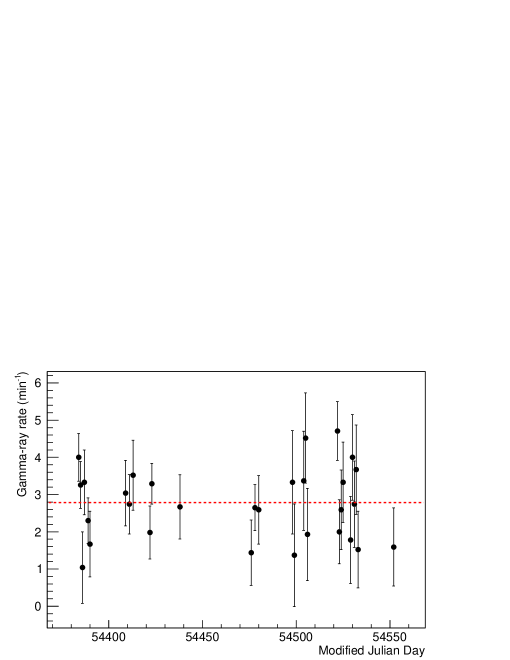
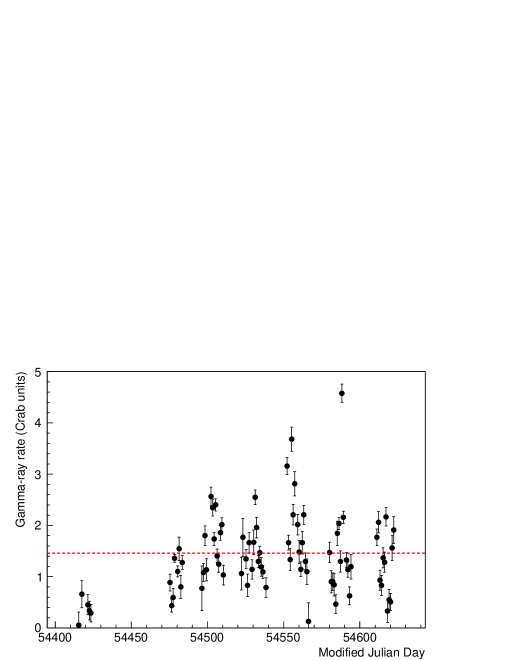
The Mrk421 observations reported here represent a total exposure time of 878.4 hours over 14 years. The nightly gamma-ray rate from Mrk421 for the typical 2007–2008 observing season, expressed in Crab units, is shown in Figure 2; the horizontal line indicates the average rate for this season. Mrk421 varies on many time scales.
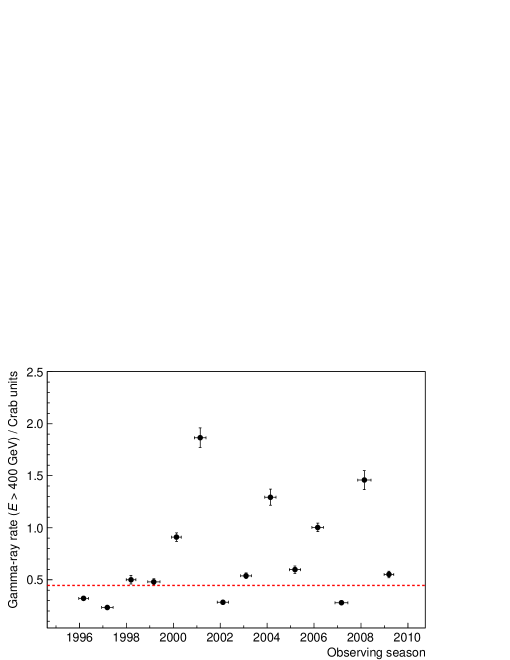
The mean gamma-ray rate from Mrk421 was calculated for each observing season; the results are given in Table 1 and plotted in Figure 3. The table includes the ON-source observing time (all the time in which the telescope was pointing at Mrk421) and the statistical significance of the detection for each season. For the hypothesis that the annual rate is a constant, equal to the overall mean rate for the complete 14-year data set, the value is 1022 for 13 degrees of freedom, corresponding to a chance probability of . During some observing seasons Mrk421 was the brightest TeV source in the sky, whereas in others it was barely detectable with the Whipple telescope.
| Season | Exposure | Significance | Mean gamma-ray rate |
|---|---|---|---|
| (hours) | (standard deviation) | (Crab units) | |
| 1995-1996 | 51.8 | 36 | 0.32 0.02 |
| 1996-1997 | 53.2 | 25 | 0.23 0.02 |
| 1997-1998 | 52.1 | 24 | 0.50 0.04 |
| 1998-1999 | 45.2 | 23 | 0.48 0.03 |
| 1999-2000 | 38.7 | 36 | 0.91 0.04 |
| 2000-2001 | 78.1 | 88 | 1.86 0.09 |
| 2001-2002 | 32.9 | 14 | 0.28 0.02 |
| 2002-2003 | 45.0 | 35 | 0.54 0.03 |
| 2003-2004 | 51.8 | 82 | 1.29 0.08 |
| 2004-2005 | 23.0 | 25 | 0.60 0.04 |
| 2005-2006 | 75.1 | 88 | 1.00 0.04 |
| 2006-2007 | 52.0 | 18 | 0.28 0.02 |
| 2007-2008 | 148.9 | 84 | 1.46 0.09 |
| 2008-2009 | 130.6 | 39 | 0.55 0.03 |
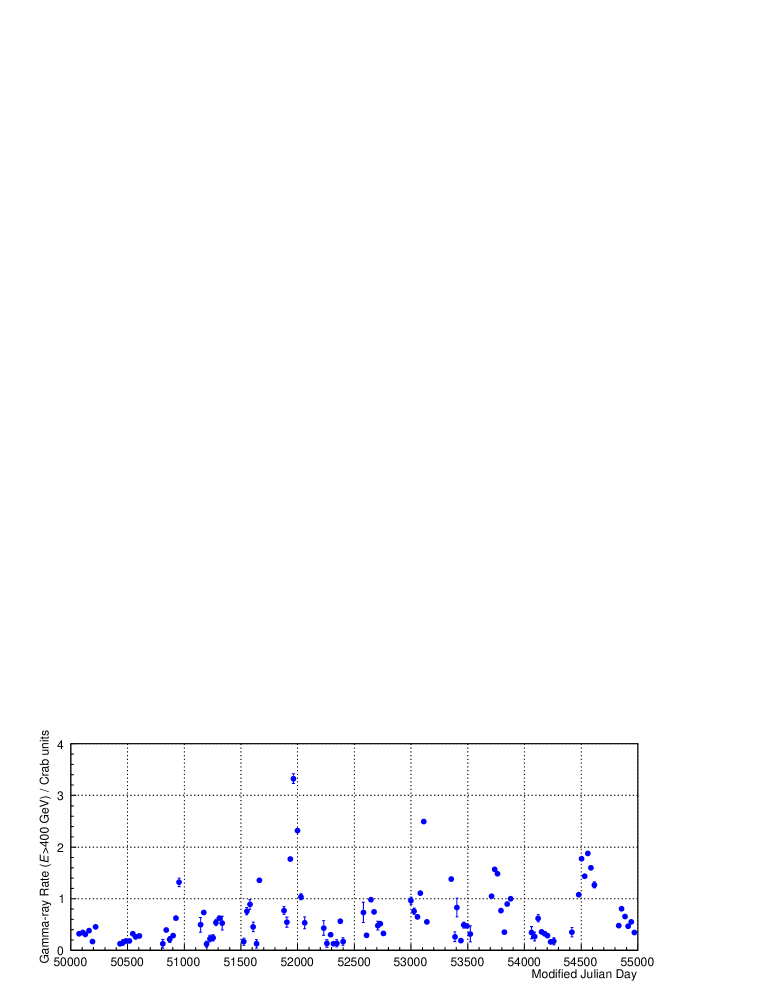
Figure 4 (bottom) shows the gamma-ray rate averaged over each darkrun (monthly) for the 14 years of data. With this unique dataset, it is possible to look for long-term temporal changes in flux levels, slow periodicities and correlation with experiments at other wavelengths with long time constants.
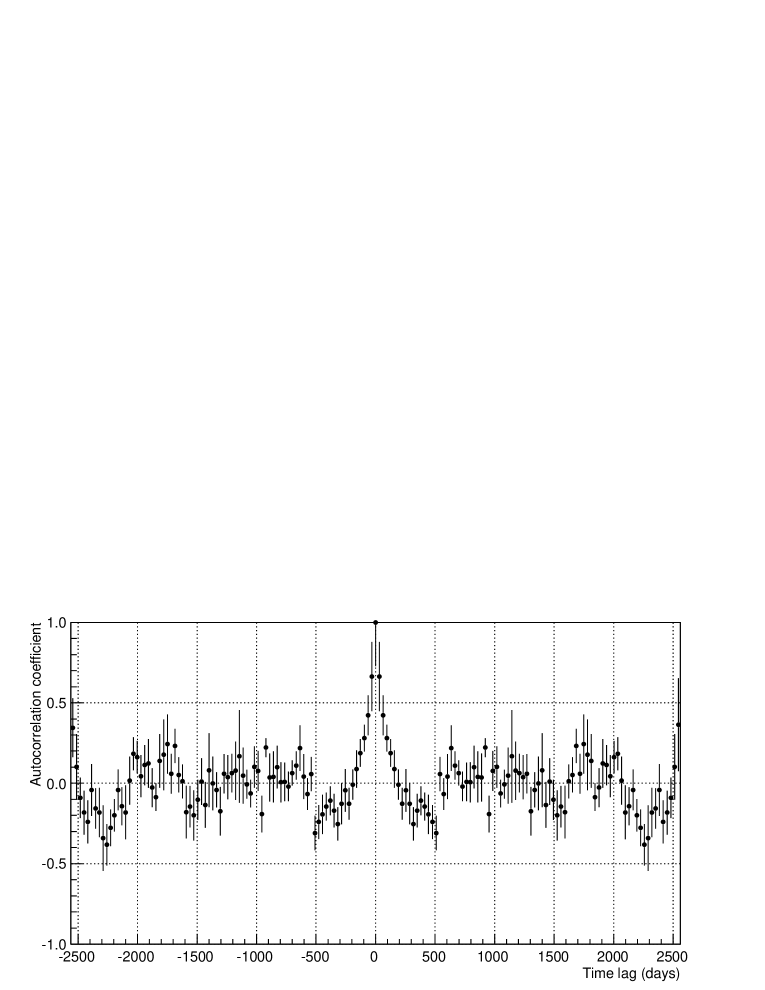
The discrete autocorrelation function (DACF) allows the study of the level of autocorrelation in unevenly sampled datasets [29, 30] without any interpolation or addition of artificial data points. It can reveal the presence of periodicity (intrinsic or spurious) in the time series. The DACF for the gamma-ray dataset for Mrk421 is plotted in Figure 5; it shows no evidence for periodicity at any period between 2 months and 7 years.
4 Correlations
We correlated these Whipple 10 m observations with archival data taken at other wavelengths for part or all of the epoch 1995–2009. The most complete overlap was with the Rossi X-ray Timing Explorer (RXTE) database for the entire 14 years [31, 32]. There was also significant overlap with Milagro [33]. There was partial overlap with observations by Fermi-LAT [34] and with data from three radio AGN monitoring programs (Metsähovi Radio Observatory [35], the University of Michigan Radio Observatory [36], and MOJAVE [37]). The correlation with the X-ray data from RXTE will be considered here; the correlation with Milagro, Fermi-LAT and the radio programs will be the subject of a separate publication.
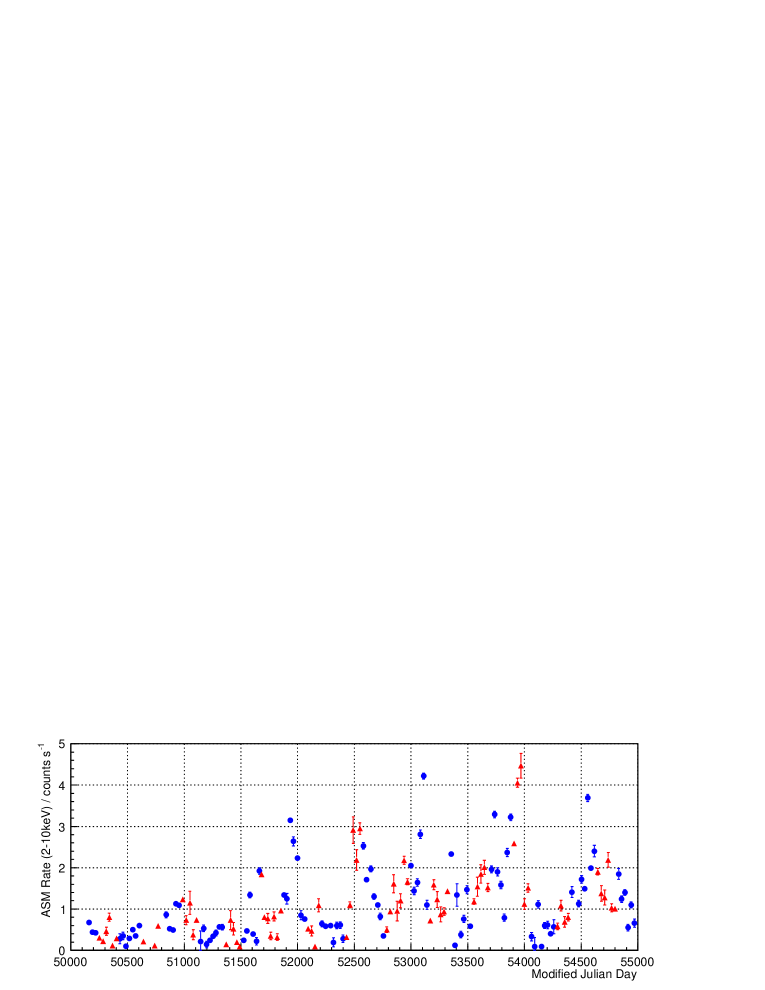
RXTE has three non-imaging X-ray detectors, one of which is the All-Sky Monitor (ASM); it was launched in December 1995 and was operational for the period of the Whipple 10 m monitoring program described here. The ASM scanned nearly 80% of the sky in each orbit and was sensitive to X-rays of energy 2–10 keV. Systematic uncertainties in the ASM rate were large, but relative flux estimates were available for month-scale monitoring.
In the ASM database [38], each data point represents the one-day average of the fitted source fluxes from a number (typically 5–10) of individual ASM dwells (90 seconds each). The selection criteria for the observations are described in [38]. The data are quoted as nominal 2–10 keV rates in ASM counts per second, where the Crab Nebula rate is about 75 counts per second. The daily rates were combined (weighted average) in 21-day intervals to reduce statistical errors.
The gamma-ray rates for the 1995–2009 Mrk421 Whipple observations were compared with the X-ray flux from the ASM. The light curves for the X-ray and gamma-ray data on Mrk421 from December 1995 to May 2009 are plotted in Figure 4 (top and bottom, respectively). The data are plotted for the Whipple 10 m darkrun periods ( for each season) in which both X-ray and gamma-ray data were taken, i.e., the X-ray data were averaged for each period in which Whipple gamma-ray data were available (usually 21-day periods).
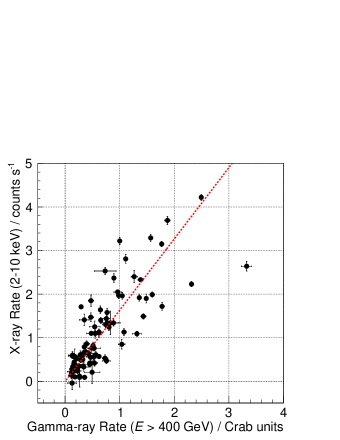
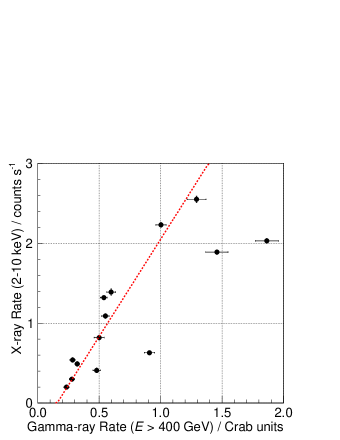
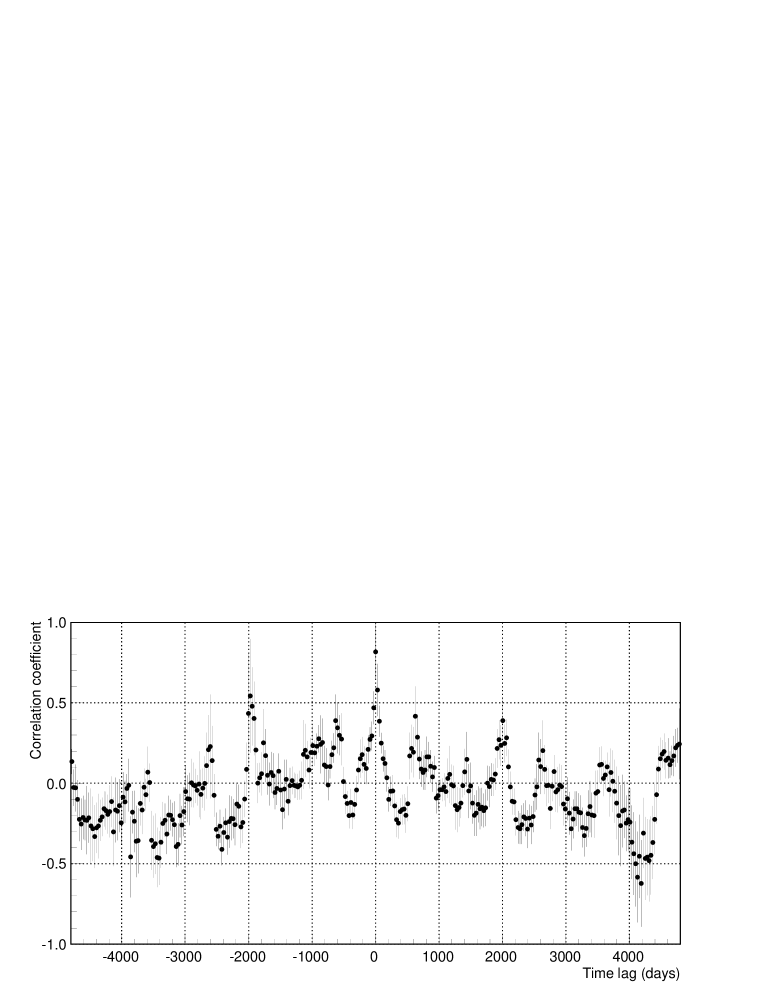
The RXTE ASM data (1995–2009) show evidence for emission correlated with the gamma-ray data on monthly and yearly timescales, as shown in Figure 6. In previous papers [11, 12, 39], the correlation on short timescales was treated in detail. Here, we concentrate on the longer timescales which are uniquely available in our large database. The correlation coefficients are and for the monthly- and yearly-binned data, respectively. There is general agreement between these values and those obtained in previous studies of parts of this database [11, 12]. The strong correlation suggests that the X-rays and gamma rays are emitted by the same population of electrons in the same region of the jet. During one flaring episode, a ks time lag of the TeV flare with respect to the 2–4 keV X-ray band was observed [11]. For the 14-year data set, the discrete correlation function (DCF) between the gamma-ray and X-ray monthly-averaged fluxes for time lags (gamma ray relative to X-ray) between and days is shown in Figure 7. The TeV and keV fluxes are seen to be significantly correlated (with a DCF value of 0.82) for a time shift shorter than 30 days; the maximum of the DCF is centered at a lag of () days.
5 Variability
Mrk421 is the brightest AGN at TeV energies (on average) and was the first such AGN to be discovered at TeV energies. Mrk421 is thus the ideal candidate for the detailed study of the variability of this type of object, with the caveat that it may have a greater degree of variability than the norm for such objects on all timescales. It is remarkable also in being the closest TeV-emitting AGN. It is certainly the most studied of the known TeV blazars. Most of the variations seen in Mrk421 on the various timescales have been seen also in other AGN, but the statistics are sparse. It is probably the youngest such AGN. Because it is so close, it has the lowest spectral distortion due to absorption by pair production with the extragalactic background light.
It is difficult to compile a large data sample from a variety of observatories, because observing modes may be quite different and the relative sensitivity of the experiments is often not well-defined. The Whipple 10 m database is comparatively uniform and covers a long time interval; during the period 1995–2009, the system was operated in a relatively stable configuration of telescope and camera [15]. It is thus useful to use this database to investigate the statistical distribution of the time variability of Mrk421 and, by inference, that of other AGN. If Mrk421 is typical of all (or a subclass of) TeV AGN, then we can use these distributions to predict how often a more distant AGN might flare or be above a certain level of brightness. Four different timescales are considered: yearly, monthly, daily and run-by-run (half-hourly).
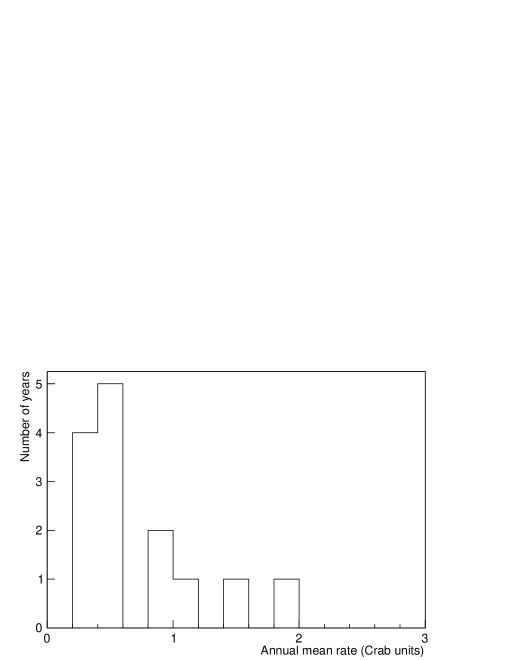
Yearly variations: As seen in Figure 8, there are significant variations on a yearly timescale, with mean annual rates ranging from 0.23 Crab units to 1.86 Crab units. Mrk421 was brighter than any other TeV source in the sky during most of the 2007–2008 observing season (see Figure 2); this was also the case for the 2000–2001 season.
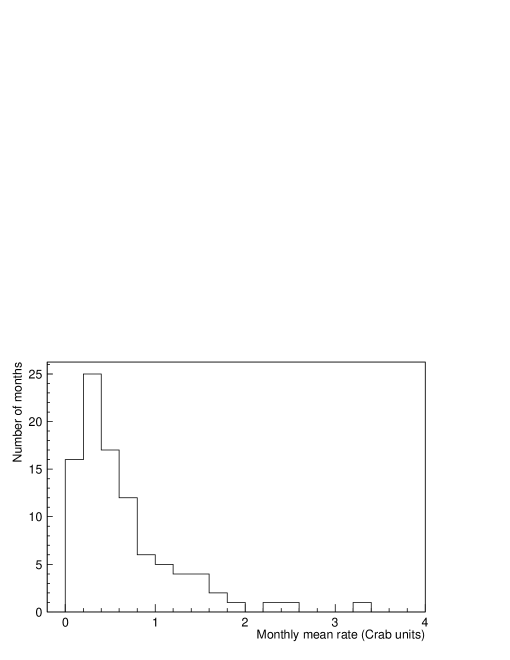
Monthly variations (Figure 9): There are clearly large variations on this timescale over the full 14 years of data. There were 19 months (out of a total of 95 months) in which the average rate was at least 1 Crab unit.
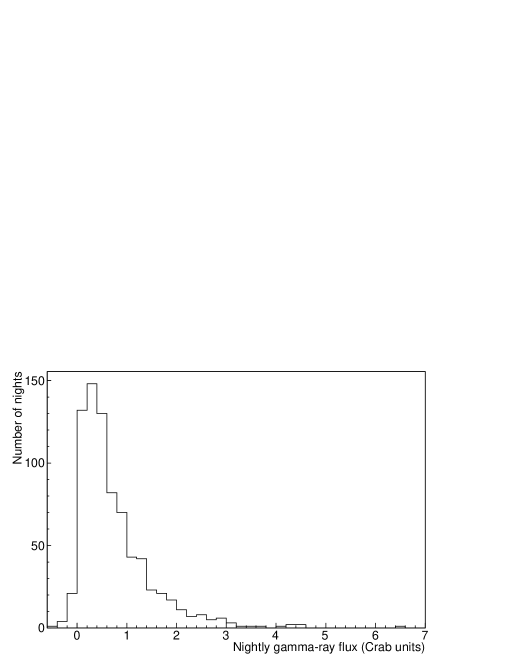
Nightly variations: The distribution of the average rate for each of the 783 nights of observation is shown in Figure 10. The duration of the observations on which the average is based varied from night to night as observing priorities, weather, etc., changed. There were 49 nights (out of a total of 783 nights, 6.3%) for which the average rate was at least 2 Crab units.
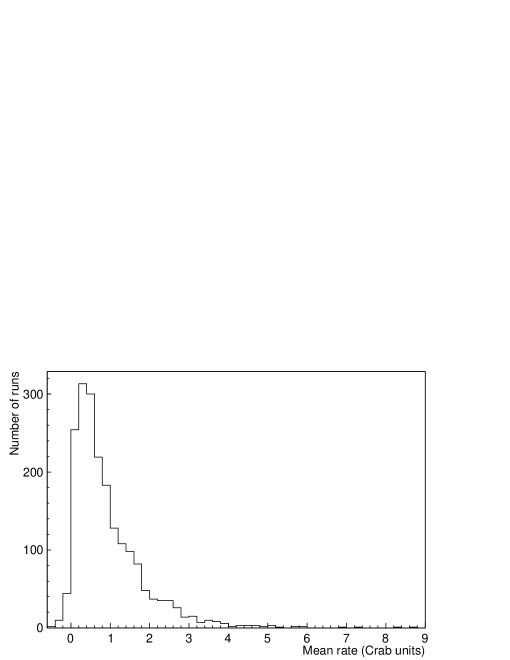
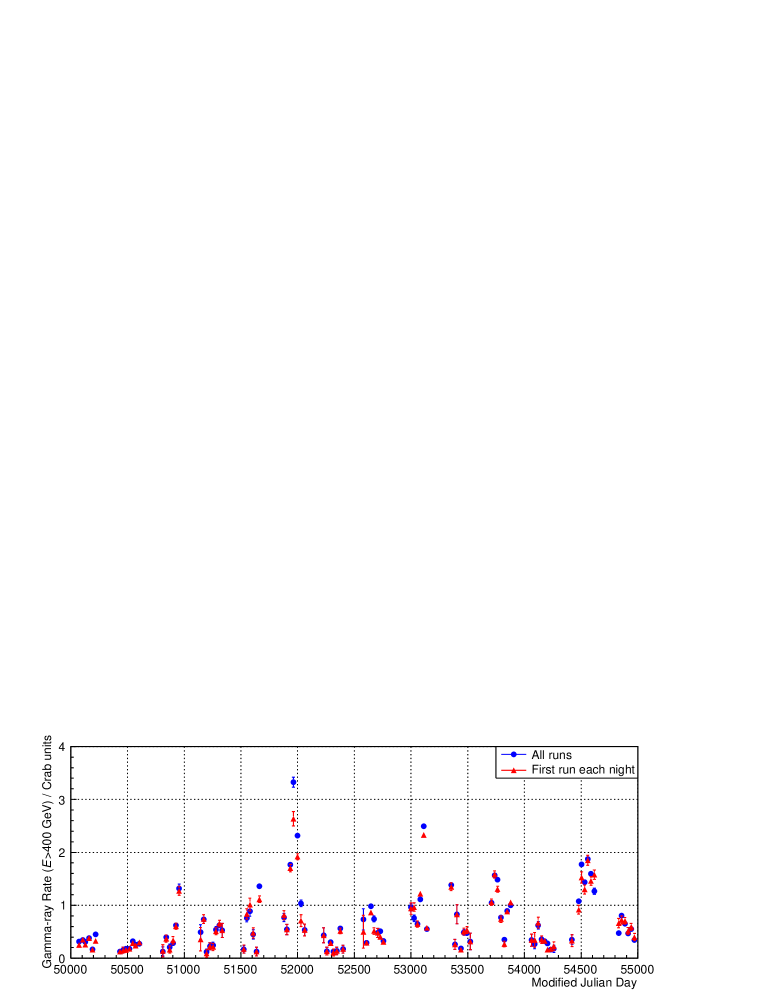
Run variations: Observing runs were generally of 28-minute duration. The distribution of the run-by-run rates is shown in Figure 11. This distribution is not a completely unbiased sample, since for a subset of the data there was a tendency for the observers to continue observations when the initial observed signal was high. There is therefore some bias towards including observations when Mrk421 was in a high state (there is no bias against runs where the signal was low, as all observations were included in the analysis irrespective of the apparent flux level). However, when only the first run in each night is considered, this bias was not found to be strong, as can be seen in Figure 12 which shows the flux using all the data satisfying weather, hardware and elevation criteria and a smaller set of data where the fluxes are based on only the first run of each night. In later years, this bias was largely removed as observations were concentrated on just Mrk421. 34% of the runs, taken at random, show Mrk421 to be at an emission level of Crab unit, and 3.5% of the runs have levels above 3 Crab units. The highest fluxes ( Crab units) were observed in sub-run intervals of 2–5 minutes (see next section).
If Mrk421 is typical (which is probably not the case), these distributions could be used to predict the expected level of variation in other TeV-emitting AGN, scaling by the ratio of their average TeV gamma-ray intensity to that of Mrk421 (e.g., for a TeV-emitting AGN one-third as bright as Mrk421 on average, 3.5% of the runs taken on it might be expected to exhibit flaring above the 1 Crab level).
6 Large Flares
Mrk421 is characterized by significant flux variations on timescales of a few minutes to years and perhaps longer. During the 14 years of monitoring reported here, there were three instances in which the variations were sufficiently strong that they were regarded as “flares” and were so reported in subsequent publications [10, 11, 39]. Although the timescales were quite different, the common factor was that in each case the observed flux reached a flux level in excess of 10 Crab in a bin of minutes. For completeness, the salient features of these three instances of exceptional variability are summarized here.
The particular value of these observations was that the signal-to-noise ratio (number of gamma-ray events to background events) was sufficiently large that the spectrum of gamma rays could be determined. In the normal operation of observing a relatively weak source with a single Cherenkov telescope, a parallel series of observations of an off-source region must be taken before a reliable spectrum can be derived. Hence, in this long-term monitoring program, where the emphasis was on determining the lightcurve and off-source measurements were not routinely made, the spectrum could not be reliably derived.
(i) During the 1995–1996 season, Mrk421 was relatively quiet; the mean gamma-ray rate for the season was Crab, with a significance of for a total exposure of 51.8 hours (Figure 4). There were two remarkable outbursts of TeV gamma rays just eight days apart [10]. The first of these occurred on 7th May 1996 (MJD 50210), when over the course of 2.5 hours the flux increased by a factor of five and reached a maximum rate of 10 Crab (30 times the average flux for that season). The observations had to be terminated while the flux was still rising due to increasing moonlight so that the peak of the flare was probably not observed. However, on the following night the flux was down to Crab, just above the season average. A second flare of lower intensity, but unusual for its very short duration, occurred on 15th May 1996 (MJD 50218), when a rise and fall within 30 minutes was observed. The spectrum of the large flare was reported in [40] as s-1 cm-2 TeV-1, where the first error is statistical and the second systematic. This spectrum was confirmed in [41], where slight evidence for curvature was found.
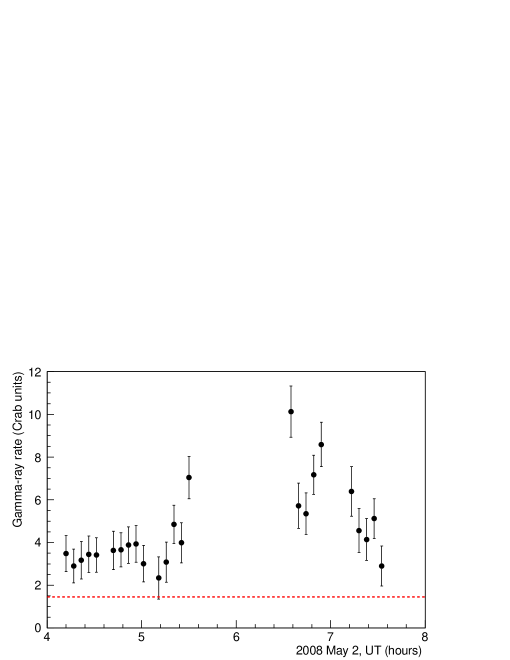
ii) In 2007–2008, the Whipple monitoring program again found Mrk421 in a strong flaring state; on 2nd May 2008 (MJD 54588), the flux exceeded 10 Crab [42] in a 5-minute interval (Figure 13). It appeared that the observation was during the declining phase of a flare whose maximum was not observed. Observations with the VERITAS telescope on the following night confirmed the high level of gamma-ray activity [39].
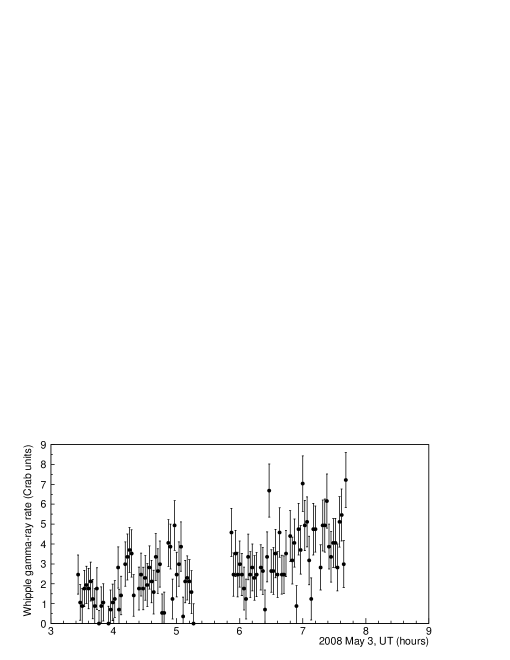
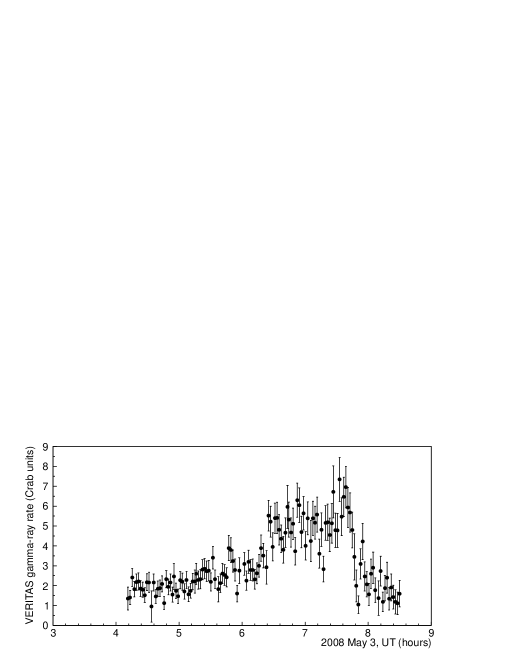
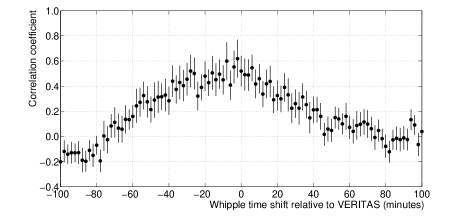
On 3rd May (MJD 54589), the Whipple telescope and VERITAS observed Mrk421 [39], and the light curves are shown in Figure 14, binned in 2-minute intervals. This is the only instance in which observations of the same target with independent imaging atmospheric Cherenkov systems were carried out simultaneously with sufficiently high signal-to-noise ratio to permit a meaningful comparison of the gamma-ray rates. The DCF between the Whipple (single 10 m telescope with energy threshold 400 GeV) and VERITAS (the array of four 12 m telescopes with energy threshold 300 GeV) rates, shown in Figure 14c, is an interesting confirmation of the validity of the atmospheric Cherenkov technique. However, because the observations were at large zenith angles, it was difficult to derive a reliable spectrum from the Whipple telescope observations. For the “very high state”, the spectrum measured with VERITAS was fitted using a power law with exponential cutoff model [9, 43], of the form
yielding normalization constant s-1 m-2 TeV-1 at energy TeV, spectral index , and cutoff energy TeV [39]. Unlike previous observations, this TeV activity did not have a counterpart at X-ray energies and was thus an “orphan” flare.
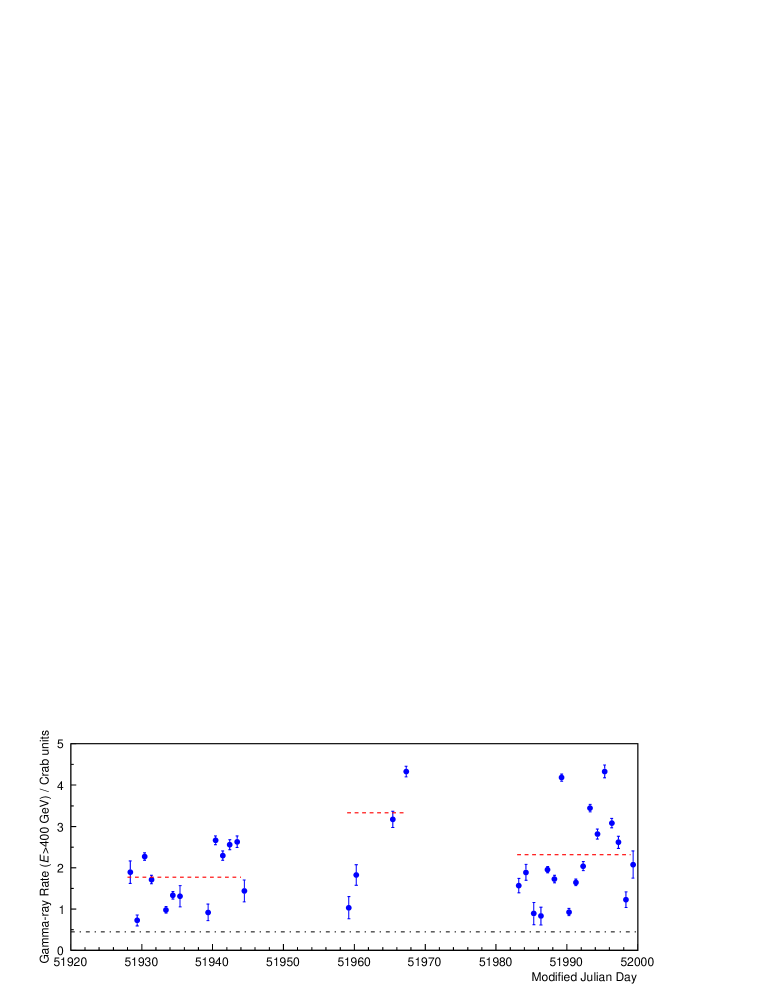
(iii) The most notable variability in the Mrk421 flux level was observed in 2001, with an exceptionally bright long-term gamma-ray high state lasting from January to May (MJD 51928–52053). During the months of January and March, the flux was highly variable and was four to five times the average flux; in February, it increased even further (see Figure 15). It is probably wrong to characterize this activity as a flare since it was more like a series of flares. The source reached a maximum peak flux of 13 Crab on 27th February (MJD 51967). On one night during this high TeV flux state, the detection significance was for a four-hour exposure with an average flux during the four hours of Crab.
For the 2000–2001 observing season, the energy spectrum of Mrk421 in the 0.38–8.2 TeV energy range was measured on timescales of a month over a large range of flux states [9] and fitted using a power law with exponential cutoff model [9, 43]. The position of the cutoff energy is highly correlated with the photon index . To test for spectral variability, the cutoff energy was fixed at TeV. Between November 2000 and April 2001, the TeV gamma-ray energy spectrum of Mrk421 hardened from a photon index at the onset of the large flare to at the peak flux state in late February 2001 [9] and then softened during the decay of the flare event. This month-scale flare provides evidence for a shift in the spectral energy distribution to higher energies in the GeV-TeV band during the peak of the flaring episode. For shorter flaring events, however, there is not always a clear correlation between the TeV gamma-ray rate and the spectral shape.
A detailed study was made of one week of data in March 2001 [11] during which there were several short TeV flares and there was significant simultaneous coverage in the X-ray and optical bands. During the flare on 19th March (MJD 51987), the TeV signal was found to lag the X-ray signal in the 1–4 keV band by minutes. However, the lag was less at higher X-ray energies. No correlation was found between the TeV and optical signals.
7 Conclusions
Atmospheric Cherenkov telescopes are ideally suited for studying AGN, but observations are most sensitive on clear dark nights. The large collection areas associated with the technique make them particularly suited to the study of time variations. Because of their small fields of view, they are generally limited to the study of just one AGN at a time. The profusion of sources and the small number of sensitive telescopes available makes long-term monitoring of a particular source difficult. The Whipple 10 m telescope, while lacking the flux sensitivity of the major new observatories, H.E.S.S., MAGIC and VERITAS, was devoted over a 14-year timespan to observations of Mrk421 (along with a small number of other AGN) and thus provided a unique database. The Whipple 10 m gamma-ray telescope has since been mothballed in the summer of 2011, after 43 years of operation.
Mrk421 is the brightest and most studied blazar that is an emitter at TeV energies. The wealth of observational data makes it an ideal target for modeling the possible emission mechanisms. However, it is not yet clear to what extent it can be regarded as the archetypal TeV-emitting AGN. Given that a large number of blazars are only observed when they flare, it is useful to know the duty cycle of the flaring activity in order to estimate the chances of detection in any planned observing campaign. Although emission at X-ray and TeV gamma-ray wavelengths has been shown to be correlated, emission at other wavelengths (radio, optical, infrared), which can be studied with ground-based telescopes, is not strongly correlated. Hence it is difficult to plan a multiwavelength campaign to observe flaring activity that could be triggered by a non-gamma-ray signal.
Only a small number of blazars have been detected by the Whipple 10 m telescope (Mrk421, Markarian 501 (Mrk501), 1ES2344+514, H1426+428 and 1ES1959+650). Apart from Mrk421 and Mrk501, the average TeV flux level measured for these blazars is extremely low. For example, the average rate observed by the Whipple 10 m telescope from H1426+428 during 2000 and 2001 was only ()% of the Crab Nebula rate [44]. 1ES2344+514 and 1ES1959+650 were only detected by the 10 m telescope because of strong flaring activity [18, 45].
It is therefore difficult to confirm the predictions of flaring frequency using 10 m data alone. As more TeV blazars are identified using data from H.E.S.S., MAGIC, and VERITAS, and their flaring statistics determined in long exposures, it will be possible to ascertain to what extent Mrk421 is typical of TeV-emitting AGN.
Acknowledgements
This research is supported by grants from the U.S. Department of Energy Office of Science, the U.S. National Science Foundation and the Smithsonian Institution, by NSERC in Canada, by Science Foundation Ireland (SFI 10/RFP/AST2748) and by STFC in the U.K. We acknowledge the excellent work of the technical support staff at the Fred Lawrence Whipple Observatory and at the collaborating institutions in the construction and operation of the instruments.
References
References
- [1] Ulrich, M.H. et al. 1997, Ann. Rev. Astron. Astrophys., 35, 445
- [2] Dermer, C. and Schlickeiser, R. 1993, Astrophysical Journal, 416, 458
- [3] Pohl, M. and Schlickeiser, R. 2000, Astronomy and Astrophysics, 354, 395
- [4] Michelson, P.F. et al. 1992, IAU Circular 5470, 1
- [5] Hartman, R.C. et al. 1999, Astrophysical Journal Supplement, 123, 79
- [6] Kerrick, A.D. et al. 1995, Astrophysical Journal, 452, 227
- [7] Punch, M. et al. 1992, Nature, 358, 477
- [8] Wakely, S. and Horan, D. 2012, http//tevcat.uchicago.edu/
- [9] Krennrich, F. et al. 2002, Astrophysical Journal Letters, 575, L9
- [10] Gaidos, J. et al. 1996, Nature, 383, 319
- [11] Fossati, G. et al. 2008, Astrophysical Journal, 677, 906
- [12] Horan, D. et al. 2009, Astrophysical Journal, 695, 596
- [13] Albert, J. et al. 2007, Astrophysical Journal, 669, 862
- [14] Aharonian, F. et al. 2007, Astrophysical Journal Letters, 664, 71
- [15] Kildea, J. et al. 2007, Astroparticle Physics, 28, 182
- [16] Weekes, T.C. et al. 2002, Astroparticle Physics 17, 221
- [17] Reynolds, P.T. et al. 1993, Astrophysical Journal, 404, 206
- [18] Catanese, M. et al. 1998, Astrophysical Journal, 501, 616
- [19] Li, T. and Ma, Y. 1983, Astrophysical Journal, 272, 317
- [20] Tavani, M. et al. 2011, Science: 10.1126/science.1200083
- [21] Abdo, A.A. et al. 2011, Science, 10.1126/science.1199705
- [22] Buehler, R. et al. 2012, Astrophysical Journal, 749, 26
- [23] O’Faoláin de Bhróithe, A. 2012, Proceedings of the 5th International Meeting on High Energy Gamma-Ray Astronomy (Heidelberg), AIP Conference Proceedings 1505, 309
- [24] Wilson-Hodge, C.A. et al. 2011, Astrophysical Journal Letters, 727, L40
- [25] Krawcyznski, H. et al. 2000, Astrophysical Journal, 559, 187
- [26] Błażejowski, M. et al. 2005, Astrophysical Journal, 630, 130
- [27] Rebillot, P.F. et al. 2006, Astrophysical Journal, 641, 740
- [28] Ong, R. 2008, The Astronomer’s Telegram #1506.
- [29] Edelson, R.A. and Krolik, J.H. 1988, Astrophysical Journal, 333, 646
- [30] Hufnagel, B.R. and Bregman, J.N. 1992, Astrophysical Journal 386, 473
- [31] Bradt, H.V., Rothschild, R.E. and Swank, J.H. 1993, Astronomy and Astrophysics Supplement 97, 355
- [32] Levine, A.M. et al. 1996, Astrophysical Journal, 469, L33
- [33] Smith, A.J. et al. 2001, Proceedings of the 27th International Cosmic Ray Conference (Hamburg) 7, 2731
- [34] Atwood, W.B. et al. 2009, Astrophysical Journal, 697, 1071
- [35] Teräsranta, H. et al. 1998, Astronomy and Astrophysics Supplement 132, 305
- [36] Aller, H.D. et al. 1985, Astrophysical Journal Supplement, 59, 513
- [37] Lister, M.L and Homan, D.C. 2005, Astronomical Journal, 130, 1389
- [38] http://xte.mit.edu/asmlc/
- [39] Acciari, V. et al. 2011, Astrophysical Journal, 738, 25
- [40] Zweerink, J. et al. 1997, Astrophysical Journal Letters, 490, L141
- [41] Krennrich, F. et al. 1999, Astrophysical Journal, 511, 149
- [42] Swordy, S. 2008, The Astronomer’s Telegram, #1506
- [43] Aharonian, F. et al. 2005, Astronomy and Astrophysics, 437, 95
- [44] Horan, D. et al. 2002, Astrophysical Journal, 571, 753
- [45] Holder, J. et al. 2003, Astrophysical Journal Letters, 583, L9