Water and Methanol Maser Survey of Protostars in the Orion Molecular Cloud Complex
Abstract
The results of a maser survey toward ninety-nine protostars in the Orion molecular cloud complex are presented. The target sources are low-mass protostars identified from infrared observations. Single-dish observations were carried out in the water maser line at 22 GHz and the methanol class I maser lines at 44, 95, and 133 GHz. Most of the detected sources were mapped to determine the source positions. Five water maser sources were detected, and they are excited by HH 1–2 VLA 3, HH 1–2 VLA 1, L1641N MM1/3, NGC 2071 IRS 1/3, and an object in the OMC 3 region. The water masers showed significant variability in intensity and velocity with time scales of a month or shorter. Four methanol emission sources were detected, and those in the OMC 2 FIR 3/4 and L1641N MM1/3 regions are probably masers. The methanol emission from the other two sources in the NGC 2071 IRS 1–3 and V380 Ori NE regions are probably thermal. For the water masers, the number of detections per protostar in the survey region is about 2%, which suggests that the water masers of low-mass protostars are rarely detectable. The methanol class I maser of low-mass protostars is an even rarer phenomenon, with a detection rate much smaller than 1%.
1 INTRODUCTION
The Orion giant molecular cloud complex is located at a distance of 420 pc from the Sun and is one of the nearest active star-forming regions (Menten et al., 2007; Kim et al., 2008). The molecular complex largely consists of the Orion A and B clouds. Numerous observations have been carried out to investigate the star-formation activities in the Orion molecular clouds. For example, there are surveys of dense cores in molecular lines and dust continuum emission (Lada et al., 1991; Tatematsu et al., 1998; Lis et al., 1998) and surveys of outflows in the molecular hydrogen and CO lines (Davis et al., 2009; Takahashi et al., 2008). Recently, thousands of young stellar objects (YSOs) were identified in the Orion molecular clouds based on infrared observations with the Spitzer Space Telescope, and nearly five hundred objects among them are likely protostars (Megeath et al., 2012). To study 300 of the Spitzer-identified Orion protostars, the Herschel Orion Protostar Survey (HOPS) project was conducted with the Herschel Space Observatory (Fischer et al., 2010; Stutz et al., 2013).
Maser emission is an important signpost of star-formation regions in the early stages of evolution. Observations of masers allow detailed studies of the small-scale environments of deeply embedded YSOs. Many H2O maser observations of YSOs have shown that H2O masers are usually distributed very close ( 1000 AU) to the central objects, are highly variable in both intensity and velocity with time scales from hours to years, and trace molecular outflows and protostellar disks (Genzel & Downes, 1977; Elitzur et al., 1989; Comoretto et al., 1990; Torrelles et al., 1998; Seth et al., 2002; Furuya et al., 2005; Goddi et al., 2005; Felli et al., 2007; Caswell & Breen, 2010). Several CH3OH maser lines also have been detected toward star-forming regions (Val’tts et al., 1995; Kurtz et al., 2004; Kalenskii et al., 2010). The methanol maser lines are divided into class I (36, 44, 84, and 95 GHz lines etc.) and class II (6.7, 12, and 157 GHz lines etc.) (Menten, 1991). CH3OH class I masers are usually offset by 0.1–1 pc from star-formation phenomena (such as hot molecular cores, ultracompact H II regions, and other maser sources) and well-correlated with molecular outflows (Plambeck & Menten, 1990; Cragg et al., 1992; Kurtz et al., 2004; Cyganowski et al., 2009). In general, CH3OH class I lines show little flux variability (Kurtz et al., 2004; Kalenskii et al., 2010).
To investigate the star-formation activities in the early stages, we carried out a maser survey of Spitzer-identified protostars distributed over the Orion molecular cloud complex. Out of the protostars listed in the HOPS catalogue, we selected protostars showing line wings in the CO line spectra obtained with the Seoul Radio Astronomy Observatory 6 m telescope. All HOPS sources were observed in CO with a 48″ beam down to an rms noise of 0.15 K or smaller. The source selection was not affected by previously known masers.
In this paper, we present the results of the survey in the H2O and CH3OH maser lines with the Korean Very Long Baseline Interferometry Network (KVN) antennas. In Section 2, we describe the KVN observations. In Section 3, we present the results of the survey. In Section 4, we describe the detected sources in detail. In Section 5, we discuss the implications of the survey. A summary is given in Section 6.
| Telescope | Observing Period | FrequencyaaFrequency where the beam size and efficiency were measured. | BeambbFull width at half-maximum (FWHM) of the main beam. | ccAperture efficiency. | ddScaling factor for converting the KVN raw data to spectra in the flux density scale for the maser lines, which includes the telescope sensitivity, quantization correction factor (1.25), and sideband separation efficiency (0.8 for the KVN Ulsan/Tamna 129 GHz band and 1.0 otherwise). |
|---|---|---|---|---|---|
| (GHz) | (arcsec) | (Jy K-1) | |||
| KVN Yonsei | 2010 Mar – 2010 Jun | 22 | 122 | 0.65 | 15.3 |
| 44 | 64 | 0.67 | 14.8 | ||
| 2012 Jan – 2012 May | 22 | 119 | 0.65 | 15.3 | |
| 44 | 62 | 0.63 | 15.8 | ||
| 86 | 32 | 0.48 | 20.7 | ||
| 129 | 23 | 0.30 | 33.1 | ||
| KVN Ulsan | 2012 Jan – 2012 May | 22 | 120 | 0.62 | 16.0 |
| 44 | 62 | 0.62 | 16.0 | ||
| 86 | 33 | 0.49 | 20.3 | ||
| 129 | 23 | 0.32 | 38.8 | ||
| KVN Tamna | 2011 Nov – 2012 Mar | 22 | 122 | 0.66 | 15.1 |
| 44 | 64 | 0.60 | 16.6 | ||
| 2012 Mar – 2012 May | 22 | 123 | 0.59 | 16.8 | |
| 44 | 62 | 0.62 | 16.0 | ||
| 86 | 32 | 0.52 | 19.1 | ||
| 129 | 22 | 0.40 | 31.1 |
2 OBSERVATIONS
Ninety-nine protostars in the Orion molecular cloud complex were observed using the KVN 21 m radio antennas in the single-dish telescope mode during the 2010 and 2011–2012 observing seasons. The observations were carried out with the KVN Yonsei telescope at Seoul, the KVN Ulsan telescope at Ulsan, and the KVN Tamna telescope at Seogwipo, Korea. The KVN telescopes are equipped with multi-frequency receiving systems simultaneously operating at 22, 44, 86, and 129 GHz bands (Han et al., 2013). Telescope pointing was checked by observing Orion IRc2 (Baudry et al., 1995) in the SiO maser line at 43 GHz. The pointing observations were performed about once every two hours. The rms pointing accuracy was better than 5″. The alignments among the beams of different frequency bands are better than 3″ (Han et al., 2013).
The target lines were the H2O (22.23508 GHz) line and the CH3OH , , and (44.06943, 95.169516, and 132.890800 GHz, respectively) lines. The 4096-channel digital spectrometers were used as back ends. A bandwidth of 32 MHz was selected, which provides velocity resolutions of 0.105, 0.053, 0.0246, and 0.0176 km s-1 for the target lines. For the 22 GHz H2O and 44 GHz CH3OH line spectra, the Hanning smoothing was applied once and twice, respectively, resulting in a velocity-channel width of 0.21 km s-1 in both lines. For the 95 and 133 GHz CH3OH line spectra, the Hanning smoothing was applied three times, which gives a velocity-channel width of 0.19 and 0.14 km s-1, respectively. For each observing season, the data were calibrated using the standard efficiencies of KVN listed in Table 1 (Lee et al., 2011; Choi et al., 2012) (http://kvn-web.kasi.re.kr). The data were processed with the GILDAS/CLASS software from Institut de RadioAstronomie Millimétrique (http://www.iram.fr/IRAMFR/GILDAS).
In the 2010 season, only the 22 GHz and 44 GHz band receivers were available, and the H2O line and the CH3OH 44 GHz line were observed. Integrations toward each target source were carried out until the average spectra had a noise rms level down to 0.5 Jy. System temperatures were in the range of 70–190 K at 22 GHz and 140–270 K at 44 GHz. Tables 2–4 list the target sources, coordinates, detectability, and noise rms levels of the resulting spectra. Table 2 lists the sources detected in either line. When the emission from a single source is detected toward several nearby target positions, Table 2 lists only the position of the strongest signal. Tables 3 and 4 list the sources undetected in either line. The H2O spectra of the sources marked by “S” in Tables 2 and 3 were affected by the Orion KL masers, and it was difficult to separate the emission of the target region, if any, from that of the Orion KL region (see below).
| HOPSaaSource number in the HOPS catalog. | R.A. | Decl. | DetectionbbY: Detection, N: Non-detection, S: The H2O spectrum is affected by maser emission from the Orion KL region coming through the beam side lobe. | |||
|---|---|---|---|---|---|---|
| (J2000.0) | (J2000.0) | H2O | CH3OH | (Jy) | (Jy) | |
| 64 | 05 35 27.00 | 05 09 54.1 | S | Y | 0.6 | 0.7 |
| 96 | 05 35 29.72 | 04 58 48.8 | S, Y | N | 0.6 | 0.5 |
| 167 | 05 36 19.79 | 06 46 00.9 | Y | N | 0.6 | 0.5 |
| 182 | 05 36 18.83 | 06 22 10.2 | Y | Y | 0.7 | 0.5 |
| 361 | 05 47 05.16 | 00 21 35.9 | Y | Y | 0.7 | 0.6 |
| 362 | 05 36 36.10 | 06 38 53.9 | N | Y | 0.5 | 0.5 |
Note. — Units of Right Ascension are hours, minutes, and seconds, and units of declination are degrees, arcminutes, and arcseconds.
| HOPS | R.A. | Decl. | Detection | |||
|---|---|---|---|---|---|---|
| (J2000.0) | (J2000.0) | H2O | CH3OH | (Jy) | (Jy) | |
| 10 | 05 35 09.01 | 05 58 27.6 | S | N | 0.6 | 0.5 |
| 11 | 05 35 13.41 | 05 57 58.1 | S | N | 0.4 | 0.5 |
| 12 | 05 35 08.60 | 05 55 54.3 | S | N | 0.5 | 0.6 |
| 17 | 05 35 07.18 | 05 52 05.9 | S | N | 0.5 | 0.6 |
| 19 | 05 35 25.99 | 05 51 22.9 | S | N | 0.4 | 0.6 |
| 20 | 05 33 30.71 | 05 50 41.0 | S | N | 0.6 | 0.6 |
| 41 | 05 34 29.44 | 05 35 42.7 | S | N | 0.5 | 0.5 |
| 44 | 05 35 10.57 | 05 35 06.3 | S | N | 0.5 | 0.6 |
| 48 | 05 35 06.56 | 05 32 51.6 | S | N | 0.5 | 0.5 |
| 49 | 05 34 48.88 | 05 31 45.9 | S | N | 0.7 | 0.7 |
| 50 | 05 34 40.91 | 05 31 44.4 | S | N | 0.5 | 0.6 |
| 51 | 05 35 15.83 | 05 30 05.5 | S | N | 0.5 | 0.6 |
| 53 | 05 33 57.37 | 05 23 30.4 | S | N | 0.5 | 0.5 |
| 55 | 05 33 54.09 | 05 21 49.5 | S | N | 0.5 | 0.6 |
| 57 | 05 35 19.84 | 05 15 08.5 | S | N | 0.6 | 0.6 |
| 58 | 05 35 18.51 | 05 13 38.2 | S | N | 0.5 | 0.7 |
| 60 | 05 35 23.33 | 05 12 03.1 | S | N | 0.5 | 0.5 |
| 61 | 05 33 25.91 | 05 12 02.6 | S | N | 0.5 | 0.6 |
| 65 | 05 35 21.56 | 05 09 38.7 | S | N | 0.7 | 0.4 |
| 70 | 05 35 22.41 | 05 08 04.8 | S | N | 0.6 | 0.7 |
| 73 | 05 35 27.70 | 05 07 03.5 | S | N | 0.5 | 0.6 |
| 75 | 05 35 26.66 | 05 06 10.3 | S | N | 0.7 | 0.5 |
| 77 | 05 35 31.53 | 05 05 47.3 | S | N | 0.6 | 0.6 |
| 80 | 05 35 25.19 | 05 05 09.5 | S | N | 0.5 | 0.6 |
| 82 | 05 35 19.73 | 05 04 54.6 | S | N | 0.4 | 0.6 |
| 86 | 05 35 23.65 | 05 01 40.3 | S | N | 0.6 | 0.6 |
| 89 | 05 35 19.96 | 05 01 02.6 | S | N | 0.5 | 0.6 |
| 90 | 05 35 34.47 | 05 00 52.0 | S | N | 0.7 | 0.6 |
| 93 | 05 35 15.03 | 05 00 08.2 | S | N | 0.5 | 0.6 |
| 95 | 05 35 34.20 | 04 59 52.2 | S | N | 0.4 | 0.5 |
| 97 | 05 35 28.89 | 04 57 38.9 | S | N | 0.6 | 0.6 |
| 98 | 05 35 19.32 | 04 55 44.9 | S | N | 0.6 | 0.5 |
| 101 | 05 35 08.23 | 04 54 09.7 | S | N | 0.4 | 0.6 |
| 349 | 05 35 26.21 | 05 08 33.0 | S | N | 0.7 | 0.5 |
| 350 | 05 35 30.22 | 05 08 18.6 | S | N | 0.4 | 0.6 |
| 351 | 05 35 31.43 | 05 04 46.7 | S | N | 0.6 | 0.5 |
| 352 | 05 35 26.58 | 05 04 02.5 | S | N | 0.5 | 0.6 |
Note. — See the end notes of Table 2. Sources listed in Table 2 are not repeated here.
| HOPS | R.A. | Decl. | HOPS | R.A. | Decl. | |||||
|---|---|---|---|---|---|---|---|---|---|---|
| (J2000.0) | (J2000.0) | (Jy) | (Jy) | (J2000.0) | (J2000.0) | (Jy) | (Jy) | |||
| 1 | 05 54 12.34 | 01 42 35.5 | 0.4 | 0.6 | 301 | 05 41 44.77 | 02 15 55.3 | 0.5 | 0.6 | |
| 2 | 05 54 09.13 | 01 42 52.0 | 0.4 | 0.5 | 302 | 05 40 22.41 | 02 15 39.7 | 0.5 | 0.6 | |
| 124 | 05 39 19.98 | 07 26 11.2 | 0.5 | 0.6 | 303 | 05 42 02.62 | 02 07 45.7 | 0.5 | 0.6 | |
| 142 | 05 38 47.77 | 07 00 26.9 | 0.5 | 0.6 | 304 | 05 41 45.94 | 01 56 26.1 | 0.7 | 0.5 | |
| 152 | 05 37 58.76 | 07 07 25.3 | 0.5 | 0.5 | 305 | 05 41 45.38 | 01 51 56.8 | 0.6 | 0.6 | |
| 158 | 05 37 24.46 | 06 58 32.8 | 0.6 | 0.6 | 309 | 05 42 47.36 | 01 24 47.0 | 0.6 | 0.7 | |
| 164 | 05 37 00.45 | 06 37 10.5 | 0.4 | 0.6 | 310 | 05 42 27.68 | 01 20 01.0 | 0.5 | 0.6 | |
| 165 | 05 36 23.54 | 06 46 14.6 | 0.7 | 0.5 | 313 | 05 41 00.76 | 01 09 10.6 | 0.5 | 0.6 | |
| 166 | 05 36 25.13 | 06 44 41.8 | 0.7 | 0.5 | 316 | 05 46 07.29 | 00 13 23.0 | 0.6 | 0.6 | |
| 178 | 05 36 24.61 | 06 22 41.3 | 0.7 | 0.5 | 320 | 05 46 14.21 | 00 05 26.8 | 0.5 | 0.6 | |
| 180 | 05 36 59.39 | 06 10 15.6 | 0.5 | 0.6 | 321 | 05 46 33.17 | 00 00 02.2 | 0.5 | 0.6 | |
| 187 | 05 35 50.94 | 06 22 43.5 | 0.4 | 0.5 | 322 | 05 46 46.49 | 00 00 16.1 | 0.5 | 0.6 | |
| 191 | 05 36 17.26 | 06 11 11.0 | 0.6 | 0.5 | 325 | 05 46 39.25 | 00 01 15.0 | 0.6 | 0.7 | |
| 192 | 05 36 32.45 | 06 01 16.2 | 0.5 | 0.6 | 326 | 05 46 39.58 | 00 04 16.6 | 0.4 | 0.5 | |
| 221 | 05 42 47.05 | 08 17 07.0 | 0.6 | 0.5 | 330 | 05 46 51.37 | 00 19 47.4 | 0.4 | 0.5 | |
| 223 | 05 42 48.46 | 08 16 34.5 | 0.6 | 0.5 | 331 | 05 46 28.32 | 00 19 49.4 | 0.6 | 0.6 | |
| 256 | 05 40 45.26 | 08 06 42.2 | 0.5 | 0.6 | 332 | 05 47 31.70 | 00 20 20.8 | 0.3 | 0.4 | |
| 257 | 05 41 19.87 | 07 55 46.6 | 0.5 | 0.5 | 333 | 05 47 22.88 | 00 20 58.3 | 0.6 | 0.6 | |
| 260 | 05 40 19.39 | 08 14 16.4 | 0.5 | 0.6 | 334 | 05 46 48.52 | 00 21 28.2 | 0.7 | 0.6 | |
| 285 | 05 40 05.90 | 07 29 32.9 | 0.5 | 0.6 | 335 | 05 47 05.86 | 00 22 38.9 | 0.5 | 0.6 | |
| 287 | 05 40 08.78 | 07 27 27.7 | 0.4 | 0.5 | 336 | 05 46 02.28 | 00 23 30.7 | 0.5 | 0.6 | |
| 291 | 05 39 57.97 | 07 28 57.5 | 0.6 | 0.5 | 337 | 05 46 55.10 | 00 23 34.6 | 0.6 | 0.5 | |
| 292 | 05 37 54.88 | 07 41 20.3 | 0.5 | 0.6 | 340 | 05 47 01.29 | 00 26 21.5 | 0.4 | 0.6 | |
| 295 | 05 41 28.94 | 02 23 19.4 | 0.5 | 0.6 | 345 | 05 47 38.98 | 00 38 36.3 | 0.4 | 0.5 | |
| 296 | 05 41 17.17 | 02 18 07.6 | 0.6 | 0.6 | 347 | 05 47 15.89 | 00 21 23.8 | 0.7 | 0.7 | |
| 297 | 05 41 23.27 | 02 17 35.8 | 0.7 | 0.6 | 348 | 05 47 00.27 | 00 20 37.5 | 0.7 | 0.5 | |
| 298 | 05 41 37.17 | 02 17 17.0 | 0.6 | 0.5 | 354 | 05 54 24.26 | 01 44 19.3 | 0.5 | 0.6 | |
| 300 | 05 41 24.21 | 02 16 06.4 | 0.6 | 0.6 | 360 | 05 47 27.07 | 00 20 33.1 | 0.7 | 0.5 |
Note. — See the end notes of Table 2.
In 2011 November–December, all the target sources were observed again in the H2O line and the CH3OH 44 GHz line. Though the integrations were shorter in duration than those in the previous season, close attention was paid to the effect of the Orion KL masers. Observations toward the Orion KL region were made several times a day so that the line profiles could be compared at any observing day. The coordinates of Orion KL masers used for this monitoring observations are (05h35m1412, 05°22′364). While the H2O spectra of most of the “S” sources showed only the signal from the Orion KL region, one source (HOPS 96) showed a positive signal from the target source.
In 2012 January–May, the 86 and 129 GHz band receivers became available, and we focused on the sources detected in the previous observing runs. Observations were made in the CH3OH 95 and 133 GHz lines toward the sources detected in the 44 GHz line. The areas around the detected sources were mapped in the H2O line and the CH3OH 95 GHz line to determine the source positions accurately and to identify the YSOs associated with the emission sources. The maps were made with grid spacings smaller than a half beam (FWHM/2).
2.1 Water Masers of the Orion KL Region
As the KVN telescopes were designed mainly for interferometry, the power levels of their beam side lobes are relatively high (Lee et al., 2011). The Orion KL region contains a dense cluster of YSOs generating bright H2O masers (Gaume et al., 1998). Our results show that the spectra toward the target sources within 0.5° from Orion KL are contaminated by the emission from the Orion KL masers coming through the side lobes. The extent of the effect, however, varies with the intensity of the Orion KL masers and the complex pattern of the side lobes. To verify if there is maser emission coming from a target source, the spectra of the target source and Orion KL should be compared.
In the 2010 observing season, the spectra of Orion KL were obtained sparsely, and the comparison spectra are not available for every observing day, which makes the comparison somewhat ambiguous. Figure 1(a) shows an example. HOPS 350 is located 0.25° away from Orion KL. All the velocity components in the spectrum of HOPS 350 can be seen in the spectrum of Orion KL obtained 9 days later. However, the line profile (intensity ratios among the velocity components) changed substantially, and it is not clear if any of the velocity components (e.g., the 6 km s-1 component) contains emission from HOPS 350. Such comparisons suggest that the Orion KL masers should have been monitored daily.
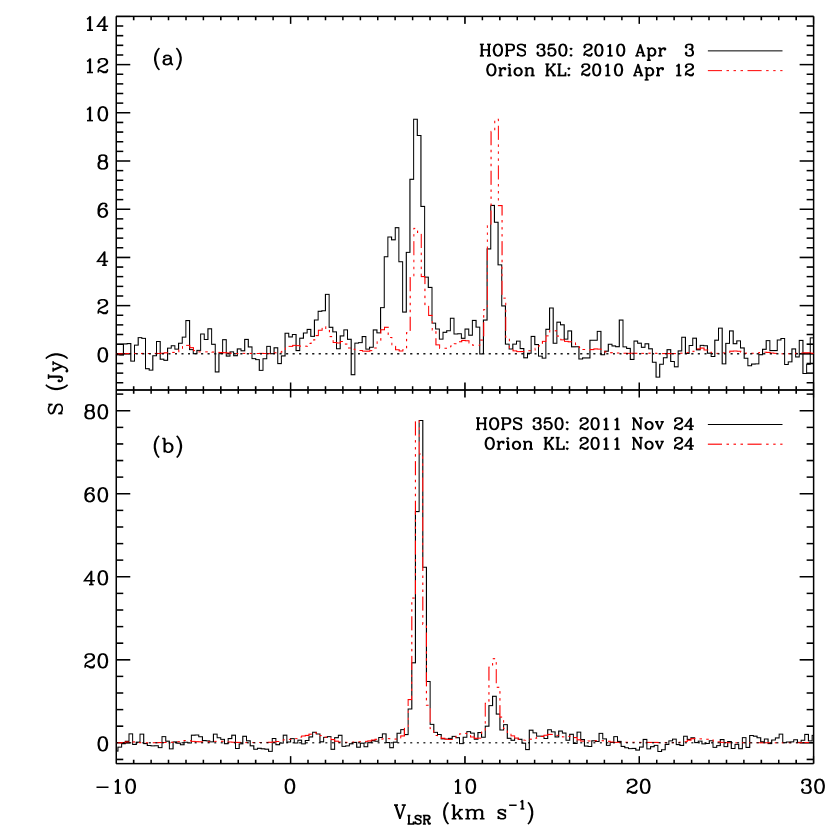
In the 2011–2012 season, while the target sources were observed again, the spectra of Orion KL were obtained every 2 hours. Figure 1(b) shows the spectra of the H2O maser lines toward HOPS 350 and Orion KL, observed on the same day. The comparison shows that all the velocity components came from the Orion KL masers. The line profiles of the two spectra are slightly different because the Orion KL masers are distributed over an extended (30′′) region (Gaume et al., 1998).
This contamination from Orion KL masers hinders the detection of weak (10 Jy) maser emission from the affected target sources. It is possible, however, to detect a maser towards these targets if the intensity is very strong or if the line velocity is far from the velocity interval crowded with the Orion KL masers.
| HOPS | Epoch | aaWhen the uncertainty is smaller than 0.015 km s-1, it is listed as 0.01 km s-1. | aaWhen the uncertainty is smaller than 0.015 km s-1, it is listed as 0.01 km s-1. | |||||
|---|---|---|---|---|---|---|---|---|
| (km s-1) | (Jy km s-1) | (km s-1) | (Jy) | |||||
| 96 | 2011 Nov 24 | 14.39 | 0.06 | 2.4 | 0.5 | 0.55 | 0.14 | 4.1 |
| 167 | 2010 Apr 20 | 6.69 | 0.01 | 37.9 | 0.4 | 0.68 | 0.01 | 52.8 |
| 2011 Nov 25 | 0.08 | 0.01 | 31.4 | 0.9 | 0.92 | 0.02 | 26.8 | |
| 0.91 | 0.01 | 79.4 | 1.3 | 0.92 | 0.02 | 81.1 | ||
| 2012 Jan 11 | 1.97 | 0.12 | 5.9 | 1.4 | 0.94 | 0.25 | 5.9 | |
| 2012 Jan 22bbThe parameters are for the spectrum toward the KLC 3 position in Table 6. | 13.42 | 0.03 | 8.0 | 0.9 | 0.59 | 0.07 | 12.9 | |
| 2012 Jan 29 | 0.14 | 0.05 | 1.5 | 0.2 | 0.67 | 0.11 | 2.2 | |
| 182 | 2010 Apr 24 | 7.34 | 0.06 | 0.7 | 0.3 | 0.39 | 0.18 | 1.8 |
| 7.09 | 0.02 | 25.5 | 1.2 | 0.95 | 0.03 | 25.4 | ||
| 8.26 | 0.03 | 26.7 | 1.3 | 1.25 | 0.06 | 20.1 | ||
| 23.81 | 0.02 | 6.9 | 0.3 | 0.74 | 0.04 | 8.8 | ||
| 25.64 | 0.03 | 0.6 | 0.2 | 0.21 | 0.38 | 2.7 | ||
| 2011 Nov 25 | 6.62 | 0.01 | 240.4 | 0.7 | 0.97 | 0.01 | 233.7 | |
| 2012 Jan 11 | 6.45 | 0.01 | 296.4 | 0.8 | 0.84 | 0.01 | 331.3 | |
| 2012 Jan 30 | 6.40 | 0.01 | 239.4 | 0.4 | 0.78 | 0.01 | 288.2 | |
| 361 | 2010 May 26 | 7.54 | 0.01 | 129.5 | 0.7 | 0.79 | 0.01 | 155.0 |
| 8.98 | 0.01 | 90.2 | 0.8 | 1.16 | 0.01 | 73.4 | ||
| 2011 Nov 25 | 2.74 | 0.03 | 4.0 | 0.7 | 0.45 | 0.09 | 8.5 | |
| 0.82 | 0.02 | 13.2 | 0.8 | 0.64 | 0.04 | 19.4 | ||
| 3.36 | 0.02 | 39.0 | 1.6 | 0.79 | 0.04 | 46.2 | ||
| 5.79 | 0.06 | 26.5 | 2.5 | 1.43 | 0.17 | 17.4 | ||
| 7.78 | 0.03 | 46.8 | 2.9 | 1.10 | 0.08 | 39.8 | ||
| 9.14 | 0.05 | 17.5 | 2.5 | 0.92 | 0.14 | 18.0 | ||
| 10.82 | 0.11 | 12.4 | 2.2 | 1.54 | 0.34 | 7.6 | ||
| 12.63 | 0.01 | 123.6 | 1.4 | 0.80 | 0.01 | 145.1 | ||
| 2012 Jan 11 | 5.82 | 0.02 | 22.7 | 1.4 | 0.60 | 0.04 | 35.7 | |
| 2.85 | 0.01 | 280.8 | 1.1 | 0.75 | 0.01 | 350.1 | ||
| 5.89 | 0.03 | 18.3 | 1.7 | 0.69 | 0.09 | 25.1 | ||
| 2012 Jan 30 | 5.62 | 0.06 | 7.3 | 0.7 | 1.02 | 0.08 | 6.8 | |
| 2.51 | 0.01 | 310.7 | 0.8 | 0.74 | 0.01 | 394.7 | ||
| 5.82 | 0.01 | 16.8 | 0.5 | 0.85 | 0.03 | 18.6 | ||
| 8.01 | 0.05 | 14.4 | 0.9 | 2.01 | 0.17 | 6.7 | ||
| 13.29 | 0.01 | 58.2 | 0.4 | 0.77 | 0.01 | 71.3 | ||
| 16.25 | 0.01 | 20.8 | 0.5 | 0.86 | 0.02 | 22.7 | ||
Note. — The line parameters are from the Gaussian fits to each velocity component in the spectra observed toward the target source positions in Table 2.
3 RESULTS
3.1 H2O Masers
The H2O maser line was detected toward four target sources: HOPS 96, 167, 182, and 361. All the H2O masers showed large variations in flux and velocity over the observing runs from 2010 to 2012. Table 5 lists the properties of the detected H2O masers: peak velocity, integrated line flux, line FWHM, and peak intensity from Gaussian fits. While the HOPS 96 maser was detected only once, the others were detected multiple times. Even for the multiply detected target sources, the line velocities of detected spectral features changed significantly from one observing run to the next, except for the steady 6.6 km s-1 component of HOPS 182. This variability suggests that the typical lifetime of each velocity component is about a month or shorter.
The areas around the detected target sources were mapped to identify the YSOs responsible for the excitation of the masers. The HOPS 96 field was not mapped because the maser detected in 2011 November already disappeared by the time we tried to map it in 2012 January. Each map was fitted with a Gaussian intensity profile having the same FWHM as the main beam. The intensity distribution of each mapping field and each velocity component is consistent with what is expected from a point-like source (convolved with the beam). Table 6 lists the source positions determined by the mapping. Two H2O maser sources (KLC 2/3) were identified in the HOPS 167 field. For the HOPS 361 field, all the velocity components (at the mapping epoch) seem to come from a single source (or a single region much smaller than the beam size), KLC 6.
| KLCaaThe line emission sources are numbered with a prefix KLC. | HOPS | Line | Epoch | R.A. | Decl. | Associated Object | |
|---|---|---|---|---|---|---|---|
| Field | (km s-1) | (J2000.0) | (J2000.0) | ||||
| 1 | 64 | CH3OH | 2012 May 7 | 11 | 05 35 27.7 | 05 09 46 | OMC 2 MIR 23 |
| 2 | 167 | H2O | 2011 Nov 25 | 0, 1 | 05 36 18.6 | 06 45 24 | HH 1–2 VLA 3 |
| 3 | H2O | 2012 Jan 22 | 13 | 05 36 22.5 | 06 46 01 | HH 1–2 VLA 1 | |
| 4 | 182 | H2O | 2012 Jan 11 | 6 | 05 36 18.4 | 06 22 11 | L1641N MM1/3 |
| 5 | CH3OH | 2012 May 7 | 7 | 05 36 17.7 | 06 22 20 | L1641N MM1/3 | |
| 6 | 361 | H2O | 2011 Nov 25 | (3, 13)bbAll the velocity components listed in Table 5. | 05 47 04.2 | 00 21 44 | NGC 2071 IRS 1/3 |
| 7 | CH3OH | 2012 Jan 30 | 10 | 05 47 04.9 | 00 21 44 | NGC 2071 IRS 1–3 | |
| 8 | 362 | CH3OH | 2012 May 11–12 | 9 | 05 36 36.7 | 06 39 17 | V380 Ori NE |
Note. — For most sources, the position uncertainty from the Gaussian fit to the map is much smaller than the pointing uncertainty of the telescopes, and their total position uncertainty is 5′′. For KLC 2 and 3, the two contributions are comparable, and the total position uncertainty is 6′′. The CH3OH source positions were determined from the maps made in the 95 GHz line.
3.2 CH3OH Lines
The CH3OH 44 GHz line was detected toward four target sources: HOPS 64, 182, 361, and 362. Follow-up observations toward these sources showed that the 95 and 133 GHz lines are also detectable. For each source, the three CH3OH lines have similar velocities and profiles, which suggests that they have the same origin. The 95 GHz line maps of HOPS 64/182 show that these emission sources are compact (much smaller than the 29′′ beam size). The maps of HOPS 361/362 show that these sources are extended (20′′–50′′). Table 6 lists the peak positions, and Table 7 lists the properties of the CH3OH lines at those positions.
| KLC | HOPS | Frequency | aaWhen the uncertainty is smaller than 0.015 km s-1, it is listed as 0.01 km s-1. | aaWhen the uncertainty is smaller than 0.015 km s-1, it is listed as 0.01 km s-1. | |||||
|---|---|---|---|---|---|---|---|---|---|
| Field | (GHz) | (km s-1) | (Jy km s-1) | (km s-1) | (Jy) | ||||
| 1 | 64 | 44 | 11.24 | 0.01 | 101.5 | 0.3 | 0.41 | 0.01 | 234.9 |
| 95 | 11.44 | 0.01 | 139.8 | 1.0 | 0.60 | 0.01 | 219.1 | ||
| 133 | 11.37 | 0.01 | 35.1 | 1.4 | 0.66 | 0.04 | 50.2 | ||
| 5 | 182 | 44 | 7.35 | 0.03 | 6.1 | 0.2 | 1.80 | 0.07 | 3.2 |
| 44bbTwo-component Gaussian fit. | 7.00 | 0.21 | 3.3 | 0.2 | 1.02 | 0.21 | 3.0 | ||
| 7.90 | 0.21 | 1.9 | 0.2 | 0.60 | 0.21 | 3.0 | |||
| 95 | 7.42 | 0.04 | 14.0 | 0.7 | 1.63 | 0.09 | 8.1 | ||
| 133 | 7.30 | 0.18 | 12.0 | 1.8 | 2.67 | 0.53 | 4.2 | ||
| 7 | 361 | 44 | 9.75 | 0.10 | 6.4 | 0.4 | 3.32 | 0.33 | 1.8 |
| 95 | 9.53 | 0.08 | 13.6 | 0.8 | 2.92 | 0.22 | 4.4 | ||
| 133 | 9.54 | 0.10 | 34.6 | 2.4 | 3.30 | 0.31 | 9.8 | ||
| 8 | 362 | 44 | 8.48 | 0.05 | 12.1 | 0.4 | 3.26 | 0.15 | 3.5 |
| 95 | 8.57 | 0.07 | 26.3 | 1.1 | 3.58 | 0.18 | 6.9 | ||
| 133 | 8.80 | 0.22 | 49.6 | 3.5 | 6.25 | 0.59 | 7.4 | ||
Note. — The line parameters are from the Gaussian fits to the spectra observed toward the source positions in Table 6.
In contrast with the H2O masers, the CH3OH lines did not show any significant variability. The flux variability, if any, is smaller than the calibration uncertainty of the telescopes (10%). The peak velocities of the CH3OH lines are always close (within 1 km s-1) to the systemic velocity of the ambient cloud.
Unlike with the H2O maser line, the detection of CH3OH class I maser lines does not necessarily mean that the detected flux is amplified emission. They can be either maser or thermal emission, or a mixture of both. The CH3OH lines of KLC 1 are particularly strong and narrow, and they are most likely masers. The KLC 5 lines are probably partial masers because the lines are narrow and the source size is small. The KLC 7 and 8 lines are probably thermal because the lines are relatively wide and the sources are extended.
4 NOTES ON THE DETECTED SOURCES
In this section, we describe the detected sources in detail and present the spectra and maps of the H2O and CH3OH lines. The maps show the source positions determined by mapping observations, as well as the positions of known YSOs superposed on the color-composite infrared images of the Wide-Field Infrared Survey Explorer (WISE) (Wright et al., 2010).
4.1 KLC 1 in the HOPS 64 Field (OMC 2)
The CH3OH class I maser lines at 44, 95, and 133 GHz were detected toward KLC 1 (Figure 2). All the three lines are quite strong. Their velocities are close (within 0.3 km s-1) to the systemic velocity of the ambient dense molecular cloud measured in the CS line (Tatematsu et al., 1998). The source position was determined using a 95 GHz line map that is a regular-grid map of 5 5 points with a spacing of 75. Fitting the map with a Gaussian intensity profile suggests that the source is compact (much smaller than the beam size). The best-fit source position of KLC 1 is (10″, 8″) with respect to HOPS 64 (Figure 3). KLC 1 is located between the FIR 3 cluster (FIR 3, IRS 4N/S, and VLA 11) and the FIR 4 cluster (FIR 4, HOPS 64, and VLA 12), and it is difficult to specify the YSO responsible for the excitation of the maser.

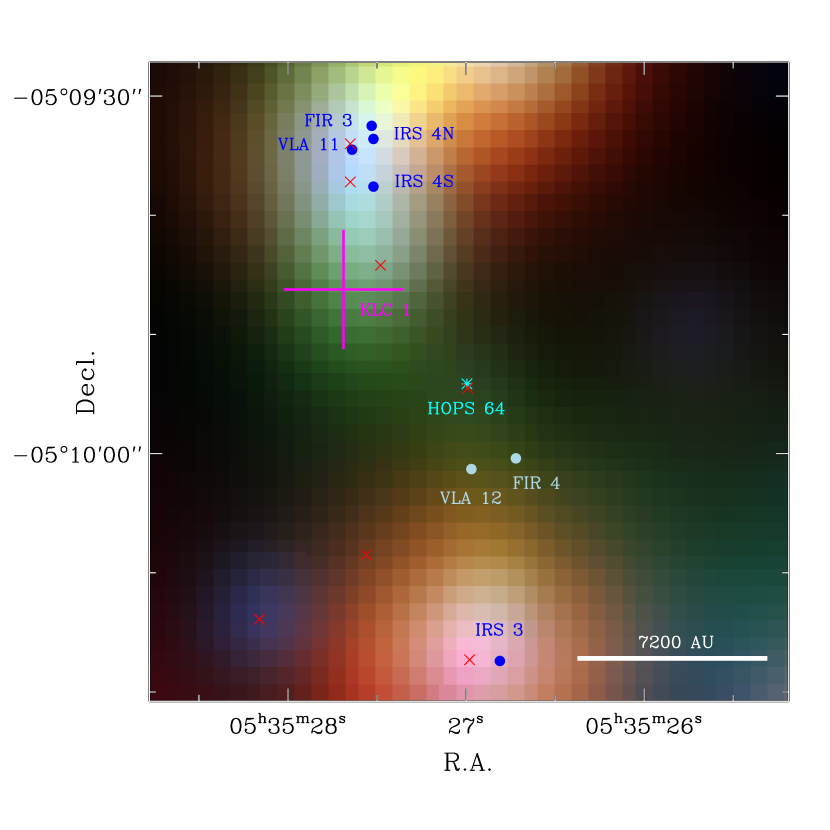
KLC 1 positionally coincides with the mid-IR source MIR 23 within 4′′ (Nielbock et al., 2003). There is little known about MIR 23, and its relation with the maser activities is not clear. Interferometric observations in the 44 and 95 GHz lines were presented by Slysh & Kalenskii (2009), which show several maser spots distributed along a line. Their maser spot A coincides with KLC 1 within 1′′, while other spots are also within the uncertainty circle of KLC 1. Slysh & Kalenskii (2009) suggested that the maser is associated with IRS 4S. The linear distribution of the spots, however, is neither pointing toward nor perpendicular to IRS 4S. The line of spots rather points toward the FIR 4 cluster. Further observations are needed to understand the KLC 1 maser and its relation with the YSOs around it.
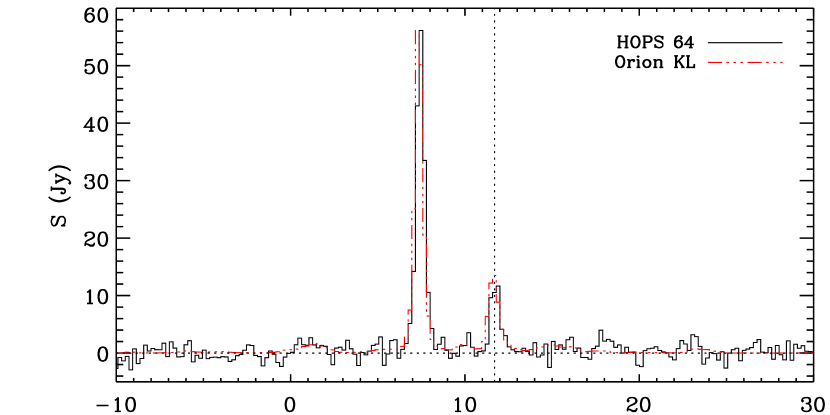
The H2O line spectra toward HOPS 64 were affected by the Orion KL masers. Figure 4 shows an example. All the velocity components in the HOPS 64 spectrum may be attributed to the Orion KL masers, and no H2O maser associated specifically with HOPS 64 was detected in this survey. Detections of an H2O maser in this region, however, were reported previously (Morris & Knapp, 1976; Genzel & Downes, 1979). Interferometric observations showed that the H2O maser is associated with FIR 3 (Tofani et al., 1995). The H2O maser was probably inactive in the 2010–2012 period.
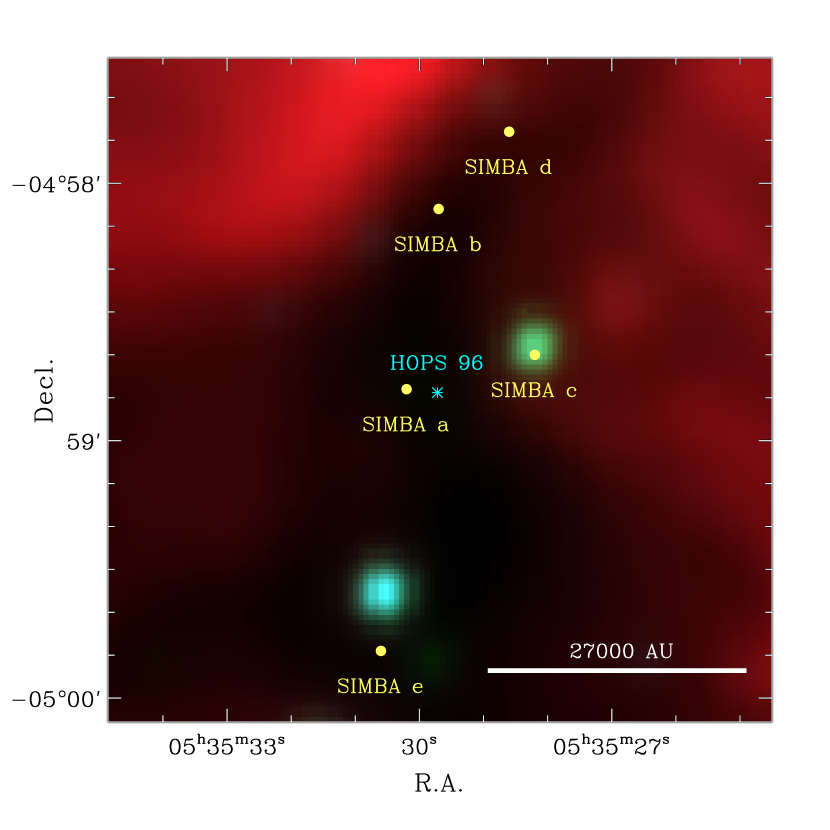
4.2 HOPS 96 (OMC 3)
There are at least three YSOs in the HOPS 96 field: HOPS 96 in the SIMBA a condensation and MIR 1/2 in the SIMBA c condensation (Nielbock et al., 2003). These condensations show molecular outflows traced by the CO line (Takahashi et al., 2008).
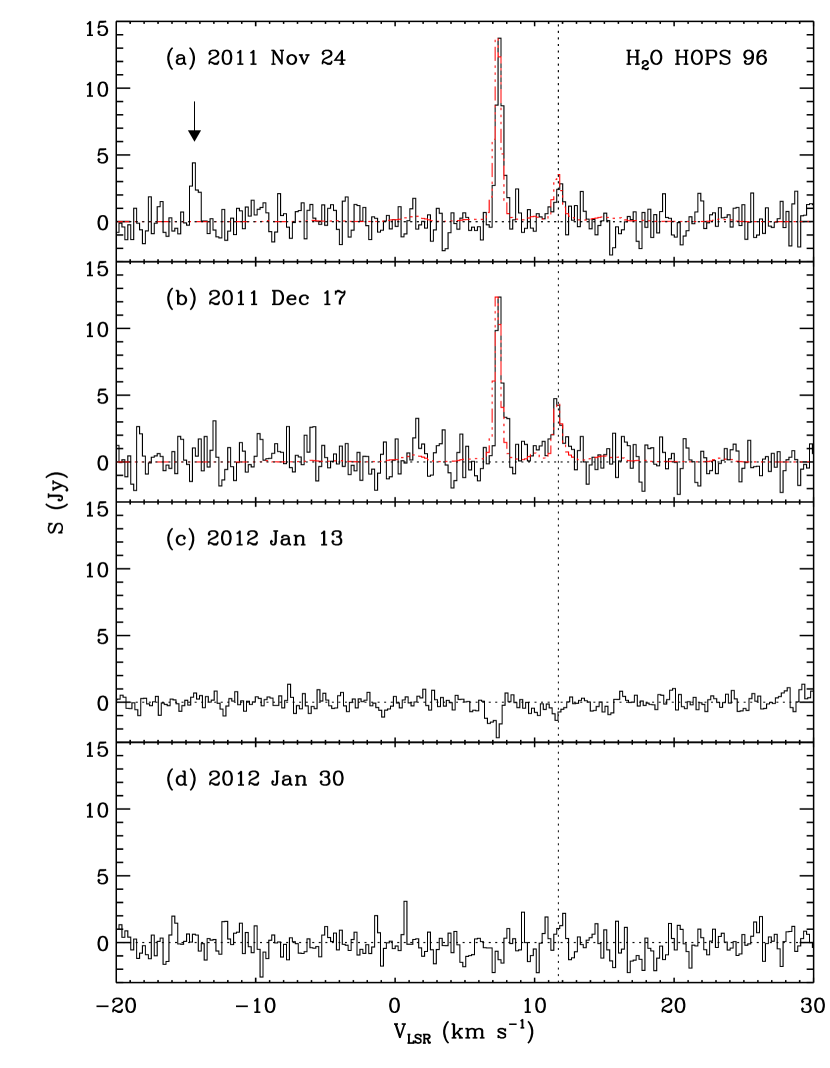
Though the H2O spectra toward HOPS 96 are occasionally contaminated by the Orion masers, an emission component was marginally detected in the uncontaminated velocity space (Figure 5). This velocity component detected at 14 km s-1 in 2011 November may be coming from a maser source in the HOPS 96 field. The component, however, disappeared in all subsequent observing runs, and there is no map to determine its position accurately. The maser source can be anywhere in the region shown in Figure 6 and may be excited by one of the three YSOs listed above.
4.3 KLC 2/3 in the HOPS 167 Field (HH 1)
HOPS 167 is located in the HH 1–2 region that is an extensively studied star-forming location (Pravdo et al., 1985; Reipurth et al., 1993; Choi & Zhou, 1997; Rodríguez et al., 2000; Kwon et al., 2010; Fischer et al., 2010). There are two class 0 protostars (VLA 1/3) though the classification is somewhat uncertain (Chini et al., 2001). Fischer et al. (2010) reported that both VLA 1 (HOPS 203) and VLA 3 (HOPS 168) are in an active state of mass infall and accretion. They are probably the youngest and most luminous protostars in this region.
The HOPS 167 region displayed interesting H2O maser activities. The maser emission was relatively strong (30–80 Jy) in 2010–2011, became weak (2–13 Jy) in 2012 January, and disappeared in 2012 May (Figure 7).

Mapping observations were carried out three times. In 2011 November, the HOPS 167 region was mapped with a grid spacing of 65″. The best-fit source position of KLC 2 is (18′′, 37′′) with respect to HOPS 167 (Figure 8). On 2012 January 22, the region was mapped again with a 43′′ spacing. The position of the 13 km s-1 component turned out to have an offset from KLC 2 by about a half beam, and there was no emission from KLC 2. The best-fit position of this new source, KLC 3, is (40′′, 0′′) with respect to HOPS 167. The separation between KLC 2 and 3 is 69′′. On 2012 January 29–30, the region was mapped again with a 43′′ spacing. The position of the 0 km s-1 component was consistent with KLC 2, though the detection was marginal, and emission from KLC 3 had disappeared. In short, two H2O maser sources were detected in the HOPS 167 field, and both of them displayed a rapid variability.
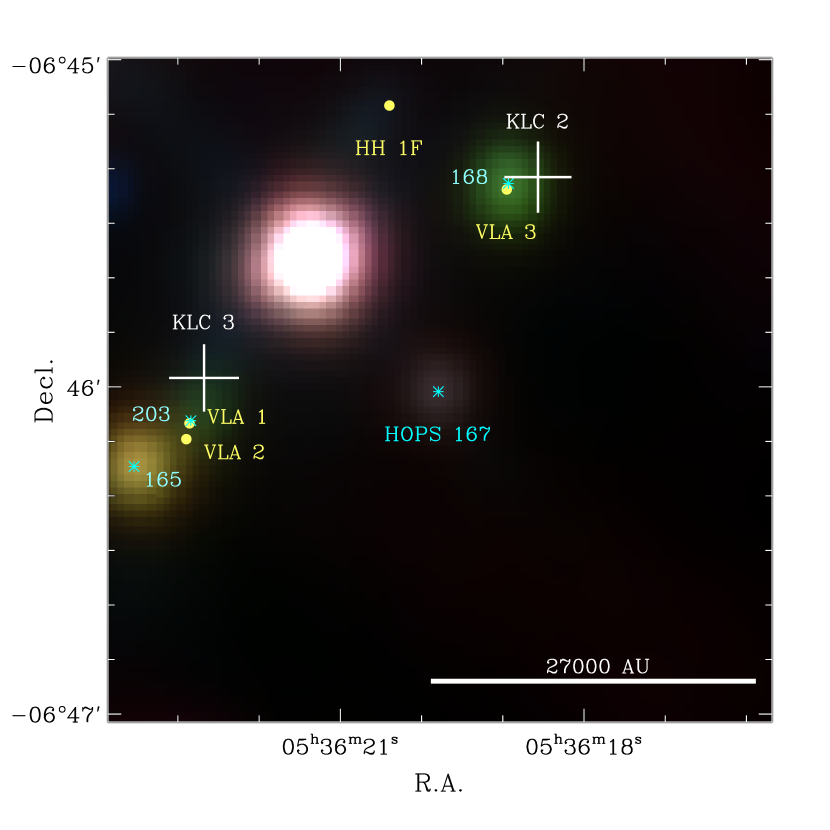
KLC 2 coincides within 5′′ with the deeply embedded protostar VLA 3 (Rodríguez et al., 2000). The KLC 2 (VLA 3) maser was reported previously and known to vary rapidly (Lo et al., 1975; Ho et al., 1982; Haschick et al., 1983). VLA 3 drives a molecular outflow that is separate from the HH 1–2 outflow (Choi & Zhou, 1997; Moro-Martín et al., 1999).
KLC 3 is located 8′′ northwest of VLA 1 (HOPS 203), which corresponds to the brightest knot of the HH 1 jet (knot G in Figure 3 of Reipurth et al. (1993)). Considering the 5′′ pointing uncertainty of the telescope, KLC 3 may be associated with either the HH 1 jet or VLA 1. In any case, VLA 1 seems to be the YSO responsible for the excitation of the KLC 3 maser. Detection of H2O maser emission near VLA 1 has not been reported previously.
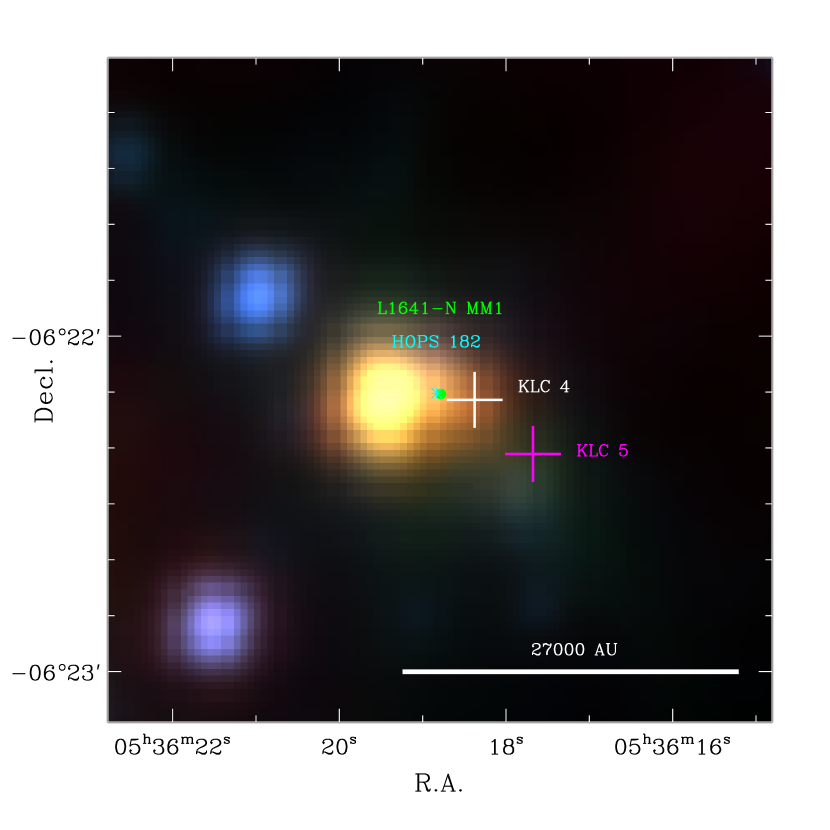
4.4 KLC 4/5 in the HOPS 182 Field (L1641N)
The central region of the L1641N cluster is crowded with many YSOs and multiple outflows (Stanke & Williams, 2007; Gâlfalk & Olofsson, 2008), and it is difficult to study the nature of each individual object. MM1 (HOPS 182) is a low-mass or intermediate-mass protostar deeply embedded in an envelope of 1.6 (Chen et al., 1995; Stanke & Williams, 2007). MM3 is a “protrusion” of MM1 in the 1.3 mm continuum image of Stanke & Williams (2007). It is probably a deeply embedded YSO, but its nature is poorly known.


The H2O line and the three CH3OH lines were detected toward the L1641N region (Figures 9–10). The H2O maser spectrum displayed five velocity components in 2010 April: two near the systemic velocity and three at relatively high velocities (one highly blueshifted and two highly redshifted). In the subsequent observing runs, the high-velocity components disappeared while one of the low-velocity components became much brighter than before.
Mapping observations in the H2O line were carried out on 2012 January 11 with a grid spacing of 16′′. The best-fit position of the source (KLC 4) is 6′′ west of L1641N MM1 (Figure 11). We presume that KLC 4 is associated with MM1/3. The H2O maser reported by Xiang & Turner (1995) is displaced by 40′′ to the east with respect to KLC 4. Considering their position uncertainty of 22′′, the displacement is significant. It is not clear whether the maser of Xiang & Turner (1995) is excited by MM1/3 or by a different YSO in the L1641N cluster.
The CH3OH 44 GHz line shows a double-peak profile while the 95 GHz line shows a single peak (Figure 10). It is not clear whether the 44 GHz spectrum represents two velocity components of maser emission or a single component of thermal emission with a self-absorption feature. We favor, however, the interpretation that the 44 GHz line consists of two narrow features. The 95 GHz line shows a redshifted line wing.
The CH3OH source position was determined by mapping the region in the 95 GHz line with a grid spacing of 11′′. The best-fit source position of KLC 5 is (16′′, 10′′) with respect to MM1 (Figure 11). KLC 5 coincides within 3′′ with the compact emission feature “southwest shock” traced by the CH3OH lines, which is at the tip of the redshifted jet probably driven by MM3 (Stanke & Williams, 2007).
4.5 KLC 6/7 in the HOPS 361 Field (NGC 2071)
Previous observations of the NGC 2071 region showed many YSOs and various star formation activities such as OH and H2O masers (Pankonin et al., 1977; Genzel & Downes, 1979; Tofani et al., 1995), infrared sources (Persson et al., 1981; Walther et al., 1993), compact radio sources (Snell & Bally, 1986; Torrelles et al., 1998), and molecular outflows (Snell et al., 1984; Scoville et al., 1986; Choi et al., 1993; Stojimirović et al., 2008). IRS 1 is the most luminous object in this region and is an intermediate-mass class I protostar (Skinner et al., 2009). The distributions of radio continuum and H2O maser emission suggest that IRS 1 drives a jet in the east-west direction (Tofani et al., 1995; Torrelles et al., 1998; Trinidad et al., 2009; Carrasco-González et al., 2012). IRS 3 is a deeply embedded protostar, but its nature is less certain (Skinner et al., 2009). IRS 3 drives a large-scale outflow/jet in the northeast-southwest direction, and its H2O masers seem to trace a rotating disk (Torrelles et al., 1998; Eislöffel, 2000; Trinidad et al., 2009).
The H2O line and the three CH3OH lines were detected toward the NGC 2071 region (Figures 12–13). The H2O maser spectrum displayed a strong variability in flux and velocity over the four observing runs. The velocity components were distributed in a relatively wide range, from 6 to 16 km s-1.


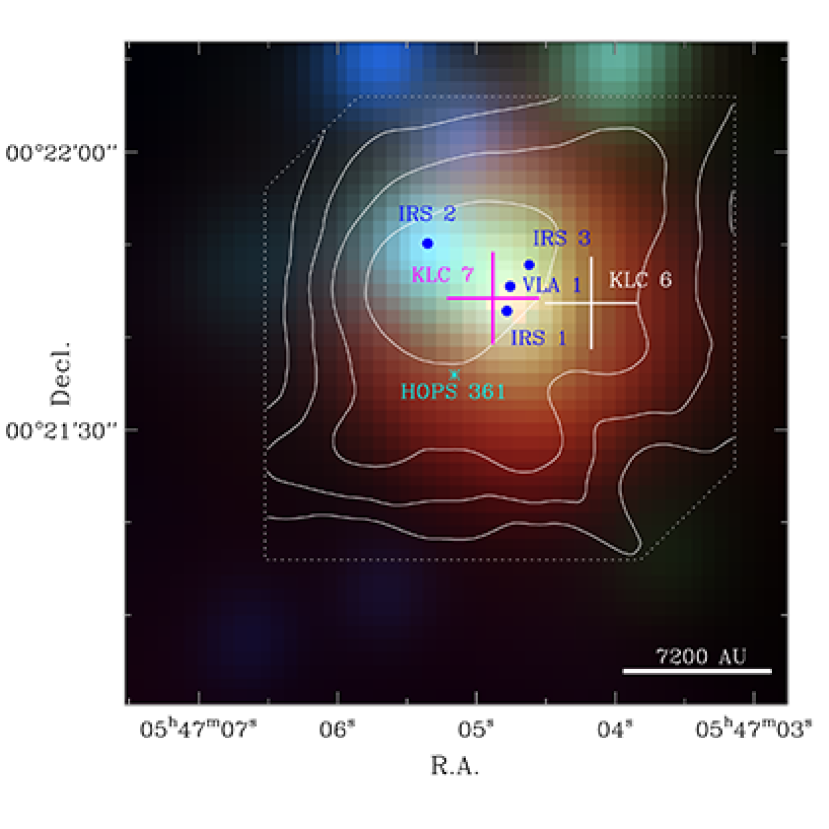
Mapping observations in the H2O line were carried out on 2011 November 25 with a grid spacing of 65′′. The source positions of all the velocity components detected on this day agree to each other within the uncertainty. The best-fit position of the source (KLC 6) is 9′′ west of IRS 1 (Figure 14). All the four radio sources in the NGC 2071 region (IRS 1–3 and VLA 1) display H2O maser activities (Genzel & Downes, 1979; Torrelles et al., 1998; Trinidad et al., 2009), but there is no previous report of maser at the position of KLC 6. Interestingly, KLC 6 is at the intersection of the IRS 1 western outflow and the IRS 3 southwestern outflow, and it is difficult to point out the object responsible for the excitation of the KLC 6 maser. As the position difference between KLC 6 and the previously known masers is less than 2 rms of pointing uncertainty, it is possible that KLC 6 may not be a new maser.
The CH3OH lines of KLC 7 (Figure 13) have a peak velocity close to the systemic velocity of the cloud and show a width of 3.2 km s-1, larger than the line widths of KLC 1/5 by a factor of 4. There is a possibility that the CH3OH spectra of KLC 7 may have double peaks. In this case, the line may consist of a weak maser overlaid upon thermal emission. The NGC 2071 region was mapped in the 95 GHz line with a grid spacing of 10′′. The 95 GHz map shows that the source is extended over a region of 50′′ (Figure 14). By contrast, Haschick & Baan (1989) found that the CH3OH 36 GHz maser line has velocities redshifted by 5.5 km s-1, and Liechti & Wilson (1996) reported that the 36 GHz maser source is located 20′′ south of IRS 1–3. The large line width, extended source size, and dissimilarity to the 36 GHz maser suggest that the CH3OH 44/95/133 GHz line emission of KLC 7 may be thermal. The CH3OH lines probably trace the dense molecular gas and outflows in and around the NGC 2071 cluster (Garay et al., 2000).
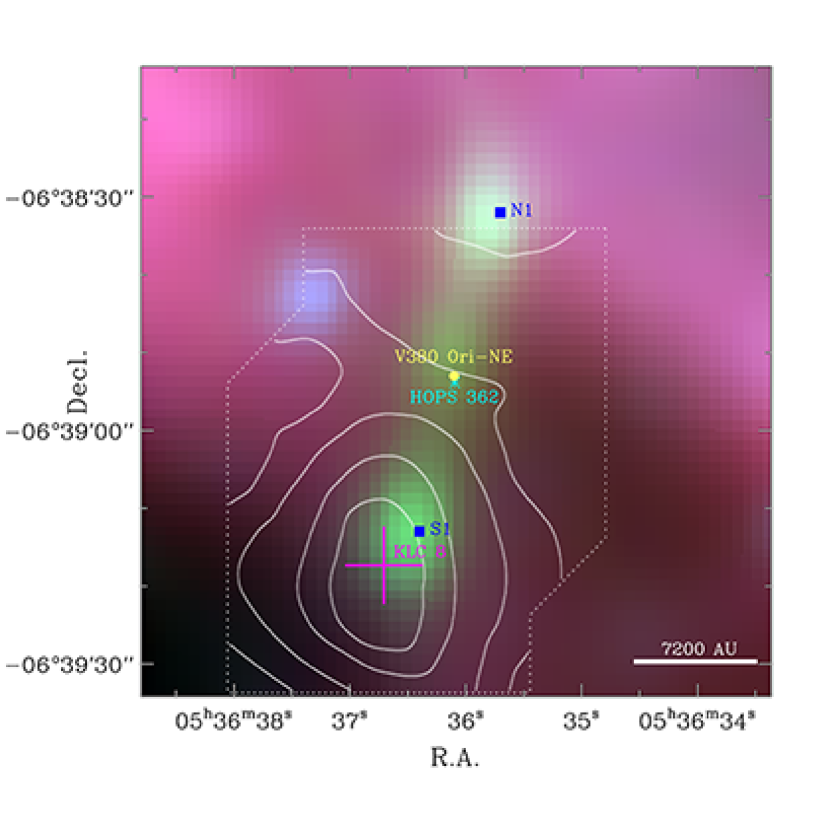
4.6 KLC 8 in the HOPS 362 Field (V380 Ori NE)
V380 Ori NE (HOPS 362) is a deeply embedded protostar (Davis et al., 2000). Zavagno et al. (1997) classified it as a class I YSO, but Stanke (2003) considered it class 0. Stanke (2003) suggested that V380 Ori NE drives a molecular jet. The bipolar outflow of V380 Ori NE shows an interesting point-symmetric morphology in that the flow direction changes by 20° when imaged in a larger scale (Davis et al., 2000; Stanke, 2003). Davis et al. (2000) suggested that the jet is either deflected by the ambient cloud or driven by a precessing object.
The three CH3OH lines were detected toward the V380 Ori NE region (Figure 15). The CH3OH lines of KLC 8 have a peak velocity redshifted by 1.2 km s-1 with respect to the systemic velocity of the cloud, a line width of 4 km s-1, and prominent redshifted line wings. The V380 Ori NE region was mapped in the 95 GHz line with a grid spacing of 10′′. The peak position is near the H2 line emission knots S1–S3 (Figure 16), which is associated with the redshifted outflow lobe R1 seen in the CO = 4 3 line (Davis et al., 2000). The 95 GHz map shows that the source is marginally resolved in the north-south direction and unresolved in the east-west direction (Figure 16). The map does not quite cover the northern (blueshifted) outflow area but shows a hint of CH3OH emission in that direction. The large line width, extended source size, and the elongation suggest that the CH3OH line emission of KLC 8 may be thermal and related to the southern outflow.

While the detection of CH3OH emission shows the presence of shocked gas near the bend of the outflow lobe, it does not necessarily support or refute the deflection or precession models (Davis et al., 2000). In the deflection scenario, the CH3OH emission may trace the dense gas deflecting the jet. In the precession scenario, it may trace the ambient cloud shocked freshly by the jet carving a cavity in a new direction.
5 DISCUSSION
Most of the stars in the Orion molecular cloud complex form in clusters. This clustering should be taken into account in the interpretation of the survey. The targets were HOPS protostars showing CO line wings. The CO observations, however, were made with a large beam, and the detected CO line wings are not necessarily produced by the outflows of the target protostars. For example, the CO wings of HOPS 361 are most likely coming from the outflows driven by NGC 2071 IRS 1/3. Therefore, the survey targets are not necessarily low-mass protostars driving molecular outflows, and they may rather be considered as typical star-forming regions around low-mass protostars forming in clusters.
The clustering makes the interpretation of the single-dish survey complicated because the main beam area can contain multiple protostars. The consequence of clustering is obvious in the survey results. Many of the detected masers are excited not by the target HOPS protostars but by other YSOs in the survey fields. For example, the exciting sources of KLC 2/3/6 are HH 1–2 VLA 1, HH 1–2 VLA 3, and NGC 2071 IRS 1/3, respectively. There are also some ambiguous cases. Therefore, careful mapping is essential in single-dish surveys of masers.
While the effect of clustering in each region is difficult to predict, we may assume that the degree of clustering (i.e., the number of protostars in a main-beam area) in the survey regions is more or less similar within an order of magnitude. The reason is that all the target sources in the survey are at similar distances and that excessively complicated regions, such as the Orion KL region, were excluded.
5.1 H2O Masers
The nominal detection rate of the single-pointing H2O maser survey is 4% (4/99). The Orion KL masers hindered the detection of maser from nearby sources, and the detection rate considering only the unaffected targets is 5% (3/60). Since the mapping observations revealed two maser sources in the HOPS 167 field, the detection rate of the full survey is 7% (4/60). This value is somewhat smaller than the detection rate of 20–70% from previous H2O maser surveys of YSOs in various stages of evolution (Churchwell et al., 1990; Furuya et al., 2001; Sridharan et al., 2002; Wilking et al., 1994; Bae et al., 2011). The relatively low rate from this survey is not surprising because the targets are low-mass protostars. Previous surveys are usually biased toward well-known (luminous) YSOs, massive star-forming regions, or known maser sources. For example, Furuya et al. (2001) reported a detection rate of 40% for Class 0, 4% for Class I, and 0% for Class II low-mass YSOs. Their sample, however, consists of protostars known before the data became available. The results of this work is probably more representative of typical low-mass star-forming regions.
In the regions described in Section 4, a typical number of known protostars in a KVN main beam area is 4. Then the detection rate, defined as the number of detected masers per protostar in the covered region, would be 1.7%. Another way to consider the clustering is to focus on the original target sources only, not considering the off-center sources. HOPS 182 (L1641N MM1/3) is the only detection among them, and the detection rate would be 1.7% (1/60). Either way, the per-protostar detection rate is 1.7%. Therefore, an H2O maser is a rare phenomenon in low-mass star formation.
Another factor complicating the interpretation is the time variability. Some of the masers were detectable only at a certain epoch. The maser in the HOPS 96 field was detected once in four observing runs. KLC 2 was detected 4 times in five runs, and KLC 3 was detected 2 times in five runs. KLC 4/6 were detectable in all four runs. Then the detection probability of these sources during a given run is 70%. The detection rate (detections per protostar at a given epoch) of the survey would be 1.2%.
The H2O maser is a good signpost of star formation activities, especially shocked regions around the base of jets and on the disks. Once detected, the H2O maser is a useful tool providing information on the mass accretion and ejection processes on a small scale. The rarity of H2O masers, however, is one of the limitations of this tool because 98% of the protostars would not exhibit detectable H2O maser emission. In other words, a non-detection of H2O maser toward a known protostar would not provide much constraints on the nature of the object.
One of the important properties of masers is that the radiation can be anisotropic. Since the H2O masers in star-forming regions are produced in structures that are far from spherical, the detection of masers can depend on the geometry of the emission/amplification region (Elitzur, 1992). Therefore, the small detection rate above means that H2O masers are rarely detectable, but does not necessarily imply that they are rarely occurring.
5.2 CH3OH Lines
The survey resulted in the detection of four CH3OH sources. For a given source, the three CH3OH lines used in the survey have similar spectral profiles, which strongly suggests that they have the same origin. Judging from several parameters measured and from information in the literature, KLC 1 in the OMC 2 region is clearly a maser source, KLC 5 in L1641N is an ambiguous case, and KLC 7/8 are thermal emission sources. It is possible, however, that the detected emission can be a mixture of maser and thermal components to a certain degree (Kalenskii et al., 2010).
The detection rate of CH3OH class I masers is even smaller than that of the H2O masers. Since there are only one or two masers detected, the nominal detection rate of the survey in the 44 GHz line is 1–2%. The detection rates of CH3OH masers toward high-mass protostellar candidates range from 30% to 50% (Fontani et al., 2010; Haschick et al., 1990). It is clear that low-mass protostars have a much smaller detection rate for CH3OH class I masers.
Unlike H2O masers, CH3OH class I masers are often detected far from protostars, which may be one of the reasons for the low detection rate. Since the number of detections is so small, it is difficult to make a further analysis. The effect of clustering for the CH3OH line is expected to be smaller than that for the H2O line because the beam size of the 44 GHz line is a factor of two smaller. KLC 1, however, is in a relatively crowded region (OMC 2 FIR 3/4) and probably not excited by the original target (HOPS 64). Therefore, the per-protostar detection rate may be much smaller than 1%, and the CH3OH class I maser is an even rarer phenomenon, at least for low-mass protostars.
6 SUMMARY
Ninety-nine protostars in the Orion molecular cloud complex were observed in the H2O maser line at 22 GHz and the CH3OH class I maser lines at 44, 95, and 133 GHz with the KVN antennas in its single-dish telescope mode. The target sources are protostars identified using the infrared observations with the Spitzer Space Telescope. The survey areas may be considered as typical regions around low-mass protostars at the same distance and in similar environments. The main results are summarized as follows:
1. The H2O maser line was detected toward four target sources (HOPS 96, 167, 182, and 361). The H2O masers showed significant variability in intensity and velocity on monthly timescales.
2. Regions around detected H2O masers were mapped to identify the YSOs responsible for exciting the masers. KLC 2/3 in the HOPS 167 field may be excited by HH 1–2 VLA 3 and VLA 1, respectively. The VLA 1 H2O maser is a new detection. KLC 4 in the HOPS 182 field may be excited by L1641N MM1/3. KLC 6 in the HOPS 361 field may be excited by NGC 2071 IRS 1/3. The maser in the HOPS 96 field may be excited by one of the YSOs in the OMC 3 SIMBA condensations, which is also a new detection.
3. The detection rate of H2O masers, defined as number of detections per survey field, is 5–7%. This value is lower than those of previous surveys probably because the targets in this survey are low-mass protostars. The detection rate, defined as detections per protostar, is 2%. This small rate suggests that the H2O maser of low-mass protostar is a rarely detectable phenomenon.
4. The CH3OH 44, 95, and 133 GHz lines were detected toward four target sources (HOPS 64, 182, 361, and 362). The CH3OH lines did not show significant variability and have peak velocities within 1 km s-1 relative to the systemic velocities of the ambient dense clouds. The line width is a parameter useful for distinguishing maser and thermal emission, and the maser-thermal boundary is at 2 km s-1.
5. Mapping observations in the 95 GHz line show that the detected CH3OH sources are related to molecular outflows. KLC 1 in the HOPS 64 field is most likely a maser source. Its exciting source may be one of the protostars in the OMC 2 FIR 3/4 clusters. KLC 5 in the HOPS 182 field is probably a maser source, but interferometric observations are needed to verify its nature. It appears related to the jet driven by L1641N MM1/3. KLC 7/8 are probably thermal emission sources. KLC 7 in the HOPS 361 field is related with the dense cloud core and outflows in and around the NGC 2071 IRS 1–3 cluster. KLC 8 in the HOPS 362 field is related with the southern molecular outflow of V380 Ori NE.
6. The per-field detection rate of CH3OH class I masers is 1–2%. The per-protostar detection rate may be much smaller than 1%. This small rate suggests that CH3OH class I masers associated with low-mass protostar is an extremely rare phenomenon.
References
- Bae et al. (2011) Bae, J.-H., Kim, K.-T., Youn, S.-Y., et al. 2011, ApJS, 196, 21
- Baudry et al. (1995) Baudry, A., Lucas, R., & Guilloteau, S. 1995, A&A, 293, 594
- Carrasco-González et al. (2012) Carrasco-González, C., Osorio, M., Anglada, G., et al. 2012, ApJ, 746, 71
- Caswell & Breen (2010) Caswell, J. L., & Breen, S. L. 2010, MNRAS, 407, 2599
- Chen et al. (1995) Chen, H., Zhao, J.-H., & Ohashi, N. 1995, ApJ, 450, L71
- Chini et al. (1997) Chini, R., Reipurth, B., Ward-Thompson, D., et al. 1997, ApJ, 474, L135
- Chini et al. (2001) Chini, R., Ward-Thompson, D., Kirk, J. M., et al. 2001, A&A, 369, 155
- Choi et al. (1993) Choi, M., Evans, N. J., II, & Jaffe, D. T. 1993, ApJ, 417, 624
- Choi et al. (2012) Choi, M., Kang, M., Byun, D.-Y., & Lee, J.-E. 2012, ApJ, 759, 136
- Choi & Zhou (1997) Choi, M., & Zhou, S. 1997, ApJ, 477, 754
- Churchwell et al. (1990) Churchwell, E., Walmsley, C. M., & Cesaroni, R. 1990, A&AS, 83, 119
- Comoretto et al. (1990) Comoretto, G., Palagi, F., Cesaroni, R., et al. 1990, A&AS, 84, 179
- Cragg et al. (1992) Cragg, D. M., Johns, K. P., Godfrey, P. D., & Brown, R. D. 1992, MNRAS, 259, 203
- Cyganowski et al. (2009) Cyganowski, C. J., Brogan, C. L., Hunter, T. R., & Churchwell, E. 2009, ApJ, 702, 1615
- Davis et al. (2000) Davis, C. J., Dent, W. R. F., Matthews, H. E., Coulson, I. M., & McCaughrean, M. J. 2000, MNRAS, 318, 952
- Davis et al. (2009) Davis, C. J., Froebrich, D., Stanke, T., et al. 2009, A&A, 496, 153
- Eislöffel (2000) Eislöffel, J. 2000, A&A, 354, 236
- Elitzur (1992) Elitzur, M. 1992, ARA&A, 30, 75
- Elitzur et al. (1989) Elitzur, M., Hollenbach, D. J., & McKee, C. F. 1989, ApJ, 346, 983
- Felli et al. (2007) Felli, M., Brand, J., Cesaroni, R., et al. 2007, A&A, 476, 373
- Fischer et al. (2010) Fischer, W. J., Megeath, S. T., Ali, B., et al. 2010, A&A, 518, L122
- Fontani et al. (2010) Fontani, F., Cesaroni, R., & Furuya, R. S. 2010, A&A, 517, A56
- Furuya et al. (2005) Furuya, R. S., Kitamura, Y., Wootten, A., Claussen, M. J., & Kawabe, R. 2005, A&A, 438, 571
- Furuya et al. (2001) Furuya, R. S., Kitamura, Y., Wootten, A., Claussen, M. J., & Kawabe, R. 2001, ApJ, 559, L143
- Gâlfalk & Olofsson (2008) Gâlfalk, M., & Olofsson, G. 2008, A&A, 489, 1409
- Garay et al. (2000) Garay, G., Mardones, D., & Rodríguez, L. F. 2000, ApJ, 545, 861
- Gatley et al. (1974) Gatley, I., Becklin, E. E., Mattews, K., et al. 1974, ApJ, 191, L121
- Gaume et al. (1998) Gaume, R. A., Wilson, T. L., Vrba, F. J., Johnston, K. J., & Schmid-Burgk, J. 1998, ApJ, 493, 940
- Genzel & Downes (1977) Genzel, R., & Downes, D. 1977, A&AS, 30, 145
- Genzel & Downes (1979) Genzel, R., & Downes, D. 1979, A&A, 72, 234
- Goddi et al. (2005) Goddi, C., Moscadelli, L., Alef, W., et al. 2005, A&A, 432, 161
- Han et al. (2013) Han, S.-T., Lee, J.-W., Kang, J., et al. 2013, PASP, 125, 539
- Haschick & Baan (1989) Haschick, A. D., & Baan, W. A. 1989, ApJ, 339, 949
- Haschick et al. (1990) Haschick, A. D., Menten, K. M., & Baan, W. A. 1990, ApJ, 354, 556
- Haschick et al. (1983) Haschick, A. D., Moran, J. M., Rodriguez, L. F., & Ho, P. T. P. 1983, ApJ, 265, 281
- Ho et al. (1982) Ho, P. T. P., Haschick, A. D., Moran, J. M., & Rodriguez, L. F. 1982, BAAS, 14, 927
- Kalenskii et al. (2010) Kalenskii, S. V., Johansson, L. E. B., Bergman, P., et al. 2010, MNRAS, 405, 613
- Kim et al. (2008) Kim, M. K., Hirota, T., Honma, M., et al. 2008, PASJ, 60, 991
- Kurtz et al. (2004) Kurtz, S., Hofner, P., & Álvarez, C. V. 2004, ApJS, 155, 149
- Kwon et al. (2010) Kwon, J., Choi, M., Pak, S., et al. 2010, ApJ, 708, 758
- Lada et al. (1991) Lada, E. A., Bally, J., & Stark, A. A. 1991, ApJ, 368, 432
- Lee et al. (2011) Lee, S.-S., Byun, D.-Y., Oh, C. S., et al. 2011, PASP, 123, 1398
- Liechti & Wilson (1996) Liechti, S., & Wilson, T. L. 1996, A&A, 314, 615
- Lis et al. (1998) Lis, D. C., Serabyn, E., Keene, J., et al. 1998, ApJ, 509, 299
- Lo et al. (1975) Lo, K. Y., Burke, B. F., & Haschick, A. D. 1975, ApJ, 202, 81
- Megeath et al. (2012) Megeath, S. T., Gutermuth, R., Muzerolle, J., et al. 2012, AJ, 144, 192
- Menten (1991) Menten K. M. 1991, in Haschick A. D., Ho P. T. P., eds, ASP Conf. Ser. Vol. 16, Atoms, Ions, and Molecules: New Results in Spectral Line Astrophysics. Astron. Soc. Pac., San Francisco, p. 119
- Menten et al. (2007) Menten, K. M., Reid, M. J., Forbrich, J., & Brunthaler, A. 2007, A&A, 474, 515
- Moro-Martín et al. (1999) Moro-Martín, A., Cernicharo, J., Noriega-Crespo, A., & Martín-Pintado, J. 1999, ApJ, 520, L111
- Morris & Knapp (1976) Morris, M., & Knapp, G. R. 1976, ApJ, 204, 415
- Nielbock et al. (2003) Nielbock, M., Chini, R., Mller, S. A. H. 2003, A&A, 408, 245
- Pankonin et al. (1977) Pankonin, V., Winnberg, A., & Booth, R. S. 1977, A&A, 58, L25
- Pendleton et al. (1986) Pendleton, Y., Werner, M. W., Capps, R., & Lester, D. 1986, ApJ, 311, 360
- Persson et al. (1981) Persson, S. E., Geballe, T. R., Simon, T., Lonsdale, C. J., & Baas, F. 1981, ApJ, 251, L85
- Plambeck & Menten (1990) Plambeck, R. L., & Menten, K. M. 1990, ApJ, 364, 555
- Pravdo et al. (1985) Pravdo, S. H., Rodriguez, L. F., Curiel, S., et al. 1985, ApJ, 293, L35
- Reipurth et al. (1993) Reipurth, B., Heathcote, S., Roth, M., Noriega-Crespo, A., & Raga, A. C. 1993, ApJ, 408, L49
- Reipurth et al. (1999) Reipurth, B., Rodríguez, L. F., & Chini, R. 1999, AJ, 118, 983
- Rodríguez et al. (2000) Rodríguez, L. F., Delgado-Arellano, V. G., Gómez, Y., et al. 2000, AJ, 119, 882
- Rodriguez et al. (1990) Rodriguez, L. F., Ho, P. T. P., Torrelles, J. M., Curiel, S., & Canto, J. 1990, ApJ, 352, 645
- Scoville et al. (1986) Scoville, N. Z., Sargent, A. I., Sanders, D. B., et al. 1986, ApJ, 303, 416
- Seth et al. (2002) Seth, A. C., Greenhill, L. J., & Holder, B. P. 2002, ApJ, 581, 325
- Skinner et al. (2009) Skinner, S. L., Sokal, K. R., Megeath, S. T., et al. 2009, ApJ, 701, 710
- Slysh & Kalenskii (2009) Slysh, V. I., & Kalenskii, S. V. 2009, Astronomy Reports, 53, 519
- Snell & Bally (1986) Snell, R. L., & Bally, J. 1986, ApJ, 303, 683
- Snell et al. (1984) Snell, R. L., Scoville, N. Z., Sanders, D. B., & Erickson, N. R. 1984, ApJ, 284, 176
- Sridharan et al. (2002) Sridharan, T. K., Beuther, H., Schilke, P., Menten, K. M., & Wyrowski, F. 2002, ApJ, 566, 931
- Stanke (2003) Stanke, T. 2003, Ap&SS, 287, 149
- Stanke & Williams (2007) Stanke, T., & Williams, J. P. 2007, AJ, 133, 1307
- Stojimirović et al. (2008) Stojimirović, I., Snell, R. L., & Narayanan, G. 2008, ApJ, 679, 557
- Stutz et al. (2013) Stutz, A. M., Tobin, J. J., Stanke, T., et al. 2013, ApJ, 767, 36
- Takahashi et al. (2008) Takahashi, S., Saito, M., Ohashi, N., et al. 2008, ApJ, 688, 344
- Tatematsu et al. (1998) Tatematsu, K., Umemoto, T., Heyer, M. H., et al. 1998, ApJS, 118, 517
- Tatematsu et al. (1993) Tatematsu, K., Umemoto, T., Kameya, O., et al. 1993, ApJ, 404, 643
- Tofani et al. (1995) Tofani, G., Felli, M., Taylor, G. B., & Hunter, T. R. 1995, A&AS, 112, 299
- Torrelles et al. (1998) Torrelles, J. M., Gómez, J. F., Rodríguez, L. F., et al. 1998, ApJ, 505, 756
- Trinidad et al. (2009) Trinidad, M. A., Rodríguez, T., & Rodríguez, L. F. 2009, ApJ, 706, 244
- Val’tts et al. (1995) Val’tts, I. E., Dzyura, A. M., Kalenskii, S. V., et al. 1995, AZh, 72, 22
- Walther et al. (1993) Walther, D. M., Robson, E. I., Aspin, C., & Dent, W. R. F. 1993, ApJ, 418, 310
- Wilking et al. (1994) Wilking, B. A., Claussen, M. J., Benson, P. J., et al. 1994, ApJ, 431, L119
- Wright et al. (2010) Wright, E. L., Eisenhardt, P. R. M., Mainzer, A. K., et al. 2010, AJ, 140, 1868
- Xiang & Turner (1995) Xiang, D., & Turner, B. E. 1995, ApJS, 99, 121
- Zavagno et al. (1997) Zavagno, A., Molinari, S., Tommasi, E., Saraceno, P., & Griffin, M. 1997, A&A, 325, 685